This lesson explores inspecting and modifying service account configurations in Kubernetes, focusing on the dashboard applications interaction with the Kubernetes API.
In this lesson, we will explore how to inspect and modify service account configurations in Kubernetes, focusing on the Kubernetes dashboard application’s interaction with the Kubernetes API.──────────────────────────────
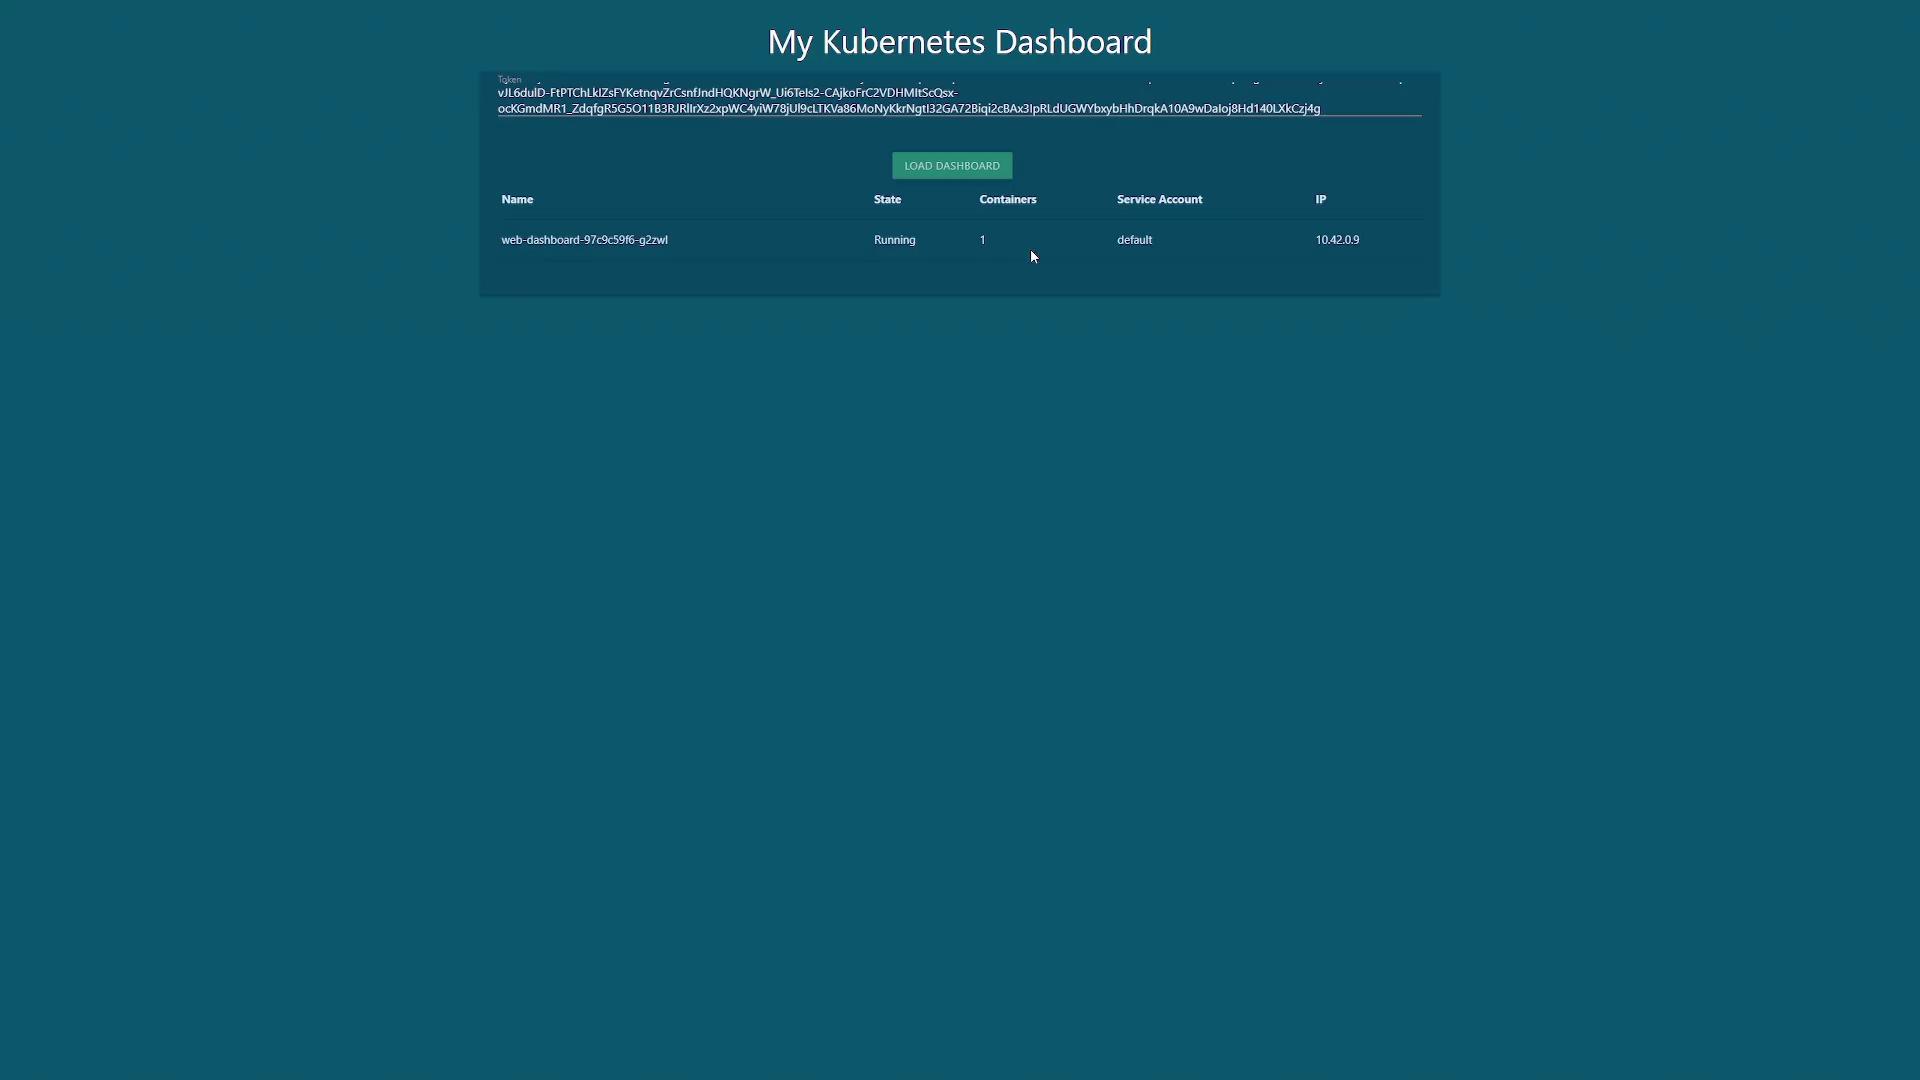
After deploying the dashboard application, inspect its deployment configuration and container image details.
List Deployments:
kubectl get deployments
Describe the Dashboard Deployment:
kubectl describe deployment web-dashboard
Focus on the “Pod Template” section under “Containers.” An example of the output is:
Name: web-dashboardNamespace: defaultCreationTimestamp: Wed, 26 Jul 2023 22:41:47 +0000Labels: <none>Annotations: deployment.kubernetes.io/revision: 1Selector: name=web-dashboardReplicas: 1 desired | 1 updated | 1 total | 1 available | 0 unavailableStrategyType: RollingUpdateMinReadySeconds: 0RollingUpdateStrategy: 25% max unavailable, 25% max surgePod Template: Labels: name=web-dashboard Containers: web-dashboard: Image: gcr.io/kodekloud/customimage/my-kubernetes-dashboard Port: 8080/TCP Host Port: 0/TCP Environment: PYTHONUNBUFFERED: 1 Mounts: <none>Volumes: <none>Conditions: Type Status Reason ---- ------ ------ Available True MinimumReplicasAvailable Progressing True NewReplicaSetAvailableOldReplicaSets: <none>NewReplicaSet: web-dashboard-97c9c59f6 (1 replicas created)Events: Type Reason Age From Message
At one point, an error occurs:
pods is forbidden: User "system:serviceaccount:default:default" cannot list resource "pods" in API group "" in the namespace "default"
This error indicates that the dashboard application is using the default service account, which lacks the required permissions.──────────────────────────────
4. Determining the Service Account Used by the Dashboard Application
The logs and error messages confirm that the default service account is being used. To verify which service account is mounted on the dashboard pod, execute:
kubectl get podkubectl describe pod <pod-name>
Within the pod description, locate the Service Account section, which should indicate it is set to “default.” Additionally, note that the credentials are mounted from:
/var/run/secrets/kubernetes.io/serviceaccount from kube-api-access-swjvh (ro)
This directory is where the dashboard pod accesses its service account tokens and related secrets.──────────────────────────────
5. Creating a New Service Account for the Dashboard
Since the default service account has limited permissions, create a new service account (named dashboard-sa) with enhanced rights.
Create the New Service Account:
kubectl create serviceaccount dashboard-sa
You should see a confirmation message:
serviceaccount/dashboard-sa created
Review RBAC Configurations:Check the RBAC configuration files (e.g., dashboard-sa-role-binding.yaml and pod-reader-role.yaml) located in the /var/rbac/ directory. These files contain role and role-binding settings that grant additional permissions. For more details on RBAC, review the relevant documentation.
Generate an Access Token:To authenticate with the dashboard application, generate an access token for dashboard-sa:
6. Updating the Deployment to Use the New Service Account
To eliminate the need for manual token retrieval, update the dashboard deployment so it automatically uses dashboard-sa.
Export the Current Deployment Configuration:
kubectl get deployment web-dashboard -o yaml > dashboard.yaml
Update the Deployment YAML:Open dashboard.yaml in your preferred editor and locate the pod specification within the spec section. Add the serviceAccountName field with the value “dashboard-sa” under the pod spec. The updated portion should resemble:
You might see a warning about a missing annotation due to changes in resource management history; this warning is harmless as the configuration will be patched automatically.
Verify the Deployment:Check the deployment status by running:
kubectl get deployment
After applying these changes, refresh your dashboard application. The pod will now automatically mount the credentials for dashboard-sa, eliminating the need for manual token entry.──────────────────────────────
By following these steps, you have accomplished the following:
Identified service accounts in the default namespace.
Inspected the token associated with the default service account.
Noted that the dashboard application was using a default account with insufficient permissions.
Created a new service account (dashboard-sa) with enhanced permissions using RBAC.
Updated the dashboard deployment to automatically use the new service account, streamlining the authentication process with the Kubernetes API.
Managing service accounts and RBAC configurations properly is vital for maintaining security and operational efficiency in your Kubernetes environment.