In this walkthrough, we’ll verify how Amazon EKS and Kubernetes self-heal after a Pod deletion, and confirm there’s no impact on end-users by monitoring the application UI, Real User Monitoring (RUM), and control plane metrics in CloudWatch.
1. Verify Pod Auto-Replacement After deleting a Pod, Kubernetes should automatically spin up a new one. Run:
kubectl get pods -n default
Expected output:
NAME READY STATUS RESTARTS AGE petfood-6b56846cbc-85m66 1/1 Running 0 23h petfood-6b56846cbc-x5t16 1/1 Running 0 23h petfood-metric-6bd55449d8-6jp97 1/1 Running 0 23h petfood-metric-6bd55449d8-dbrj8 1/1 Running 0 23h pethistory-deployment-5f96c67c674-t4mhq 2/2 Running 0 34s petsite-deployment-6db68bf8-lv6w4 1/1 Running 0 34s petsite-deployment-6db68bf8-xqs7h 1/1 Running 2 (68m ago ) 23h xray-daemon-jh7ft 1/1 Running 7 (55m ago ) 23h xray-daemon-rtlhh 1/1 Running 8 (55m ago ) 23h
Kubernetes replaces the deleted petsite-deployment Pod within seconds, demonstrating built-in self-healing.
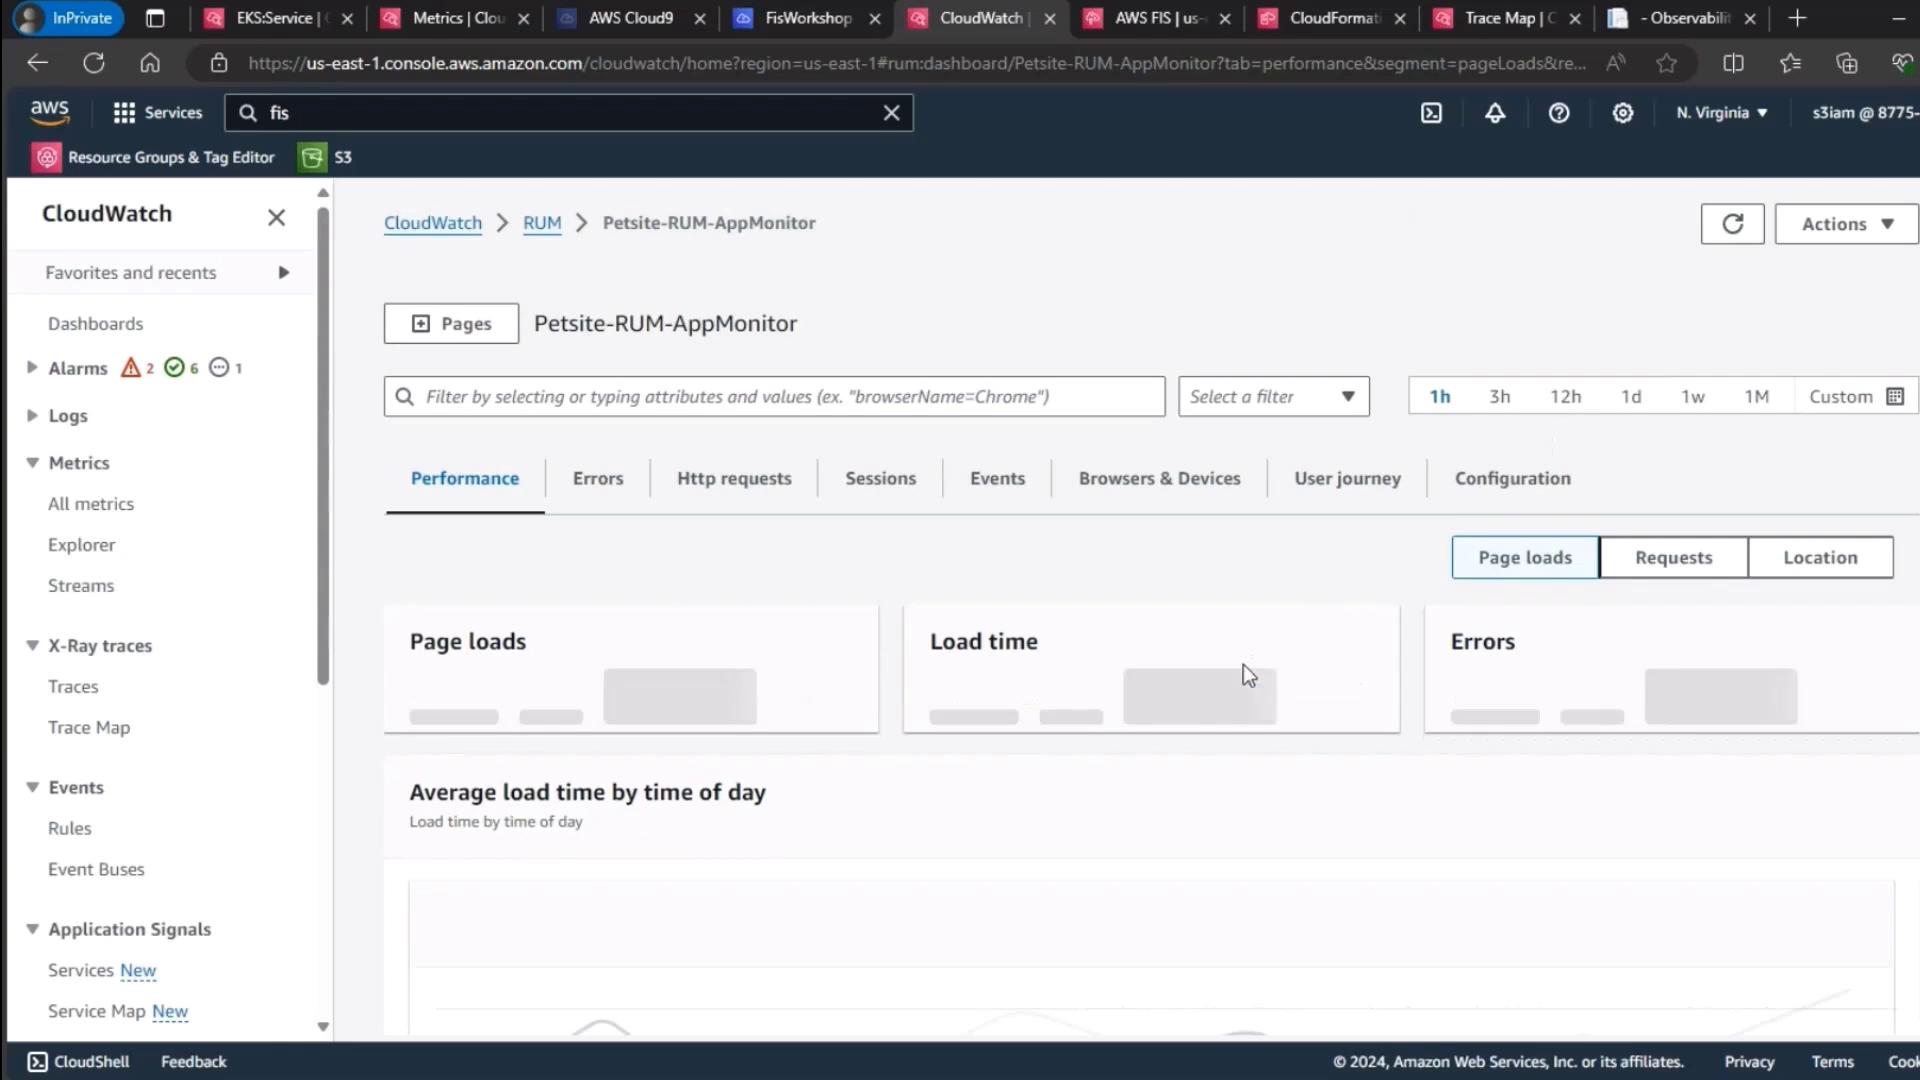
2. Validate Application Availability & RUM Metrics Next, confirm the application UI loads without errors and that RUM data in CloudWatch shows no spike in errors or user frustration signals.
Metric Use Case Observation Page Loads Track user visits Stable Load Time Measure responsiveness Within SLA Errors Detect failures No spikes detected
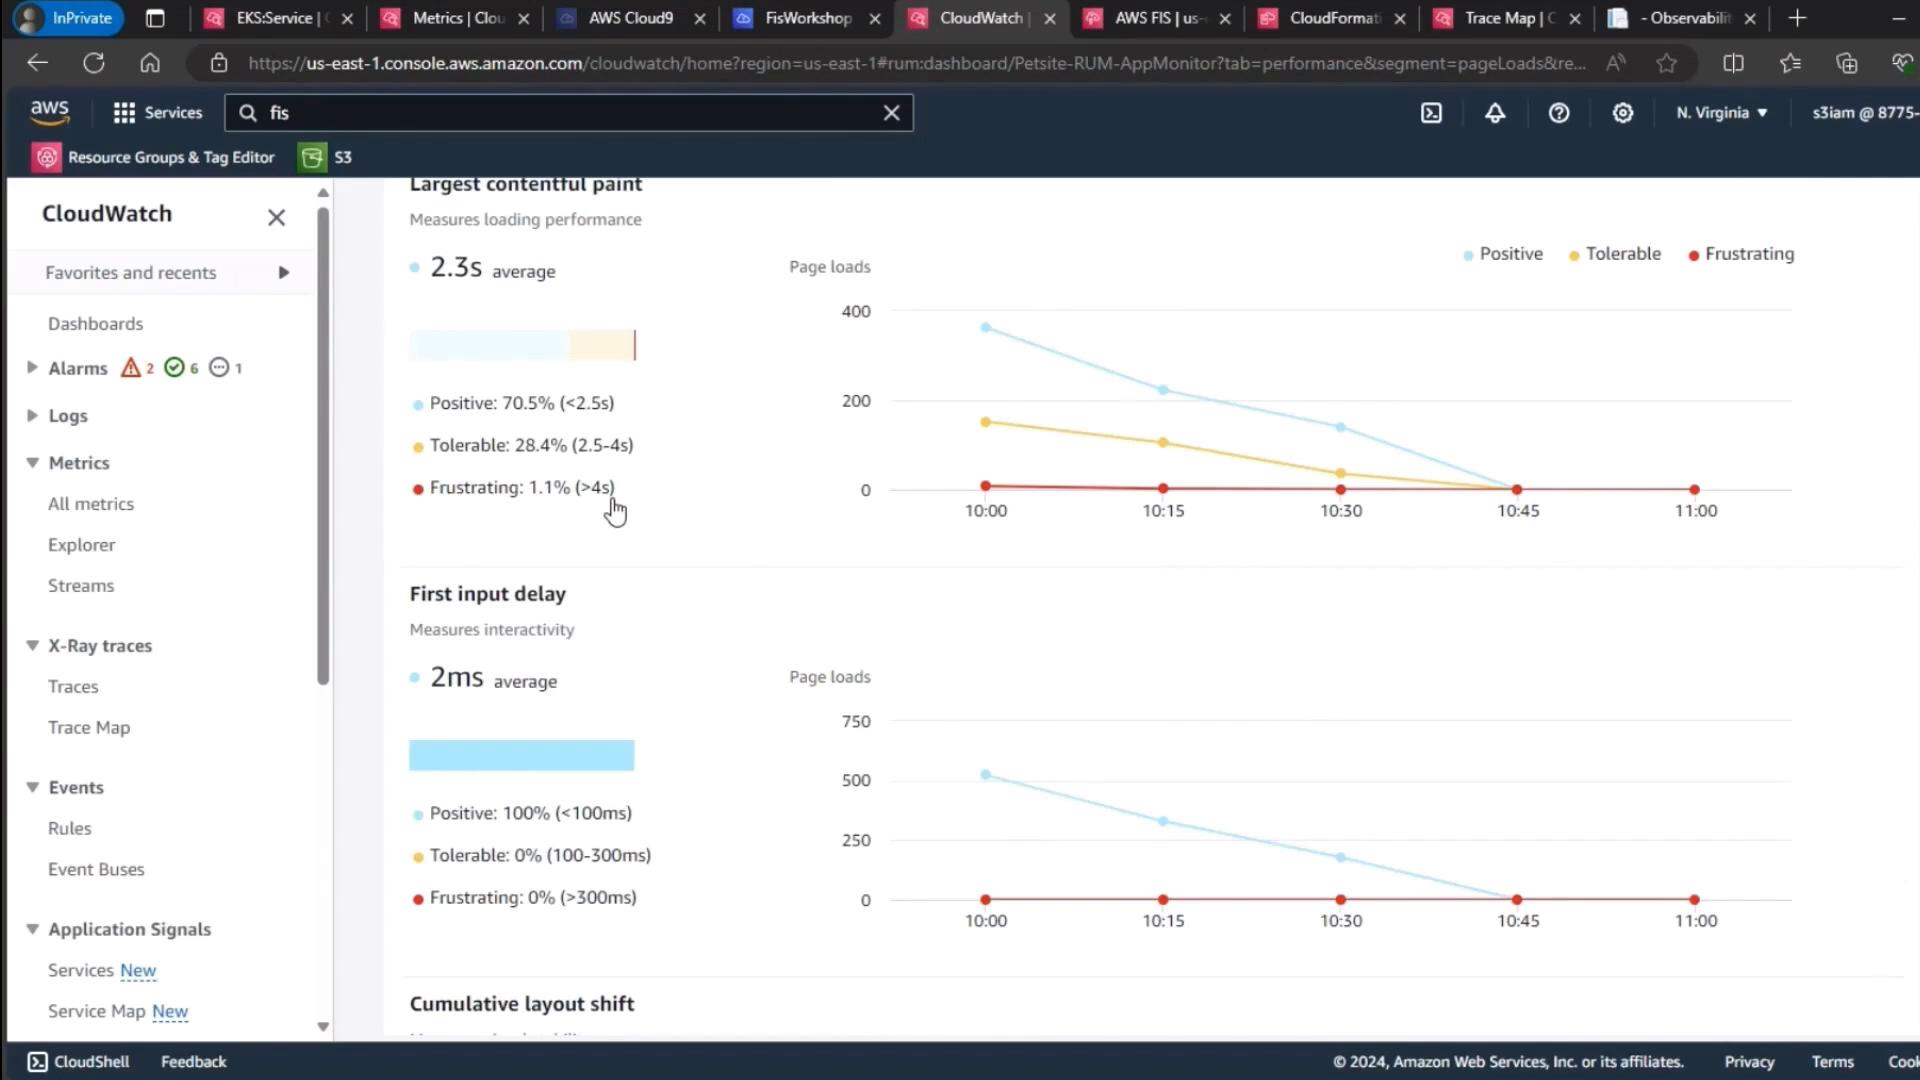
A manual refresh confirms that user frustration signals remain at baseline:
Performance Metric Threshold (ms) Level Largest Contentful Paint < 2500 Positive First Input Delay < 100 Tolerable
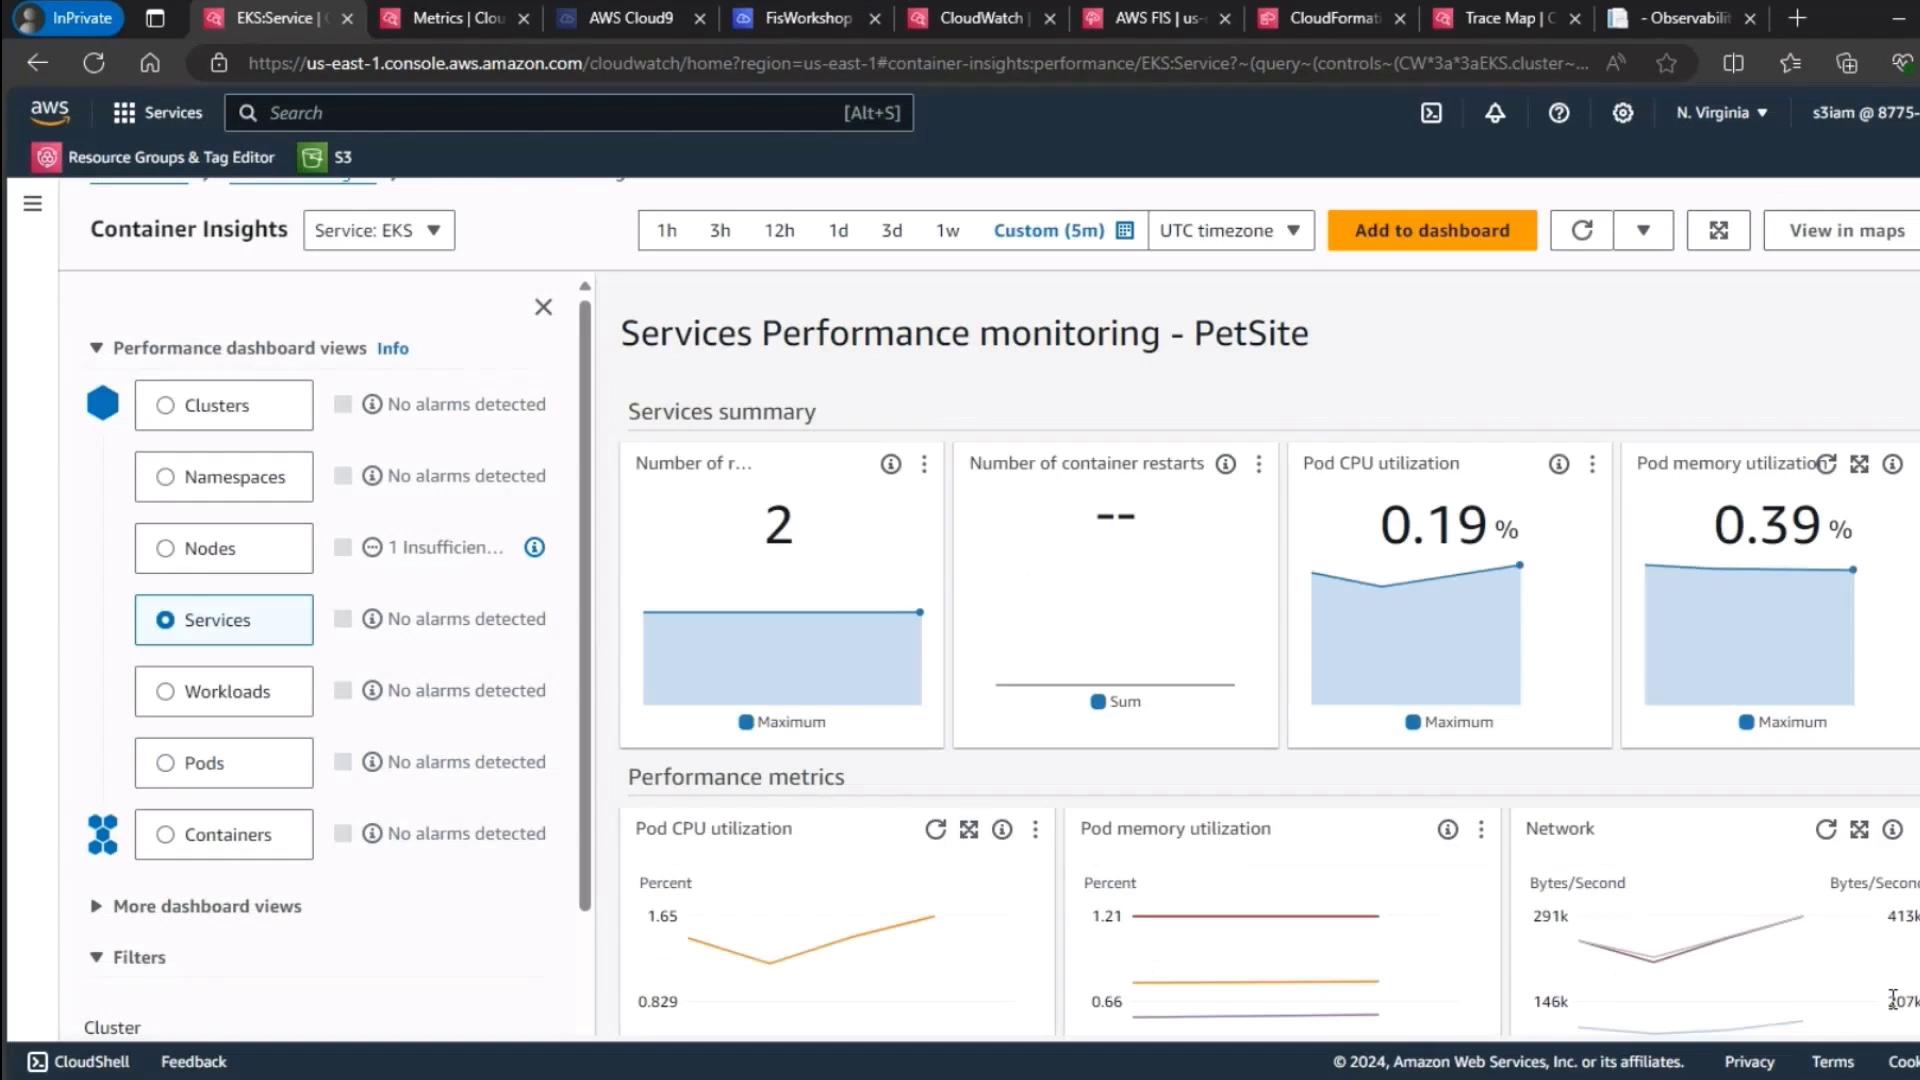
3. Monitor EKS Control Plane Metrics Finally, review your EKS cluster’s control plane metrics to ensure resource utilization stayed consistent throughout the experiment.
Metric Description Observation CPU Utilization Aggregate Pod CPU usage Stable (~30%) Memory Utilization Aggregate Pod memory usage Stable (~40%) Running Pods Total active Pods in default namespace Consistent
Stable control plane metrics confirm that pod deletion did not adversely affect cluster health.
Conclusion This demo highlights Kubernetes’ resilience on Amazon EKS:
Self-healing: Deleted Pods are recreated almost instantly.Zero user impact: No UI errors or RUM spikes.Stable cluster health: Control plane metrics remain steady.
Links and References