| Characteristic | Description |
|---|---|
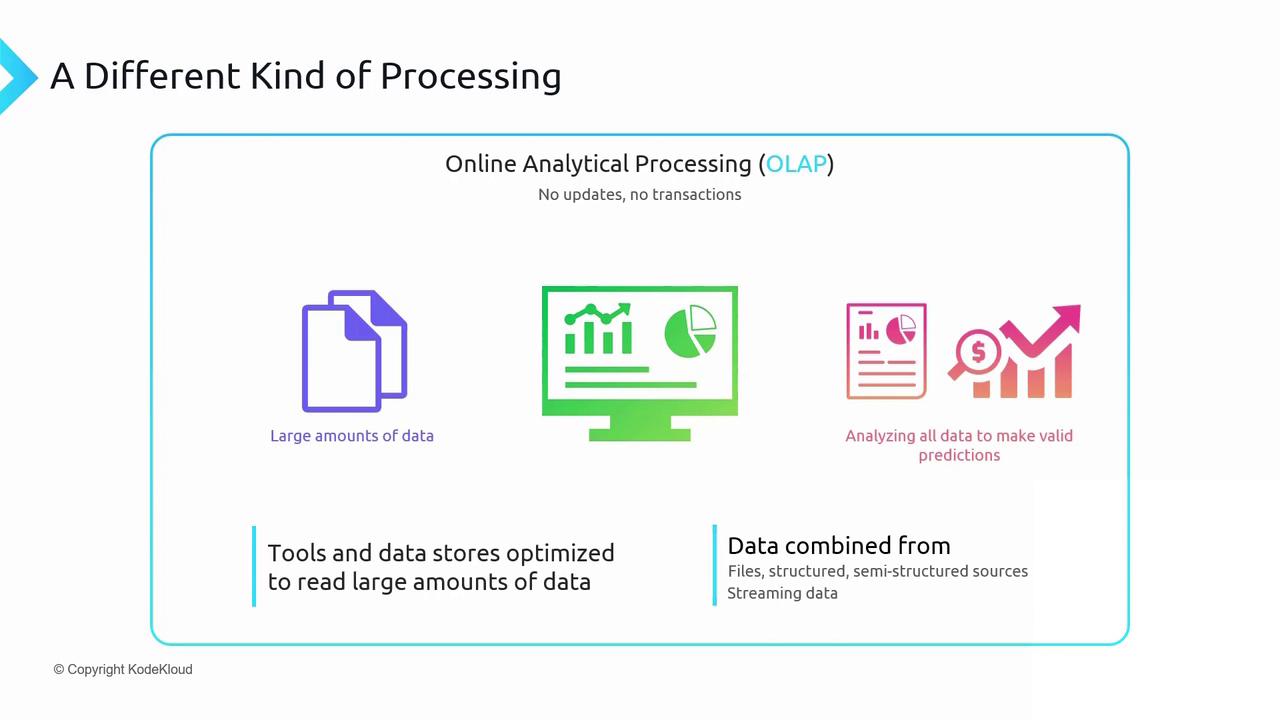
| No in-place updates | Only a continuous load process appends new data; no record modifications or deletions. |
| Large-scale data handling | Efficiently processes terabytes of historical data to derive business insights and trends. |
| Optimized for read-heavy workloads | Uses specialized storage engines tailored for fast aggregations and complex queries. |
Case Study: Sales Forecast Analysis
Consider a scenario where you must predict next year’s revenue. Your data sources include:| Data Source | Storage Service | Description |
|---|---|---|
| Sales forecasts | Azure Blob Storage | Excel files detailing each customer’s projected product volumes. |
| Actual sales | Azure Cosmos DB Table Storage | Semi-structured, globally replicated transaction records. |
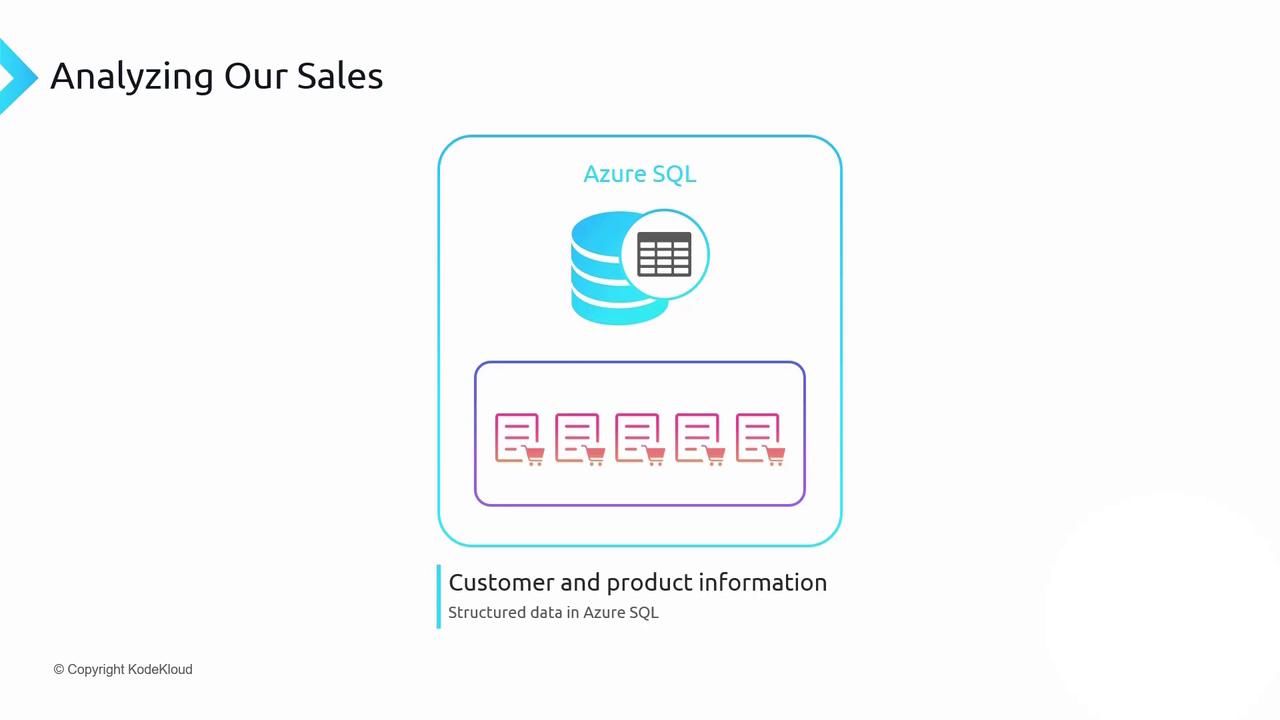
| Customer & product masters | Azure SQL Database | Structured relational tables for customer and product details. |
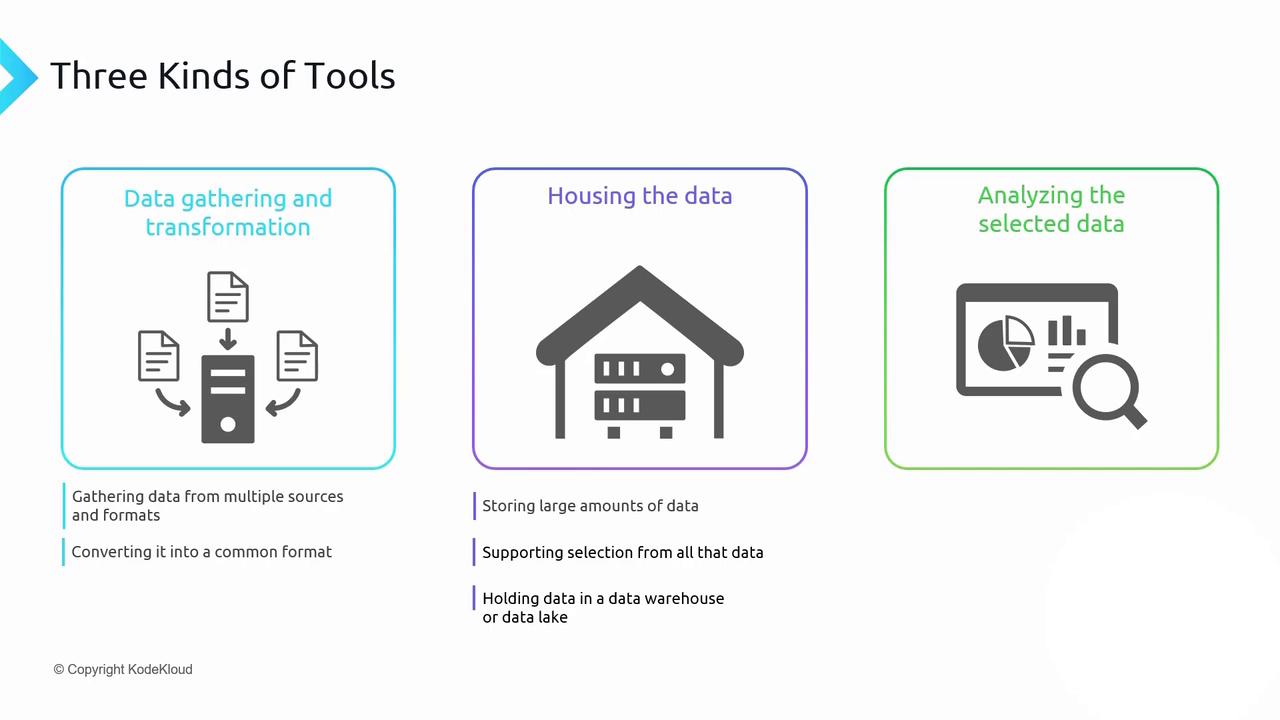
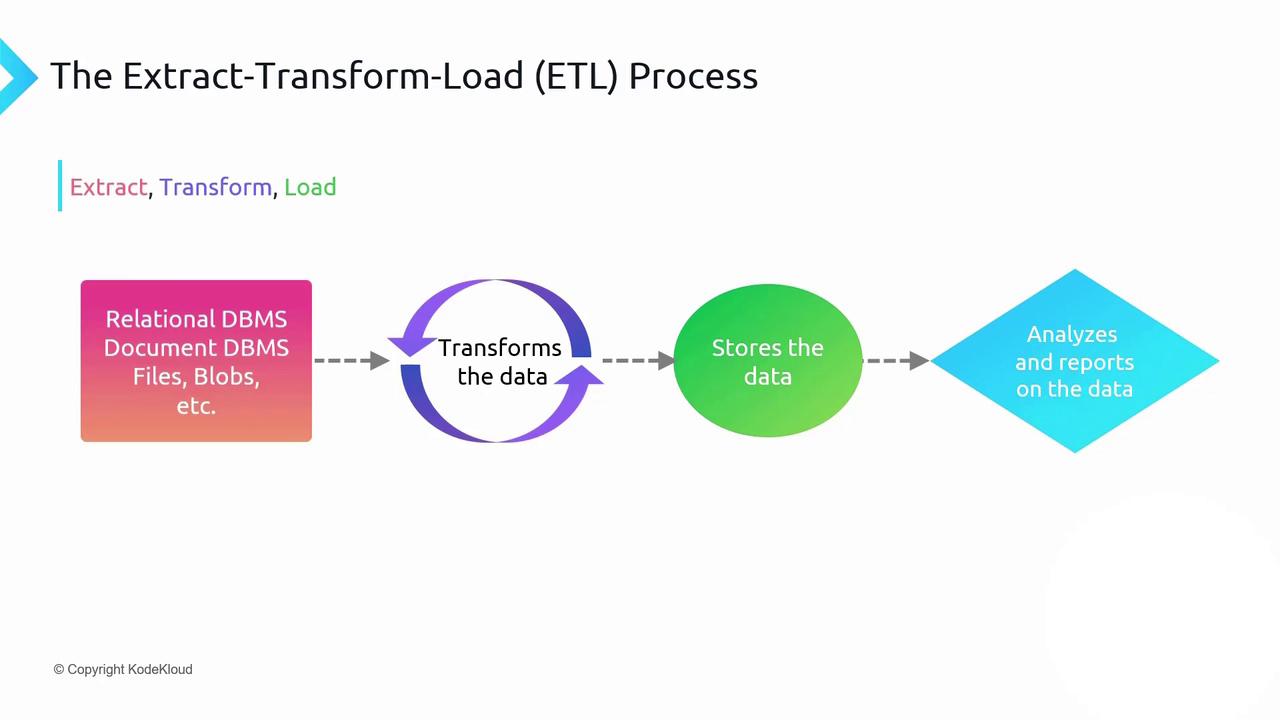
Three Phases of Data Preparation (ETL)
-
Extract
Retrieve blobs from Azure Storage, tables from Cosmos DB, and rows from Azure SQL. -
Transform
Standardize formats, cleanse data, and perform aggregations (e.g., sum of sales by region). -
Load
Persist the cleansed and transformed dataset into a high-performance analytical store such as Azure Synapse Analytics or Azure Data Lake Storage Gen2.
Learn more about ETL best practices in the Azure Data Factory documentation.
Data transfer charges apply when moving data across Azure regions. To minimize egress fees, deploy your ETL pipelines and analytical storage within the same region as your source systems.