

jakepage91/kodekloud-records-store-web-app. Fork and experiment — the app is intentionally simple so you can apply observability and distributed-systems concepts to your own projects.
This article summarizes:
- the repository layout,
- architecture and request/data flow,
- how to run the stack locally (application + observability),
- quick verification and troubleshooting commands,
- useful endpoints and scripts for generating telemetry.
- Core application: FastAPI web service + Celery worker for background tasks, backed by PostgreSQL and RabbitMQ.
- Observability stack: Prometheus, Pushgateway, Alertmanager, Grafana, Loki, Fluent Bit, Jaeger, and supporting exporters/collectors.
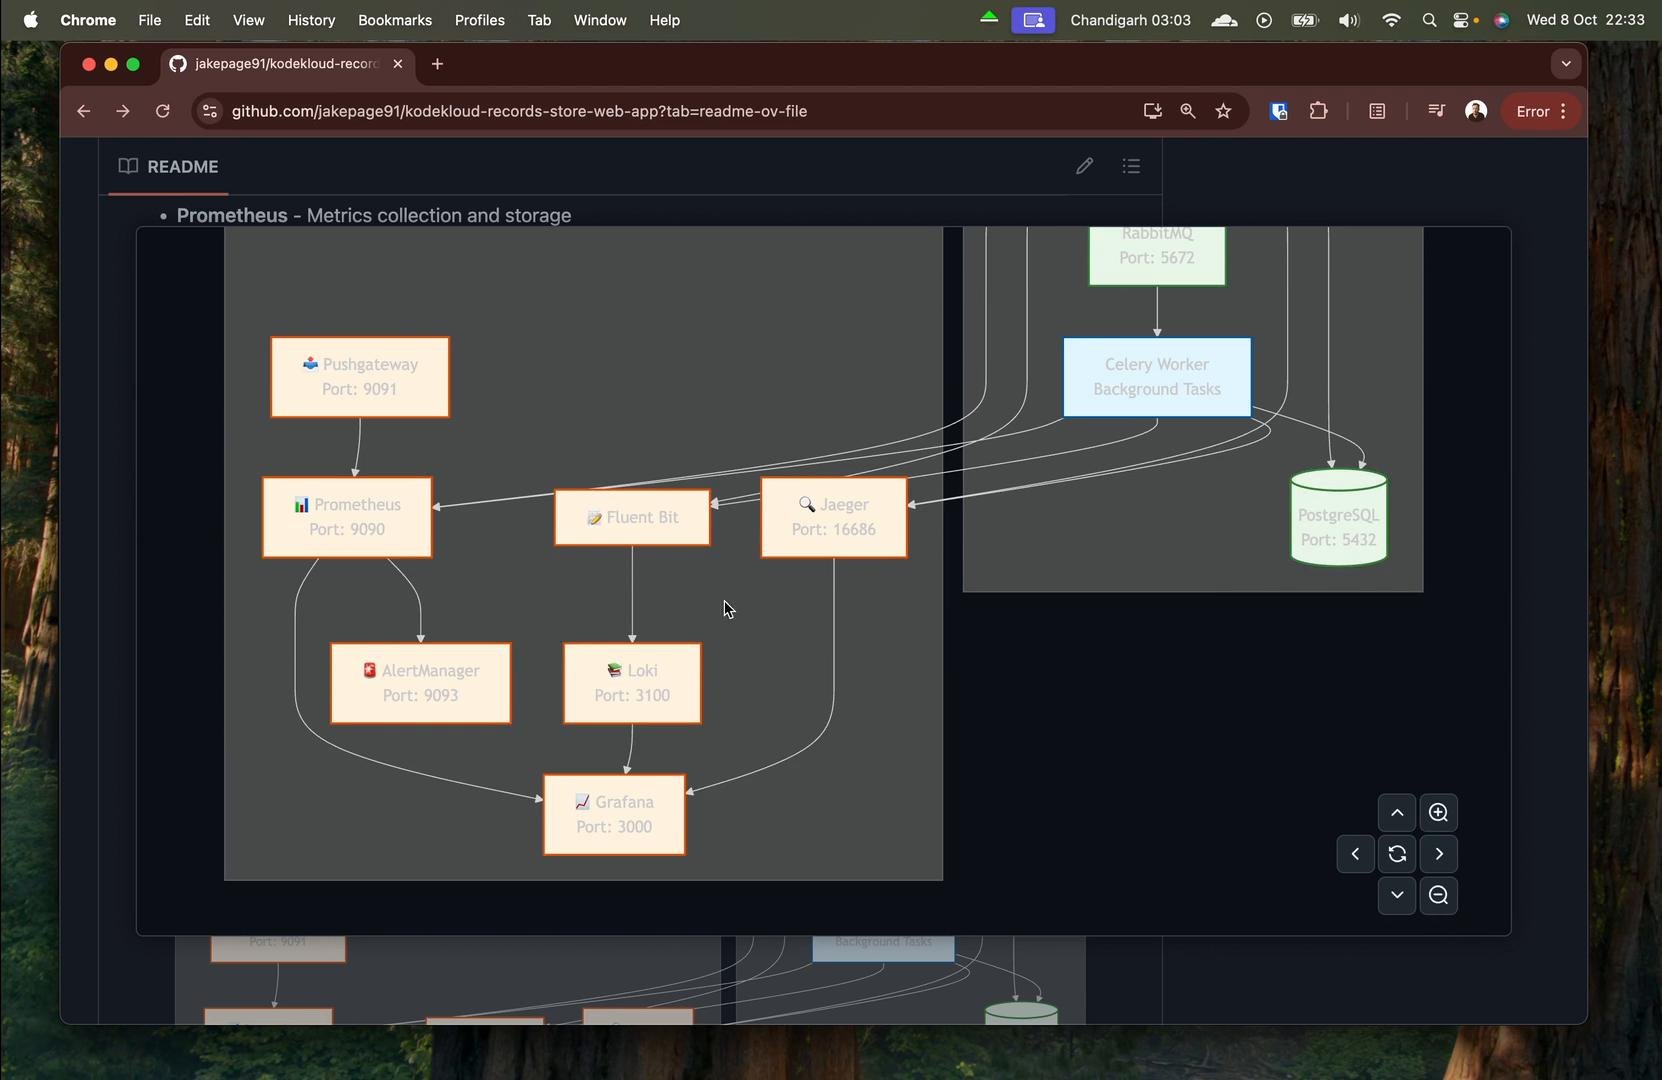
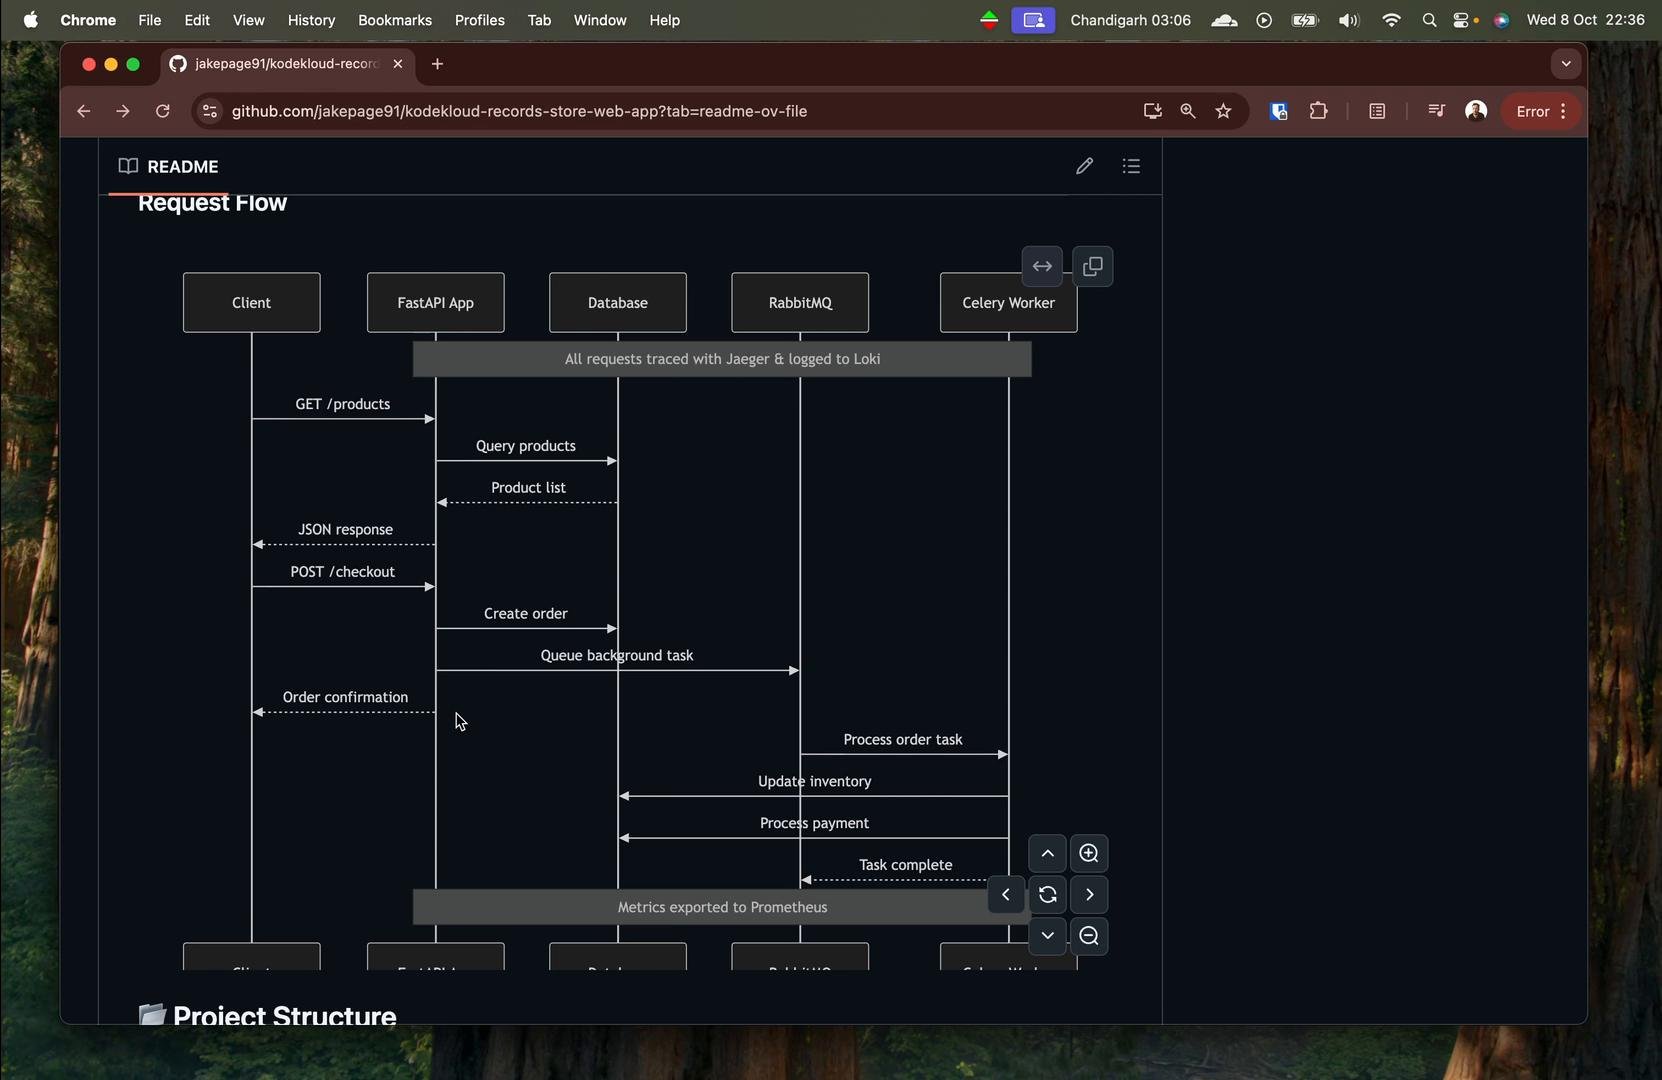
- GET /products — FastAPI → PostgreSQL. (Synchronous API + DB read.)
- POST /checkout — FastAPI enqueues an order to RabbitMQ; Celery workers consume the queue, process payment/inventory asynchronously, and update the database. Telemetry (metrics, logs, traces) is emitted across these steps.
- Clone the repository and change into it:
- Generate a development
.envwith safe defaults:
.env.dev values used by the compose file:
Do not commit real passwords or secrets to the repository. Keep sensitive values in CI/CD secrets or a secure secret store.
docker-compose.yaml composes the application and all observability services. The api service is built from the local Dockerfile and depends on db, rabbitmq, jaeger, fluent-bit, and others to be available.
Example excerpts from the compose file (application and supporting services):
docker-compose.yaml and connected to the shared network. Example service entries and ports:
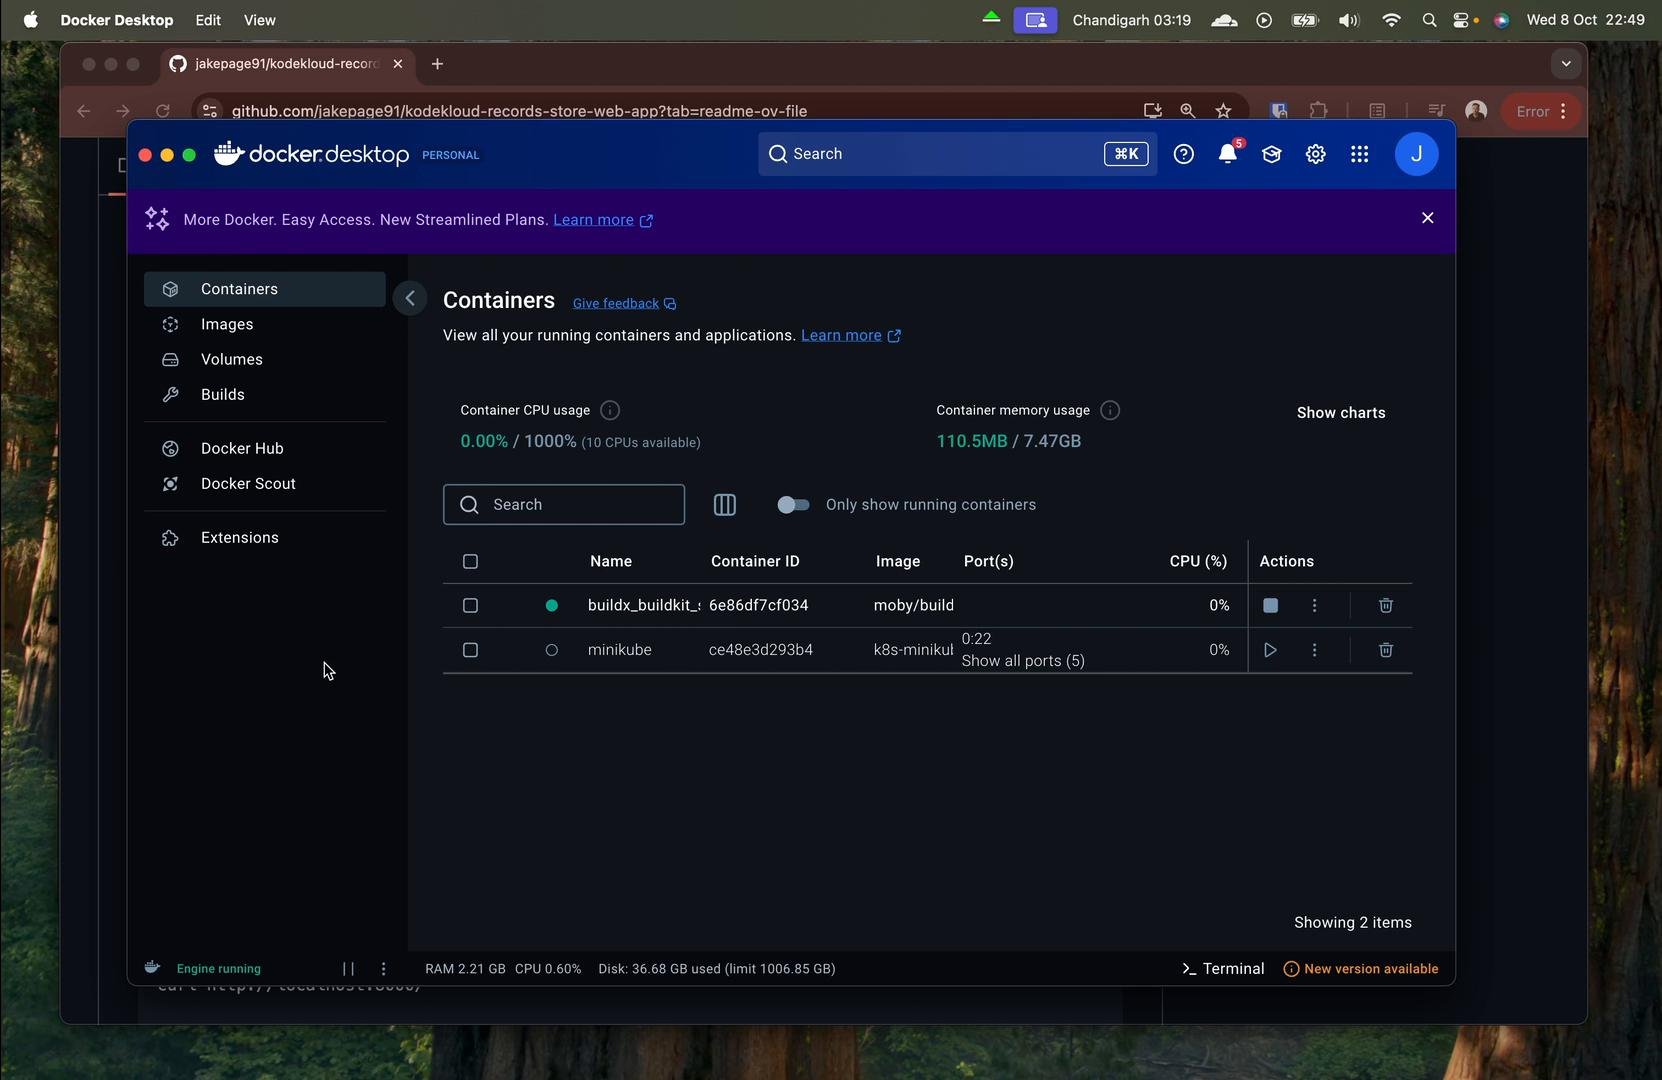
Ensure Docker is running locally
Start your Docker daemon first (Docker Desktop on macOS/Windows, Docker Engine on Linux). Containers must bind to exposed ports when you run docker-compose.
.env.dev:
The
docker-compose down -v command will remove volumes and delete local state (databases, message queues). Back up any important data before running it.docker-compose logs <service>for the service-specific logs,- environment variables in
deploy/environments/.env.dev(missing DB credentials or incorrect hostnames are common causes), - Prometheus config (
config/monitoring/prometheus.yml) for scrape targets and job definitions.
- explore trace propagation and correlation across API + background workers,
- prototype Prometheus metrics and alerts,
- test log forwarding and query patterns in Loki,
- learn how dashboards and alert rules map to SLOs/SLIs.
- FastAPI: https://fastapi.tiangolo.com/
- Celery: https://docs.celeryproject.org/
- PostgreSQL: https://www.postgresql.org/
- RabbitMQ: https://www.rabbitmq.com/
- Prometheus: https://prometheus.io/
- Pushgateway: https://github.com/prometheus/pushgateway
- Grafana: https://grafana.com/
- Jaeger: https://www.jaegertracing.io/
- Loki: https://grafana.com/oss/loki/
- Fluent Bit: https://fluentbit.io/
- Docker & Docker Compose: https://docs.docker.com/ and https://docs.docker.com/compose/