EFK Stack: Enterprise-Grade Logging and Monitoring
Deploying E Commerce Application on K8s
Exploring Application Logs in Kibana
Welcome back! In the previous lesson, we explored how to set up Fluent Bit on a Kubernetes cluster and dove into the details of its various configuration files. At this point, the logs are streaming into Elasticsearch. Now, we will show you how to visualize and query these logs using Kibana.
Accessing the Kibana UI
To access the Kibana user interface from within your Kubernetes cluster, start by displaying the available services with the following command:
kubectl get svc
Next, locate the Kibana service, click on the viewport, enter the displayed port number, and press open. This will launch the Kibana URL in your browser. Once inside Kibana, click on Explore on my own and select Stack Management from the dropdown menu.
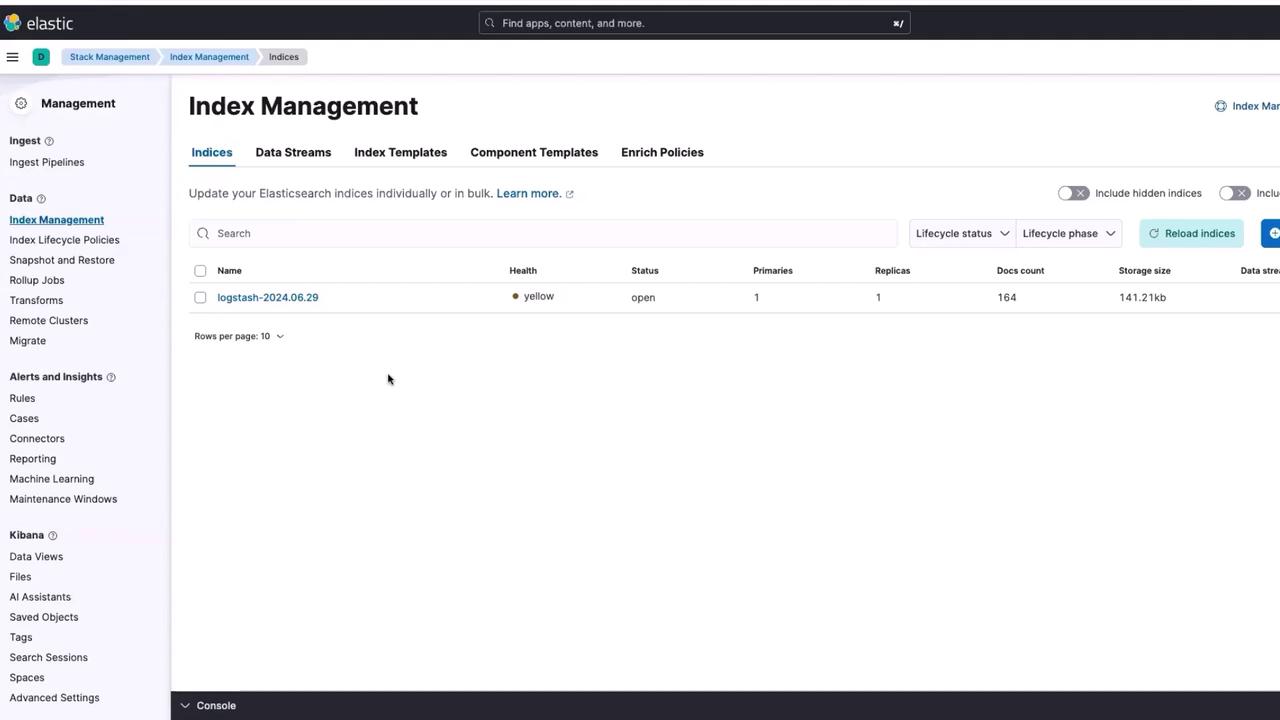
Index Management in Kibana
Within the Stack Management section, click on Index Management. Here, you will notice an index named logstash has been created.
Did You Know?
The index is named "logstash" even though we are using Fluent Bit because our Fluent Bit configuration file is set up to retain the Logstash format. This ensures compatibility with pre-existing logs from ELK stacks.
Fluent Bit Configuration and Logstash Format
Let’s take a closer look at a snippet from our Fluent Bit configuration file where the Logstash format is enabled:
[INPUT]
    Name tail
    Path /var/log/containers/app-event-simulator*.log
    MultiLine.parser docker, cri
    Tag kube.*
    Mem_Buf_Limit 5M
    Skip_Long_Lines On

[INPUT]
    Name systemd
    Tag host.*
    Sysd_Filter _SYSTEMD_UNIT=kubelet.service
    Read_From_Tail On

[FILTER]
    Name kubernetes
    Match kube.*
    Merge_Log On
    Keep_Log Off
    K8S-Logging.Parser On
    K8S-Logging.Exclude On

[OUTPUT]
    Name es
    Match kube.*
    Match elasticsearch
    Batch_Format On
    Retry_Limit False
    Suppress_Type_Name On

[OUTPUT]
    Name host.*
    Match elasticsearch
    Batch_Format On
    Logstash_Prefix node
    Retry_Limit False
    Suppress_Type_Name On
The Logstash format is explicitly enabled to ensure that the logs will be compatible with systems using the ELK stack (Elasticsearch, Logstash, Kibana). This compatibility is crucial for organizations transitioning to Fluent Bit without losing any historical log data.
Below is the complete Fluent Bit configuration used in our deployment. Notice that the configuration enforces Logstash formatting across the pipeline:
[INPUT]
    Name tail
    Path /var/log/containers/app-event-simulator*.log
    multiline.parser docker, cri
    Tag kube.*
    Mem_Buf_Limit 5MB
    Skip_Long_Lines On

[INPUT]
    Name systemd
    Tag host.*
    Systemd_Filter _SYSTEMD_UNIT=kubelet.service
    Read_From_Tail On

[FILTER]
    Name kubernetes
    Match kube.*
    Merge_Log On
    Keep_Log Off
    K8S-Logging.Parser On
    K8S-Logging.Exclude On

[OUTPUT]
    Name es
    Match kube.*
    Match elasticsearch
    Logstash_Format On
    Retry_Limit False
    Suppress_Type_Name On

[OUTPUT]
    Name host.*
    Match elasticsearch
    Logstash_Format On
    Logstash_Prefix node
    Retry_Limit False
    Suppress_Type_Name On
Important
Ensure that Logstash formatting is enabled in your Fluent Bit configuration to avoid any incompatibility issues with legacy log data.
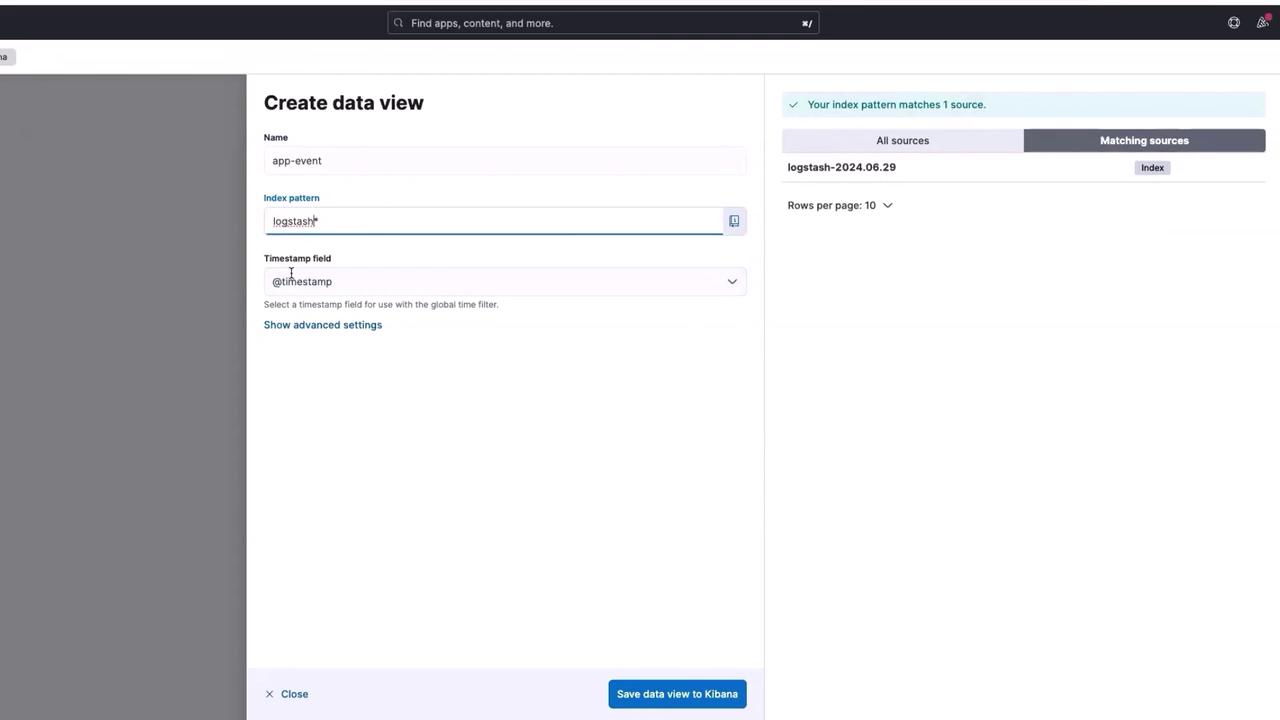
Discovering Logs in Kibana
After setting up Fluent Bit, return to Kibana and select the appropriate index. Click on Discover and then create a new data view:
- Name the view "app-event".
- Select "Logstash" as the index pattern.
- Confirm that Kibana automatically highlights a timestamp field.
- Click on Save data view to complete the process.
Once the data view is saved, all logs generated by the Event Generator App are accessible through Kibana.
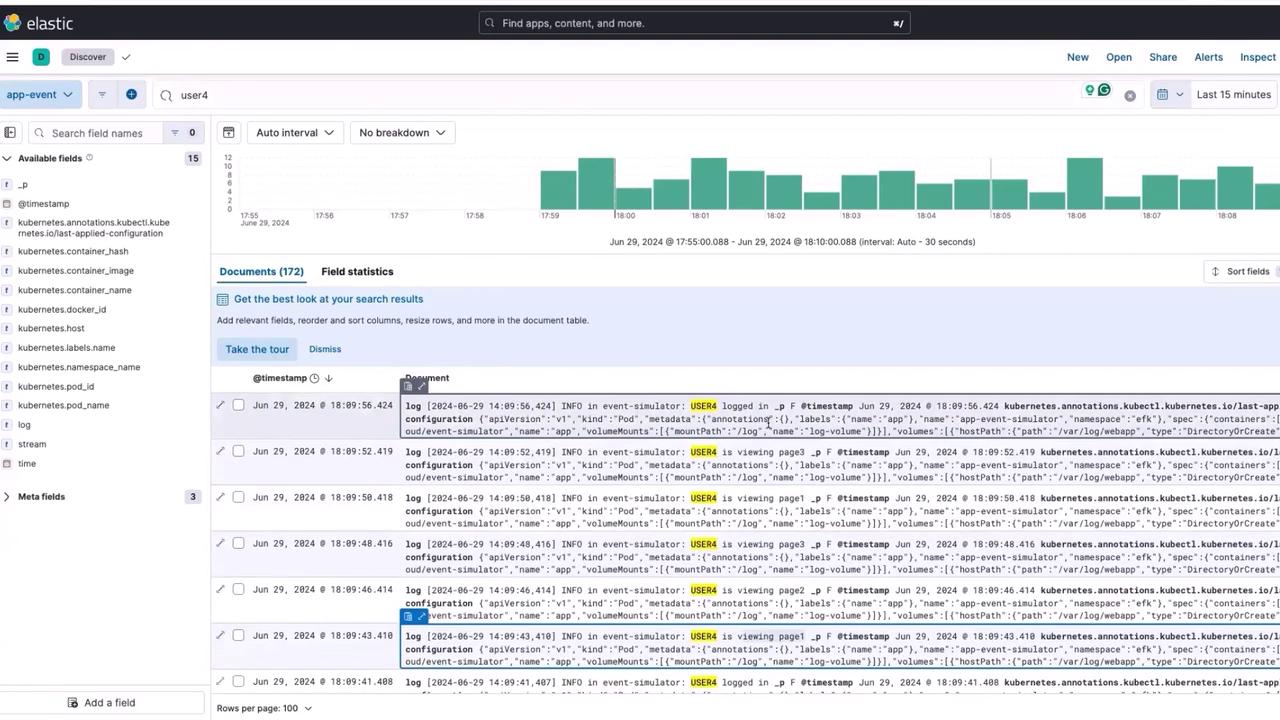
Querying and Visualizing User Behavior
With your logs now available in Kibana, you can analyze user behavior with ease. For example, search for events related to "user 4". When you press enter, you’ll see a chronological list of actions performed by user 4—including logins, logouts, and page views. This insight into user interactions can be crucial for troubleshooting and optimizing user experiences.
You can also build dashboards to visualize metrics such as the number of clicks on a page or overall user session data. For instance, visualizations can display event counts over specific time windows (e.g., every 5 or 10 minutes). This real-time monitoring capability is invaluable for software engineers, Site Reliability Engineers (SREs), and business analysts who rely on actionable user activity data to make informed decisions.
Stay tuned for the next lesson, where we will explore building interactive dashboards and dive further into Kibana's extensive capabilities.
Thank you for reading!
Watch Video
Watch video content