Step 1: Deleting the Existing Elasticsearch Index
First, delete the current Elasticsearch index to ensure a clean slate:- Open Elasticsearch and click on the three-line menu.
- Scroll down to “Stack Management.”
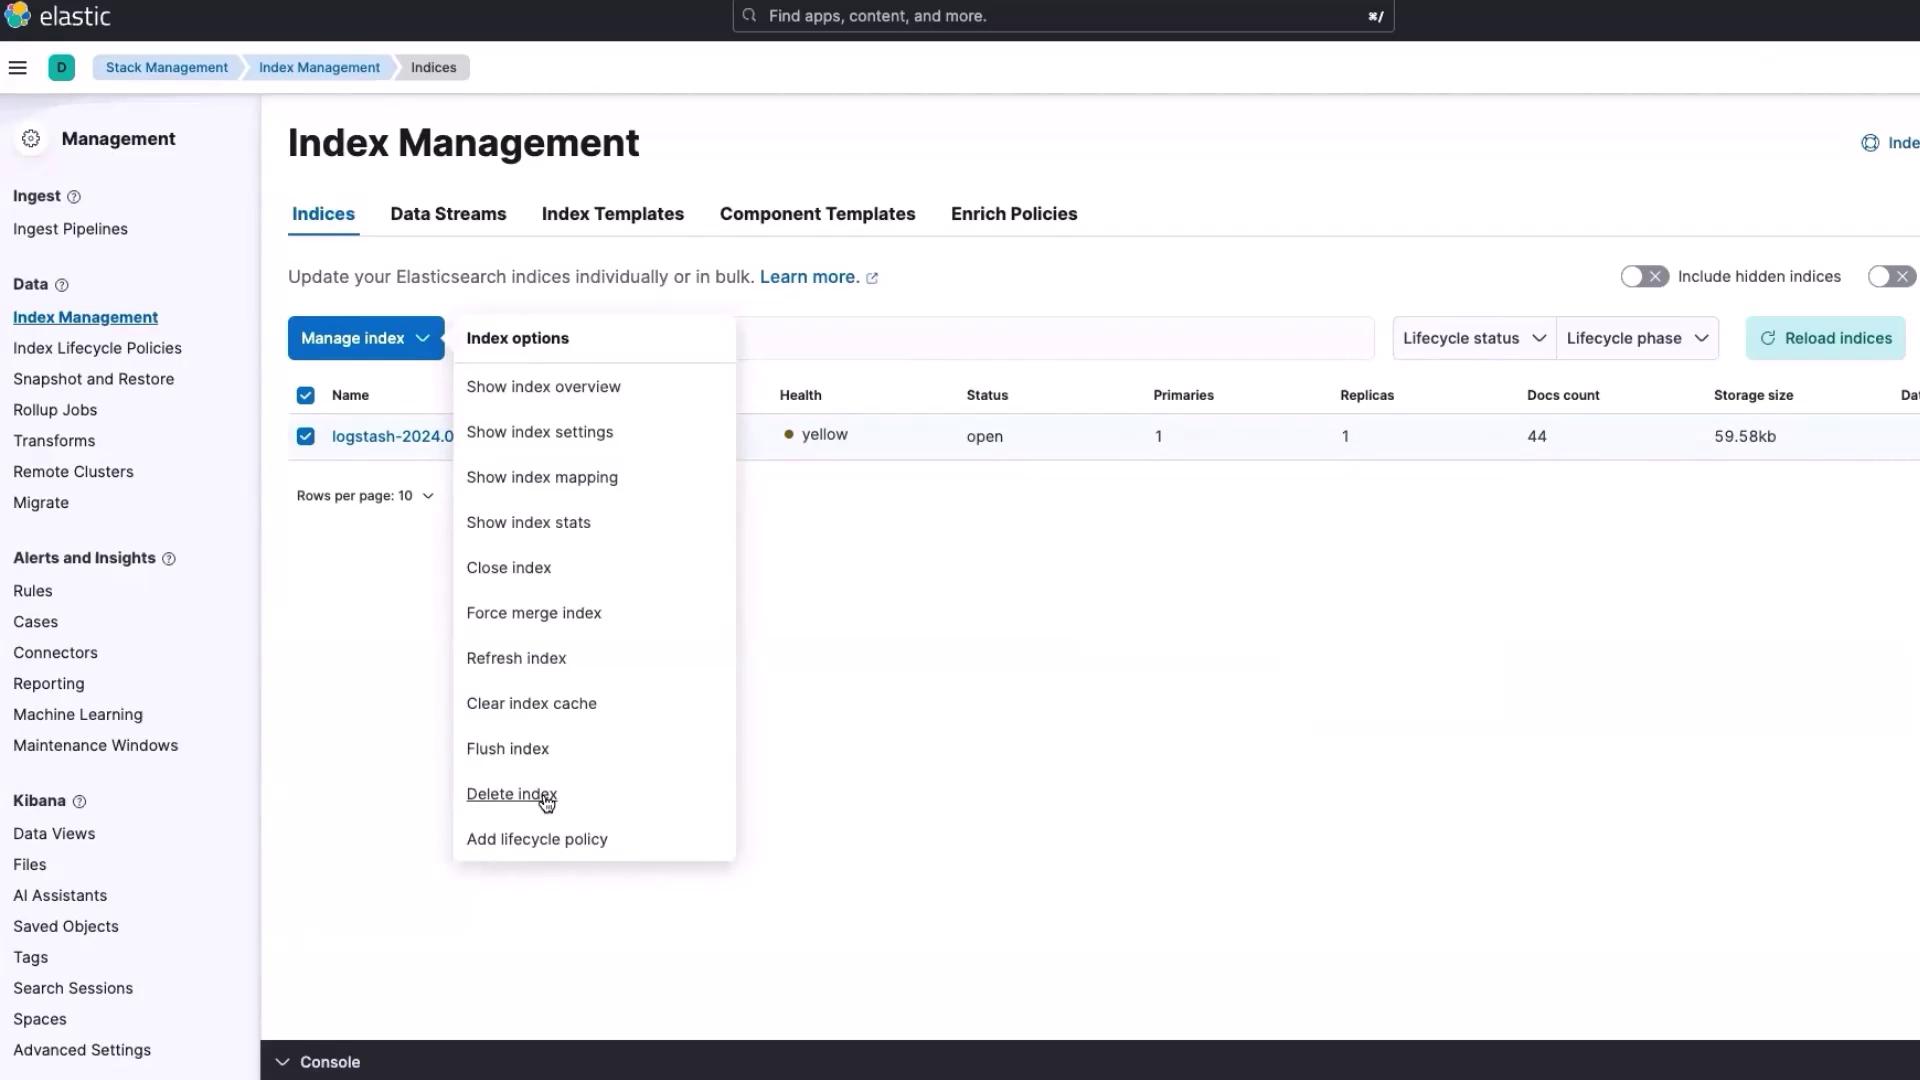
- Select “Index Management,” choose the relevant index, and click “Manage Index.”
- Click the “delete index” option to remove the entire index.
If you only desire to remove the records while preserving the index structure, use the “flush index” option instead.
Step 2: Updating and Redeploying the Python Application in Kubernetes
Switch over to your Kubernetes cluster and update the Python application deployment:-
Check Cluster Status:
Clear your screen and list the resources to verify the current state: -
Update Deployment File:
Open the YAML file for your Python application (e.g.,python-app-deployment.yaml). Update the version number from 3 to 4 and ensure that the Docker image for version 4 is ready. Use the snippet below as a guide: -
Apply the Updated Deployment:
Save your changes and apply the update:This action will initiate the termination of the old pod and spin up a new pod automatically. -
Restart Fluent Bit:
To ensure Fluent Bit picks up logs from the new deployment, delete the existing Fluent Bit pod:
Step 3: Verifying the Login Application
After updating the deployment, it’s time to verify if the login functionality is working correctly:-
Retrieve NodePort:
Obtain the NodePort by checking the services: -
Test the Application:
Open your browser and paste the NodePort URL:- Successful Login: Use the default credentials (Username: admin, Password: password) to log in.
- Failed Login: Attempt to log in with an incorrect password to confirm that the application rejects invalid credentials.
Step 4: Examining Structured Logs in Elasticsearch
After verifying the login functionality, a new index is automatically created in Elasticsearch. Follow these steps to examine the structured logs:-
Access the New Index:
Click on the new index and then select “Discover Index.” -
Handle Temporary Errors:
If you see an error message like the one below, simply navigate to “Analytics” and click “Discover” again:
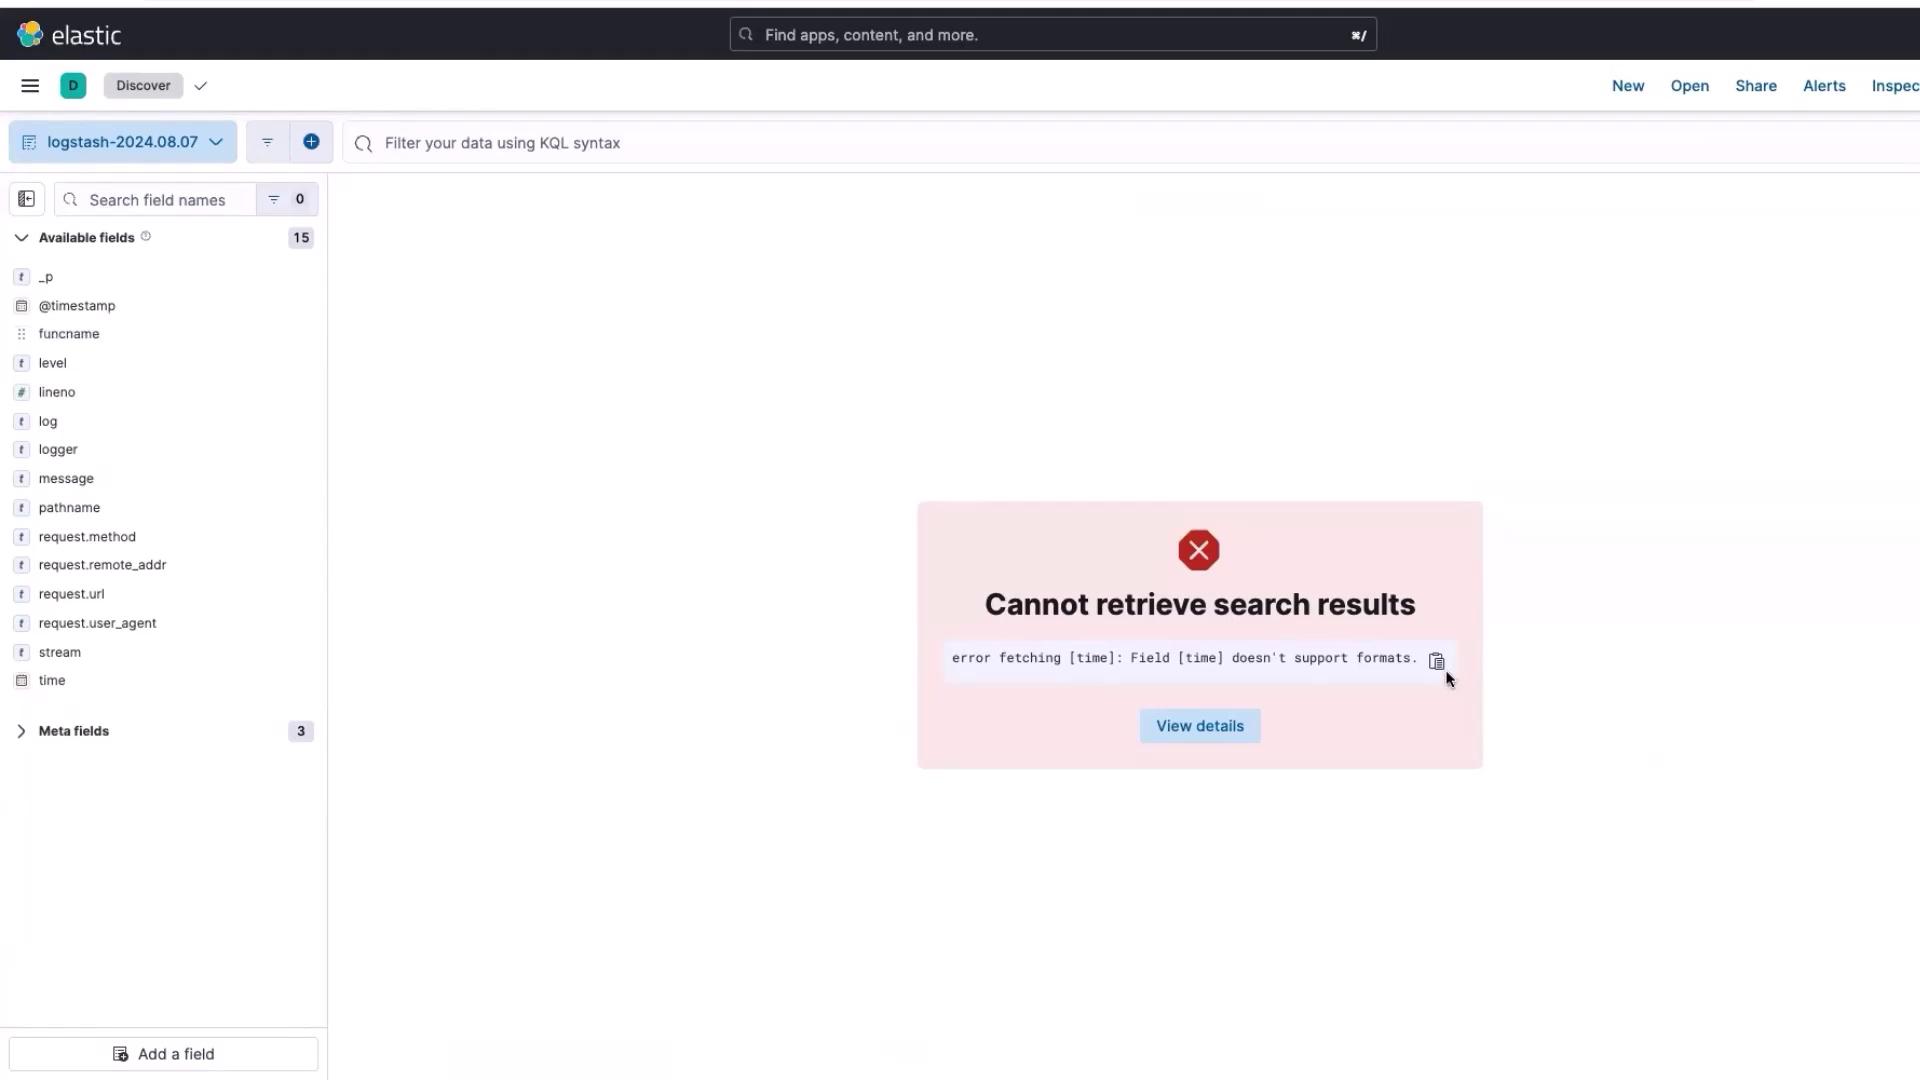
This error occurs when Elasticsearch is slow to interpret the time field in the log file. Revisiting “Discover” should resolve the issue.
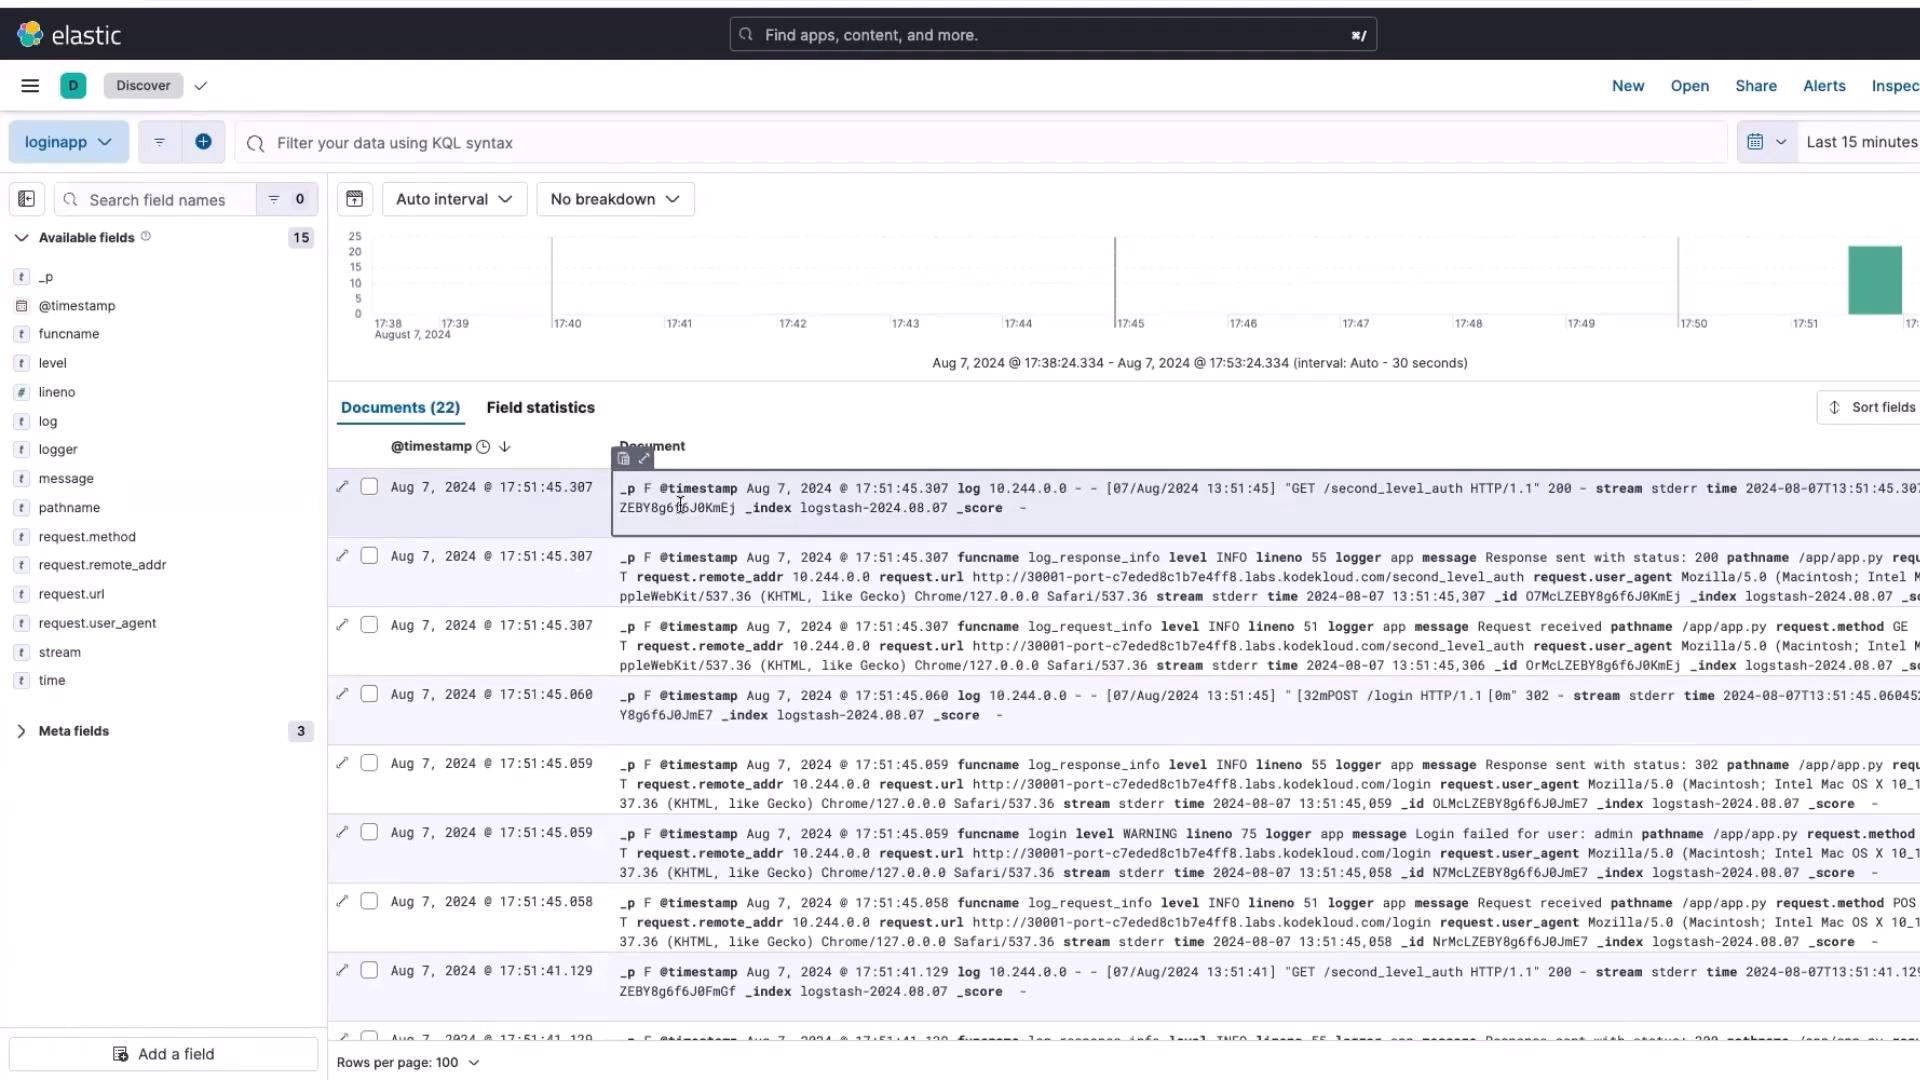
- Review Enhanced Logs:
Notice that the logs are no longer lumped into a single “log” field. They are now distributed among 15 structured fields (including request method, remote address, time, logger, message, path name, etc.). This structure simplifies the exploration and analysis of log data in Kibana. It also paves the way to create interactive dashboards using Lens.