This hands-on tutorial explores WebAssembly debugging workflows using Emscripten and Chrome DevTools for C/C++ projects.
In this hands-on tutorial, we’ll explore WebAssembly (WASM) debugging workflows using Emscripten and Chrome DevTools. You’ll learn how to compile a simple C function to WASM, step through raw instructions in the browser, and then enable source-level debugging with DWARF symbols for C/C++ projects.
We start with a minimal C library that calculates the factorial of a non-negative integer:
Copy
#include <emscripten.h>EMSCRIPTEN_KEEPALIVEint factorial(int n) { if (n < 0) return -1; // Undefined for negatives if (n <= 1) return 1; // 0! and 1! are 1 int result = 1; for (int i = 2; i <= n; ++i) { result *= i; } return result;}
Add an HTML page with JS glue to invoke the WASM module:
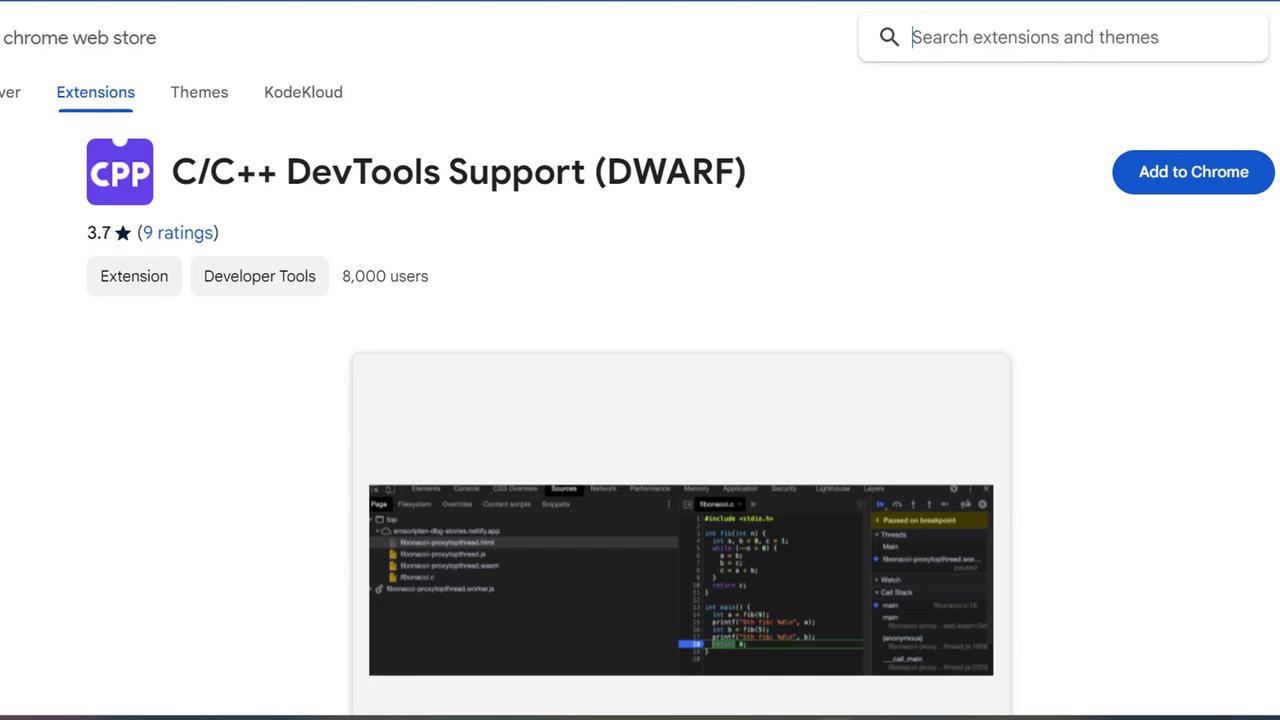
You can set breakpoints in JS, step into the WASM module, and inspect raw locals like var0. However, mapping these low-level variables back to your C source can be tedious.
Low-level WASM debugging displays raw opcodes (local.get, i32.mul, etc.) and generic local names. To see your original C/C++ code directly, you need DWARF debug symbols.
For larger C++ projects—such as rendering a Julia set fractal with SDL2—inspecting raw assembly is cumbersome. A Julia set is generated by iterating a simple complex-numbers formula for each pixel. Here’s a concise renderer:
Copy
#include <SDL2/SDL.h>#include <complex>#include <cstdlib>#include <ctime>int main() { const int width = 600, height = 600; SDL_Init(SDL_INIT_VIDEO); SDL_Window* window; SDL_Renderer* renderer; SDL_CreateWindowAndRenderer(width, height, SDL_WINDOW_OPENGL, &window, &renderer); const int MAX_ITER = 256; SDL_Color palette[MAX_ITER]; std::srand(static_cast<unsigned>(std::time(nullptr))); for (int i = 0; i < MAX_ITER; ++i) { palette[i] = { static_cast<uint8_t>(std::rand()), static_cast<uint8_t>(std::rand()), static_cast<uint8_t>(std::rand()), 255 }; } std::complex<double> c(-0.7, 0.27015); double zoom = 1.0; for (int y = 0; y < height; ++y) { for (int x = 0; x < width; ++x) { double zx = 1.5 * (x - width / 2.0) / (0.5 * zoom * width); double zy = (y - height / 2.0) / (0.5 * zoom * height); std::complex<double> z(zx, zy); int iter = MAX_ITER; while (std::abs(z) < 2.0 && iter > 0) { z = z * z + c; --iter; } SDL_Color color = palette[iter]; SDL_SetRenderDrawColor(renderer, color.r, color.g, color.b, color.a); SDL_RenderDrawPoint(renderer, x, y); } } SDL_RenderPresent(renderer); SDL_Quit(); return 0;}