GCP DevOps Project

Sprint 02

Connecting to GKE cluster using Cloud shell

Welcome to this step-by-step guide on establishing a secure connection to your Google Kubernetes Engine (GKE) cluster via Google Cloud Shell. You’ll learn how to authenticate your session, verify connectivity with kubectl, and explore workloads directly in the Google Cloud Console.

1. Retrieve Cluster Credentials

  1. Open the GKE Clusters page in the Google Cloud Console.
  2. Click your cluster name.
  3. Select Connect, then choose Run in Cloud Shell.

Cloud Shell will launch at the bottom of your browser with the following command pre-filled:

gcloud container clusters get-credentials gcp-devops-project \
  --region us-central1 \
  --project flowing-castle-374710

Press Enter, then Authorize when prompted. This updates your local kubeconfig so that kubectl can interact with your GKE cluster.

Note

You need to run this gcloud container clusters get-credentials command each time you start a new Cloud Shell session, as kubeconfig configurations aren’t persisted across sessions.

2. Verify Connection with kubectl

After retrieving credentials, confirm your connection and inspect system components:

kubectl CommandDescription
kubectl get namespacesList all namespaces in the cluster
kubectl get pods -n kube-systemList all pods in the kube-system namespace

Run:

# List namespaces
kubectl get namespaces

# List pods in kube-system
kubectl get pods -n kube-system

Example output:

$ kubectl get pods -n kube-system
NAME                              READY   STATUS    RESTARTS   AGE
filestore-node-7havk              3/3     Running   0          9m56s
filestore-node-hzc64              0/0     ----      0          9m56s
fluentbit-gce-small-4n47s         0/0     ----      0          9m56s
kube-api-access-tnhmb             0/0     ----      0          9m56s
gke-metadata-server-6srb6         1/1     Running   0          9m56s
gke-metrics-agent-tmb8p           1/1     Running   0          9m56s
ip-attach-agent-4kjdz             0/0     ----      0          9m56s
konnectivity-agent-8t894          1/1     Running   0          9m56s
kube-dns-648f67d9c4-kz6h6         1/1     Running   0          10m
kube-dns-648f67d9c4-6rxnl         1/1     Running   0          10m
metrics-server-6d49bb6c5-7xjg     1/1     Running   0          10m
metadefender                      0/0     ----      0          9m56s
metra-8cfb5dff73-9c8g             1/1     Running   0          9m55s
node-local-dns-9v4vd              2/2     Running   0          9m56s

3. View Workloads in Google Cloud Console

Inspect workloads and system metrics without leaving the Console:

  1. Close the Cloud Shell terminal window.
  2. In the left-hand navigation, click Workloads.
  3. Toggle Show system workloads.
  4. Filter by kube-system to view system pods.

The image shows a Google Cloud Kubernetes Engine dashboard displaying a list of workloads with their status, type, pods, namespace, and cluster information.

To see per-pod resource metrics:

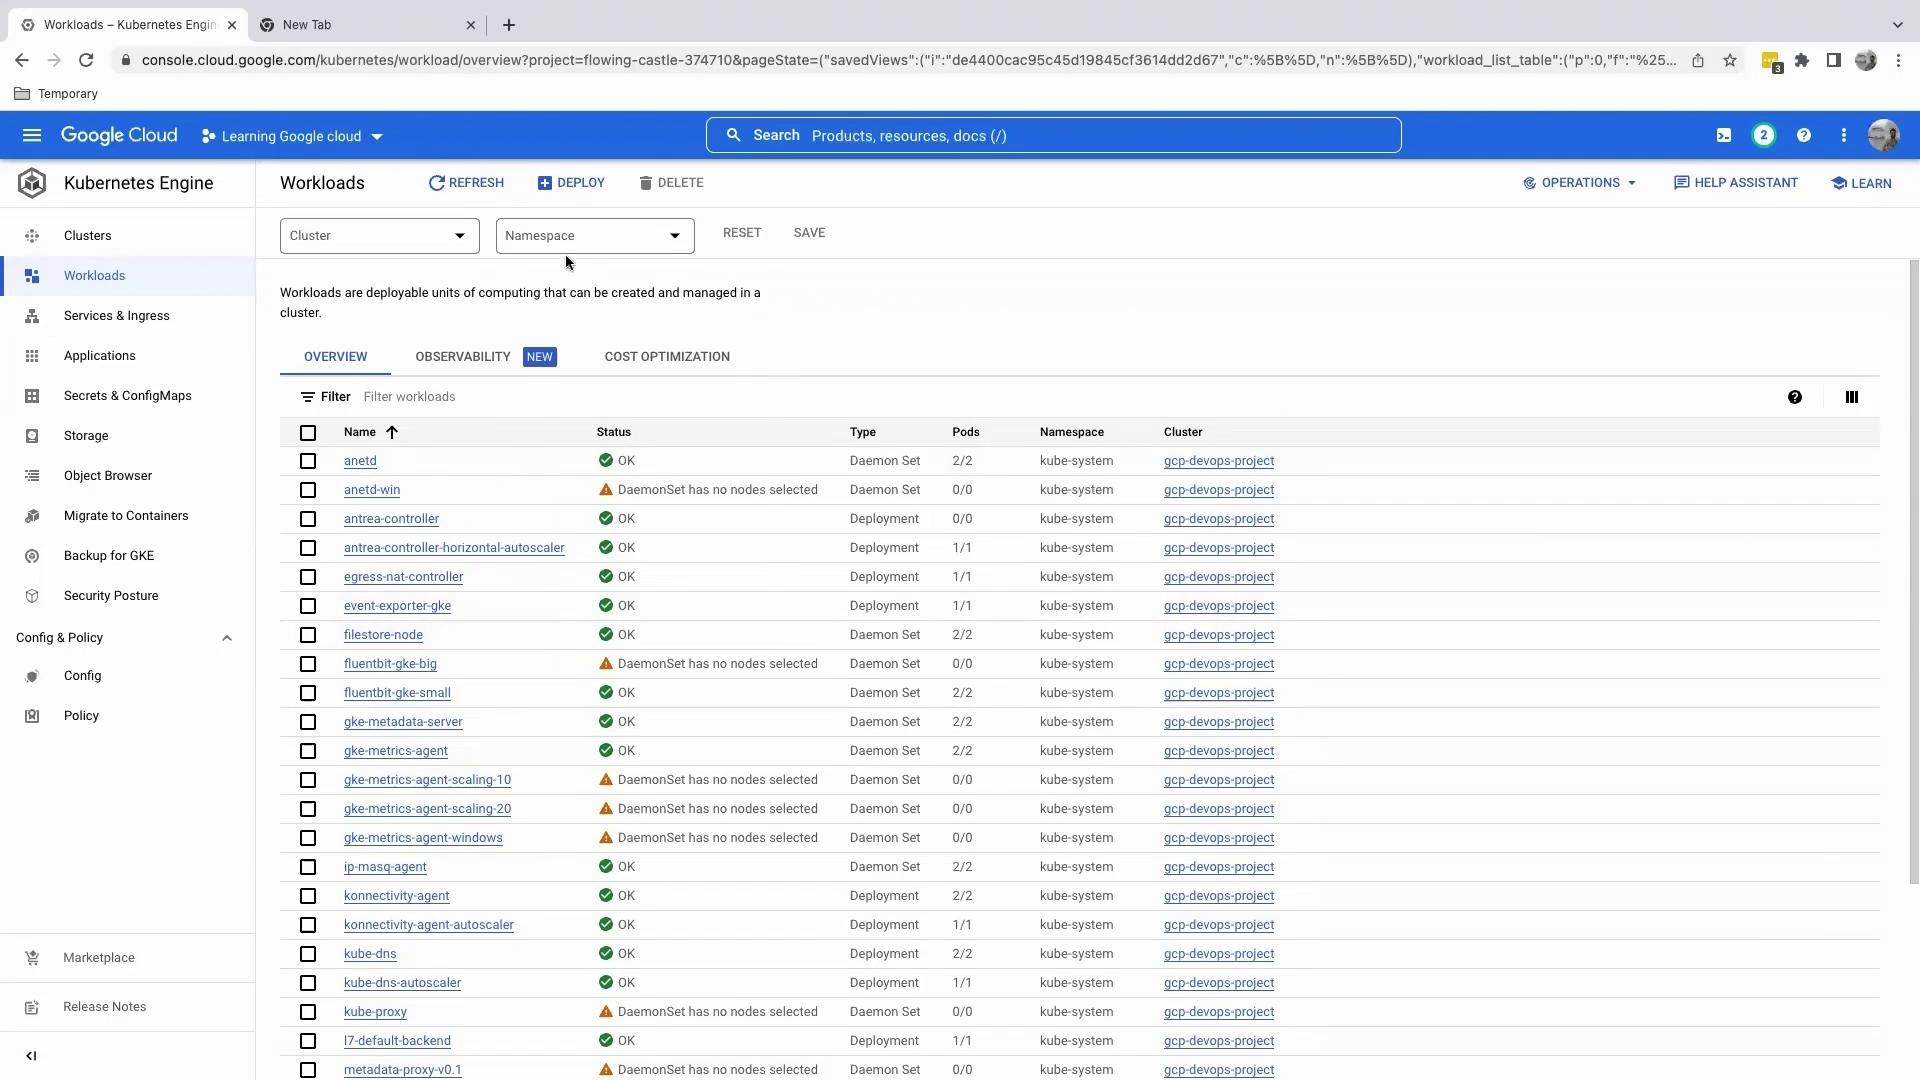
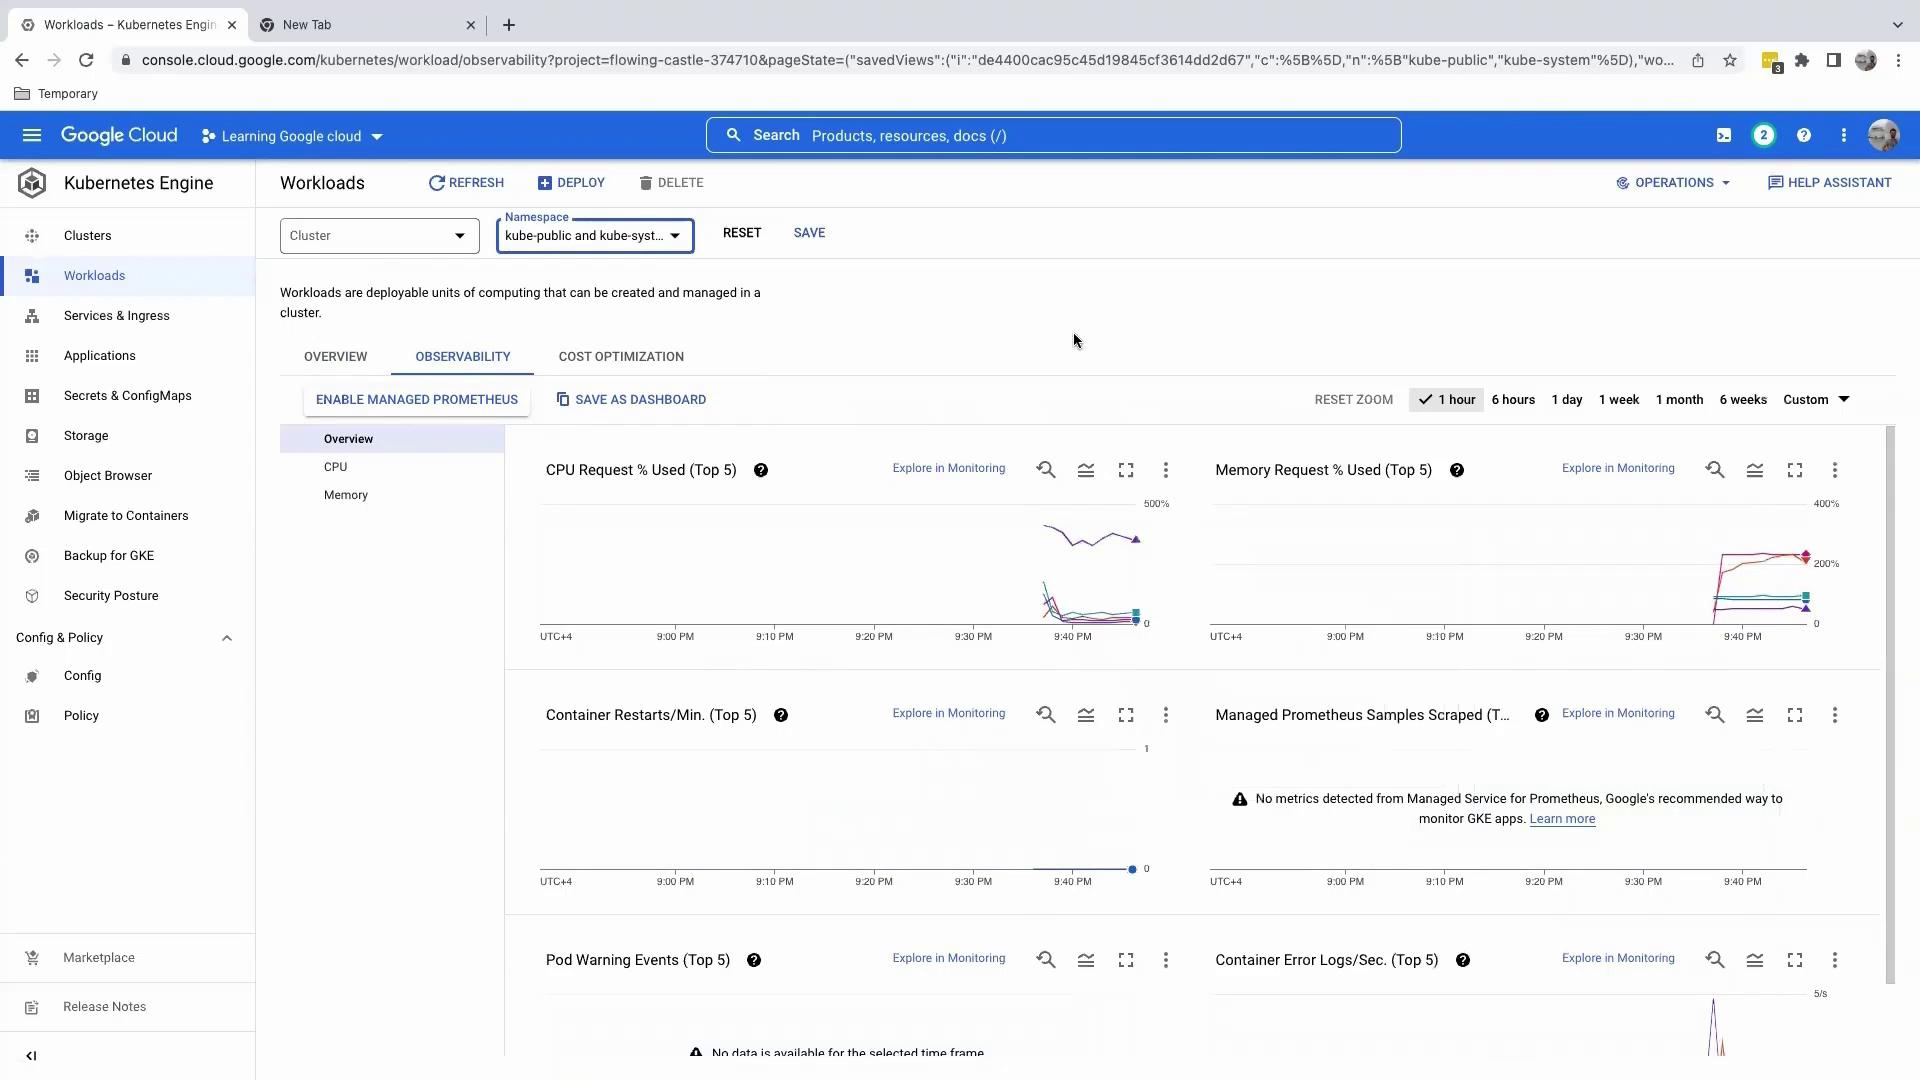
  • Use the namespace filter to select one or more namespaces.
  • Examine CPU and memory usage, restarts, and error logs in the metrics panel.

The image shows a Google Cloud Kubernetes Engine dashboard displaying metrics for workloads, including CPU and memory usage, container restarts, and error logs.


You’ve successfully connected to your GKE cluster via Cloud Shell, executed essential kubectl commands, and explored workloads in the GCP Console. Next, we’ll guide you through deploying applications to your cluster.

References

Watch Video

Watch video content

Previous
Creating GKE cluster