kubectl command-line interface.
1. Verifying via the GCP Console
- Navigate to Kubernetes Engine > Clusters in the Google Cloud Console.
- Select your cluster (for example, gcp-devops-project).
- In the cluster overview, click Workloads in the left menu to see all Deployments.
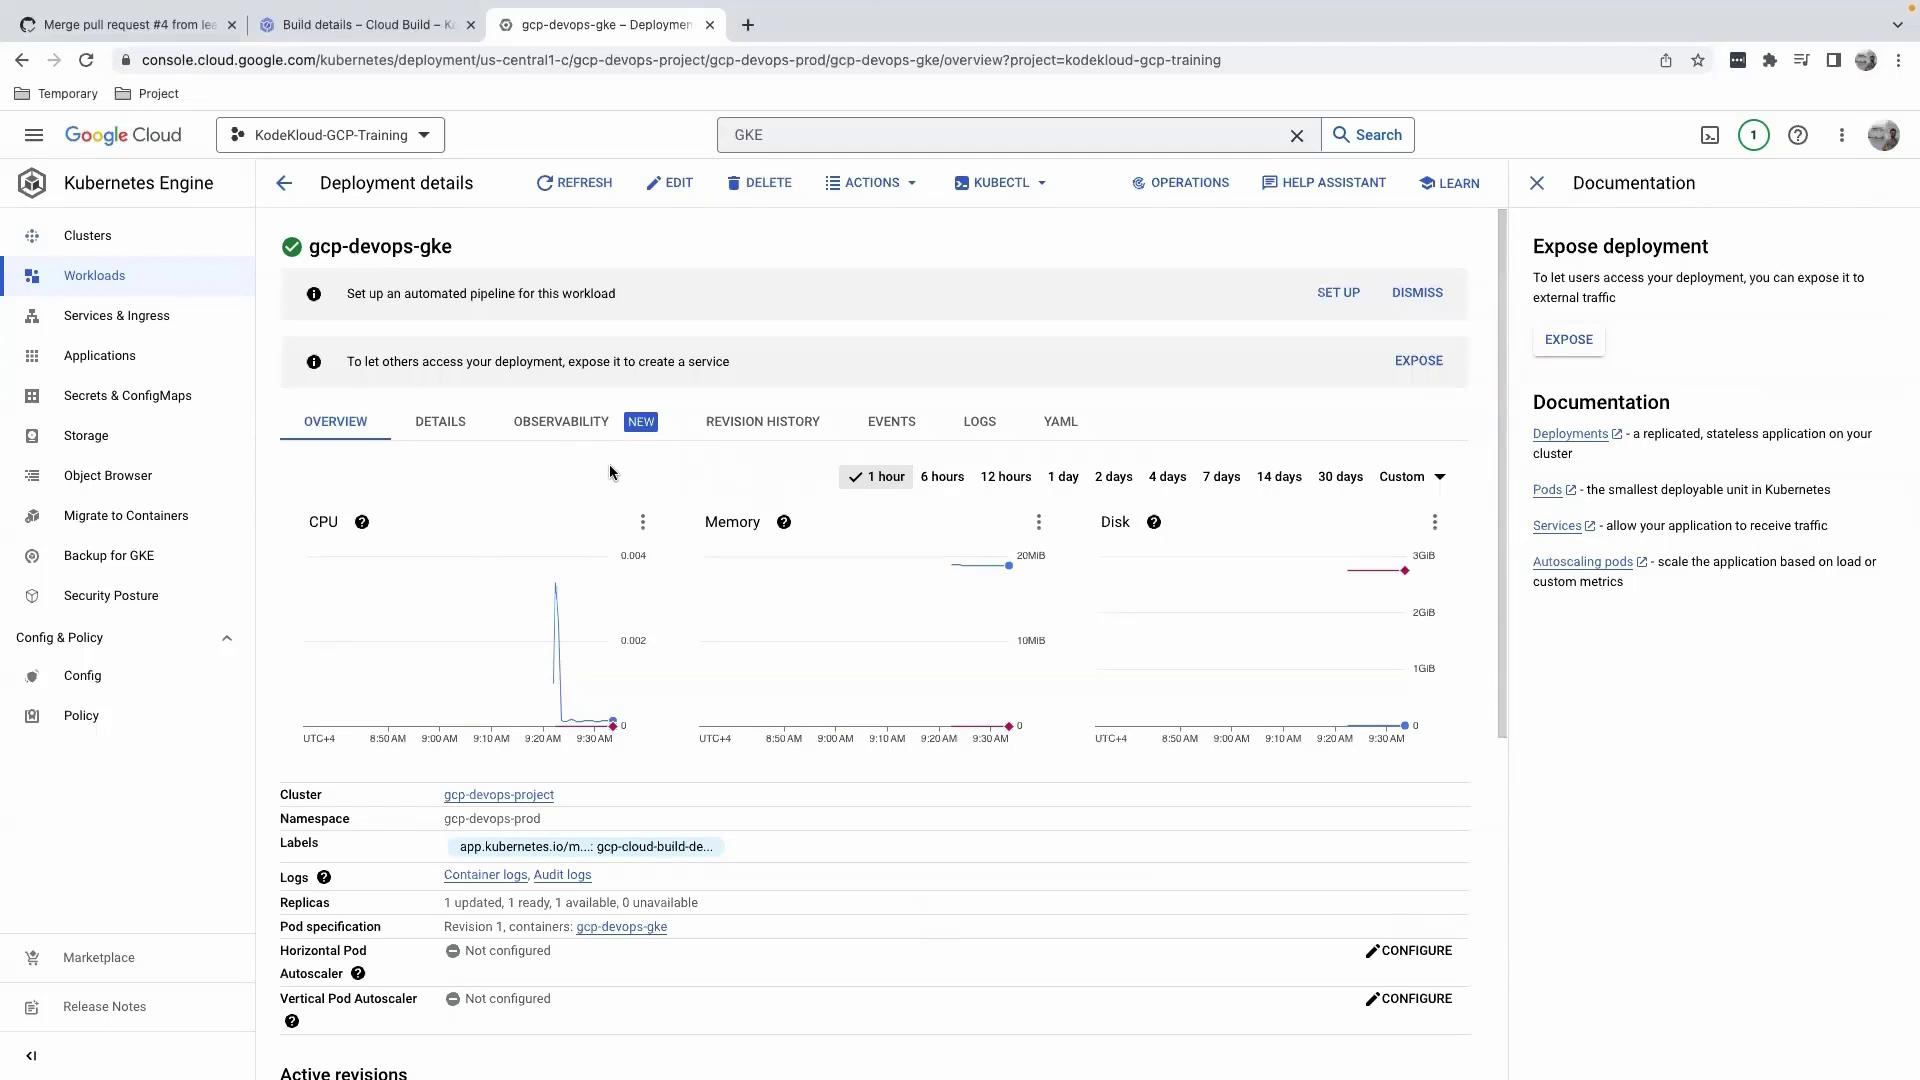
- Choose the correct namespace (e.g.,
gcp-devops-prod). You’ll see your Deployment, the number of ready pods, and its status. - Click the Deployment name for detailed metrics on CPU, memory, and more.
Avoid editing your Deployment manifest directly in the Console. Since changes aren’t tracked in your GitHub-backed CI/CD pipeline, this can lead to configuration drift.
Editing via the Console
When you click Edit, you’ll see a client-side apply patch like this: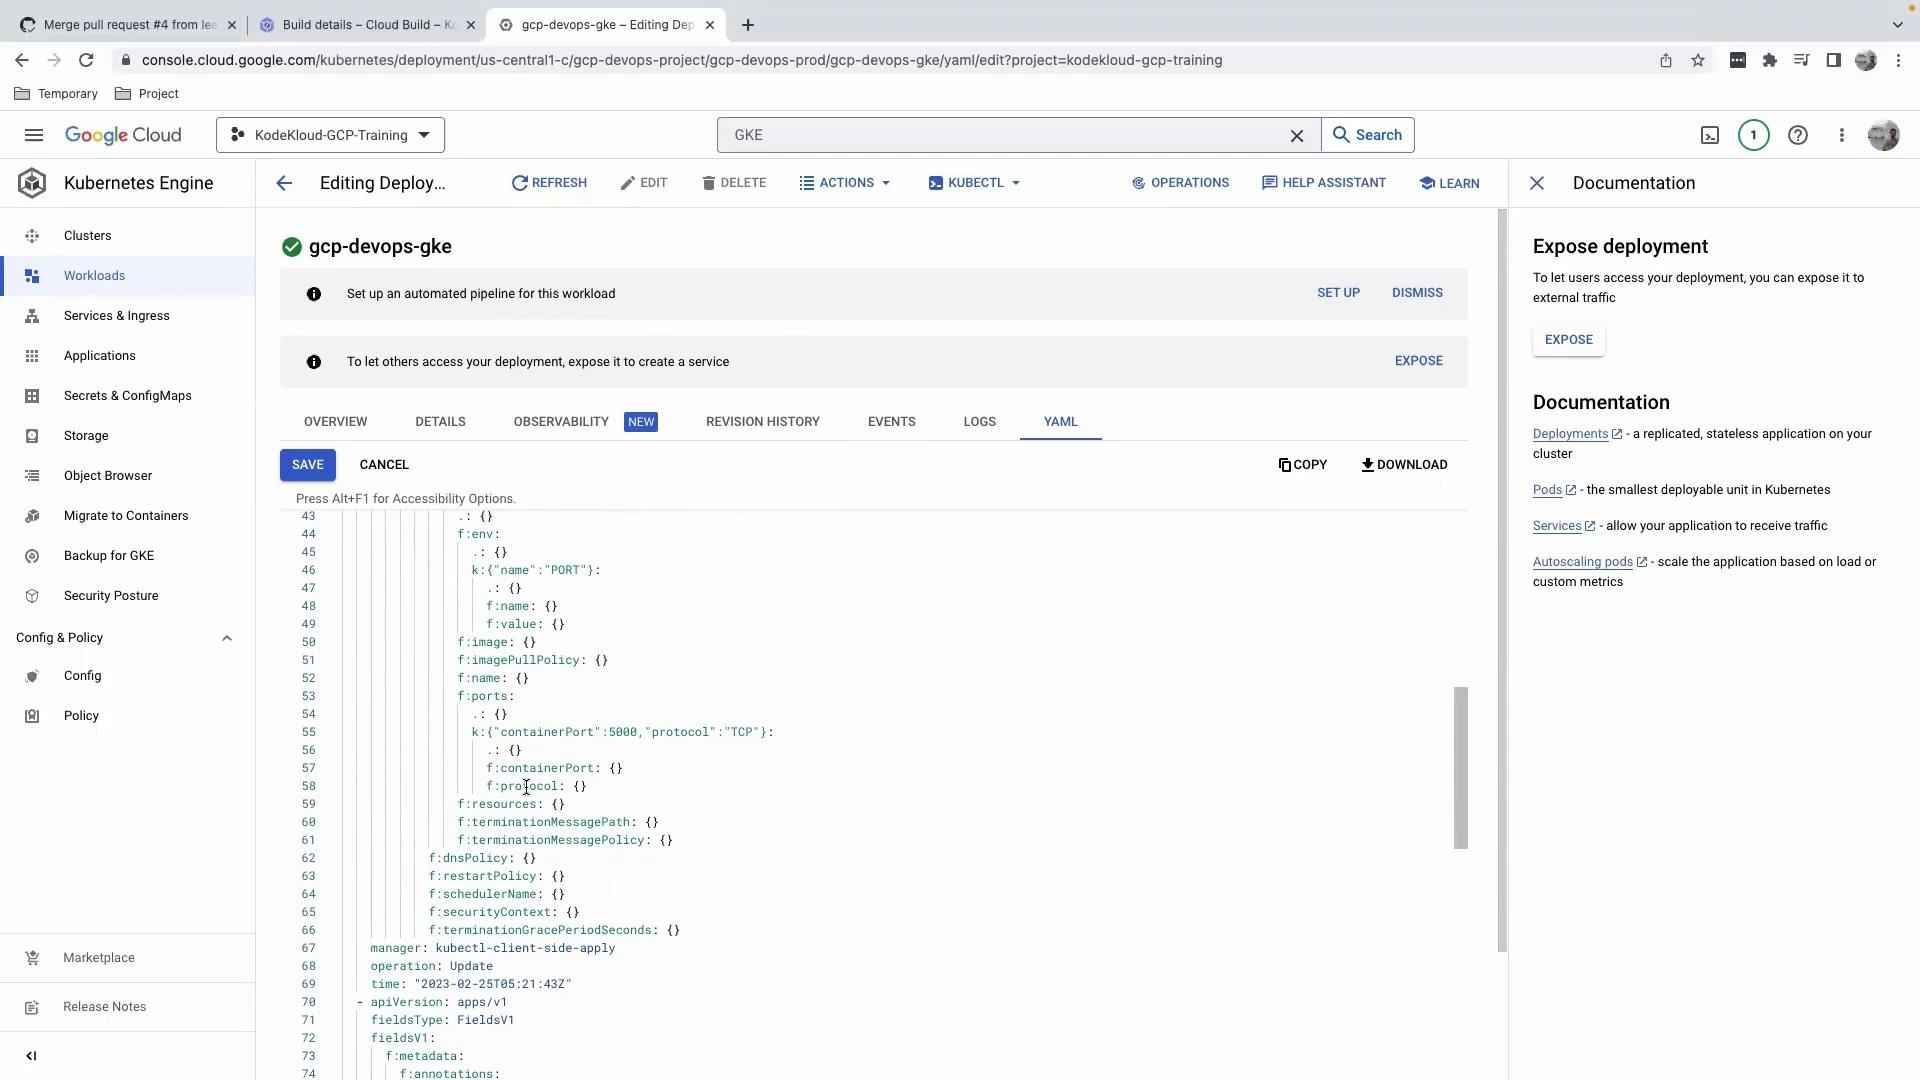
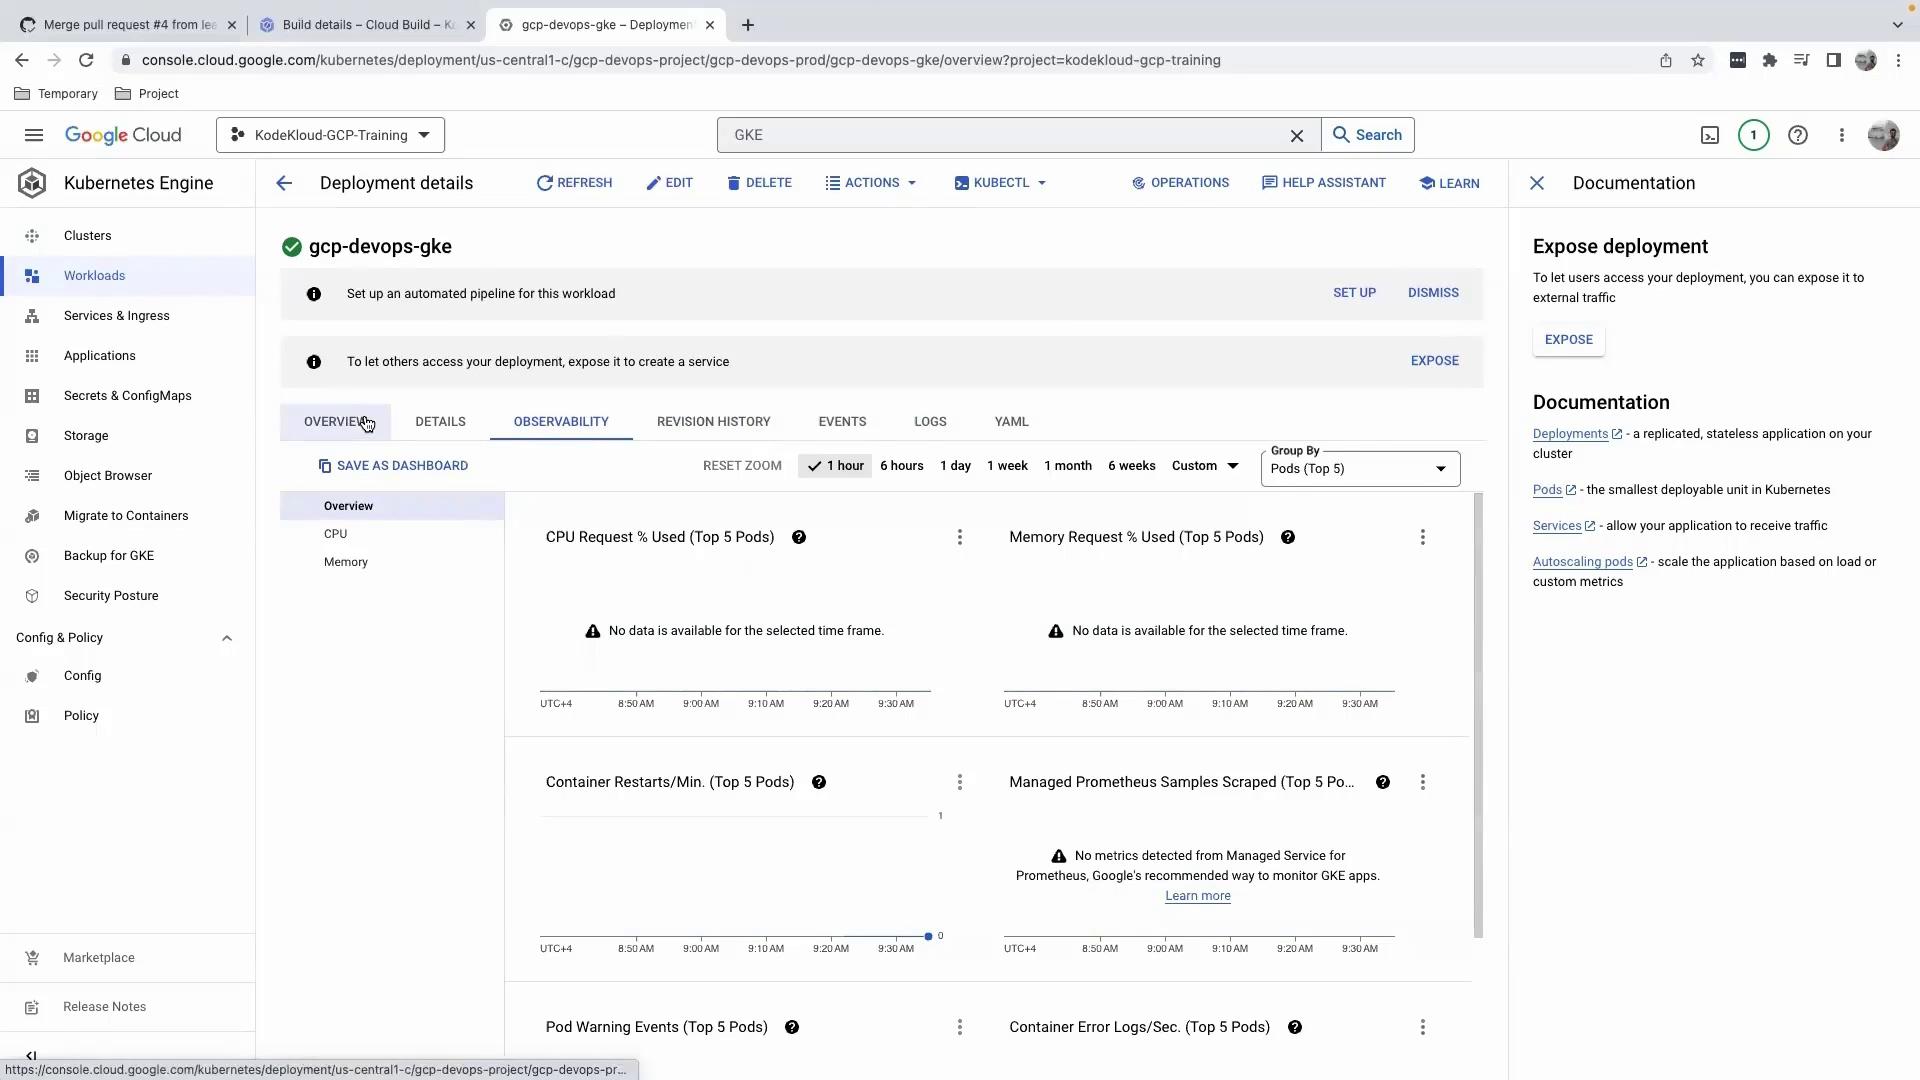
Viewing Logs, Revisions, and Observability
- Logs: Monitor container output filtered by severity or time.
- Revision History: Track Deployment rollouts and rollbacks.
- Observability: Access extended metrics, charts, and health checks.
Exposure & Actions
| Action | Description |
|---|---|
| Scale Replicas | Increase or decrease the number of pod replicas. |
| Expose via LoadBalancer | Create a Service of type LoadBalancer for external access. |
| Configure Ingress | Set up Ingress rules for host/path-based routing. |
| Edit Configuration | Modify your Deployment manifest via CI/CD to avoid drift. |
Because no Service resource exists yet, the Exposure section will be empty.
We recommend using your CI/CD pipeline for all changes to ensure auditability.
We recommend using your CI/CD pipeline for all changes to ensure auditability.
2. Verifying via the Command Line
a. Configure kubectl Credentials
Open Cloud Shell (or your local terminal) and run:
kubectl to use your GKE context.
b. Check Pods in the Default Namespace
By default,kubectl queries the default namespace:
Most GKE applications run in a custom namespace, so the default namespace is often empty.
c. Check Pods in Your Namespace
List all pods ingcp-devops-prod:
Next Steps
Once your Deployment is validated:- Create a Service to expose your application externally.
- Configure Ingress rules for HTTP routing and TLS termination.
- Integrate monitoring and alerts with Cloud Monitoring and Cloud Logging.