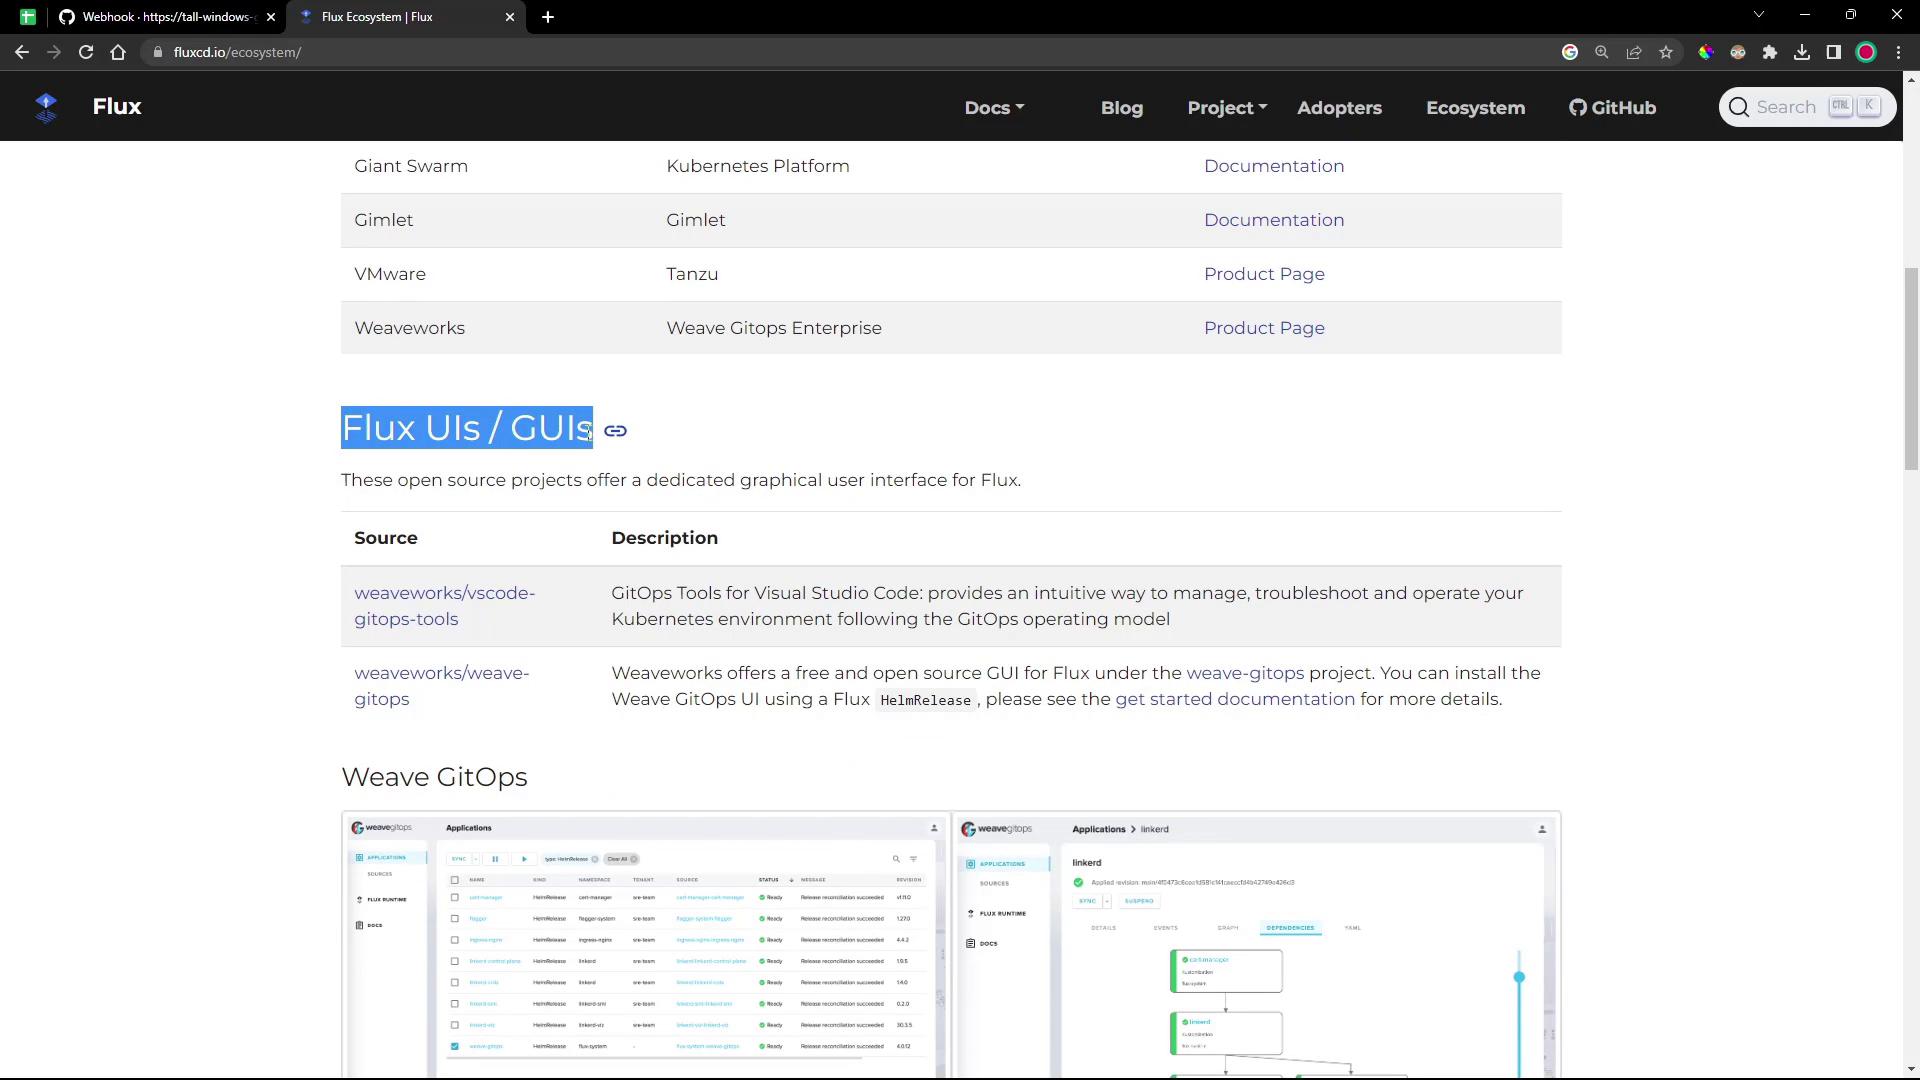
- VS Code GitOps Tools for Flux – a lightweight VS Code extension
- Weaveworks GitOps UI – a full-featured web dashboard
kubectl commands or hand-editing YAML.
Comparison at a Glance
| Tool | Interface Type | Key Features |
|---|---|---|
| VS Code GitOps Tools for Flux | VS Code Extension | Clusters, Sources, Workloads, Docs links |
| Weaveworks GitOps UI | Web Dashboard | Sources, Applications, Runtimes, Automation |
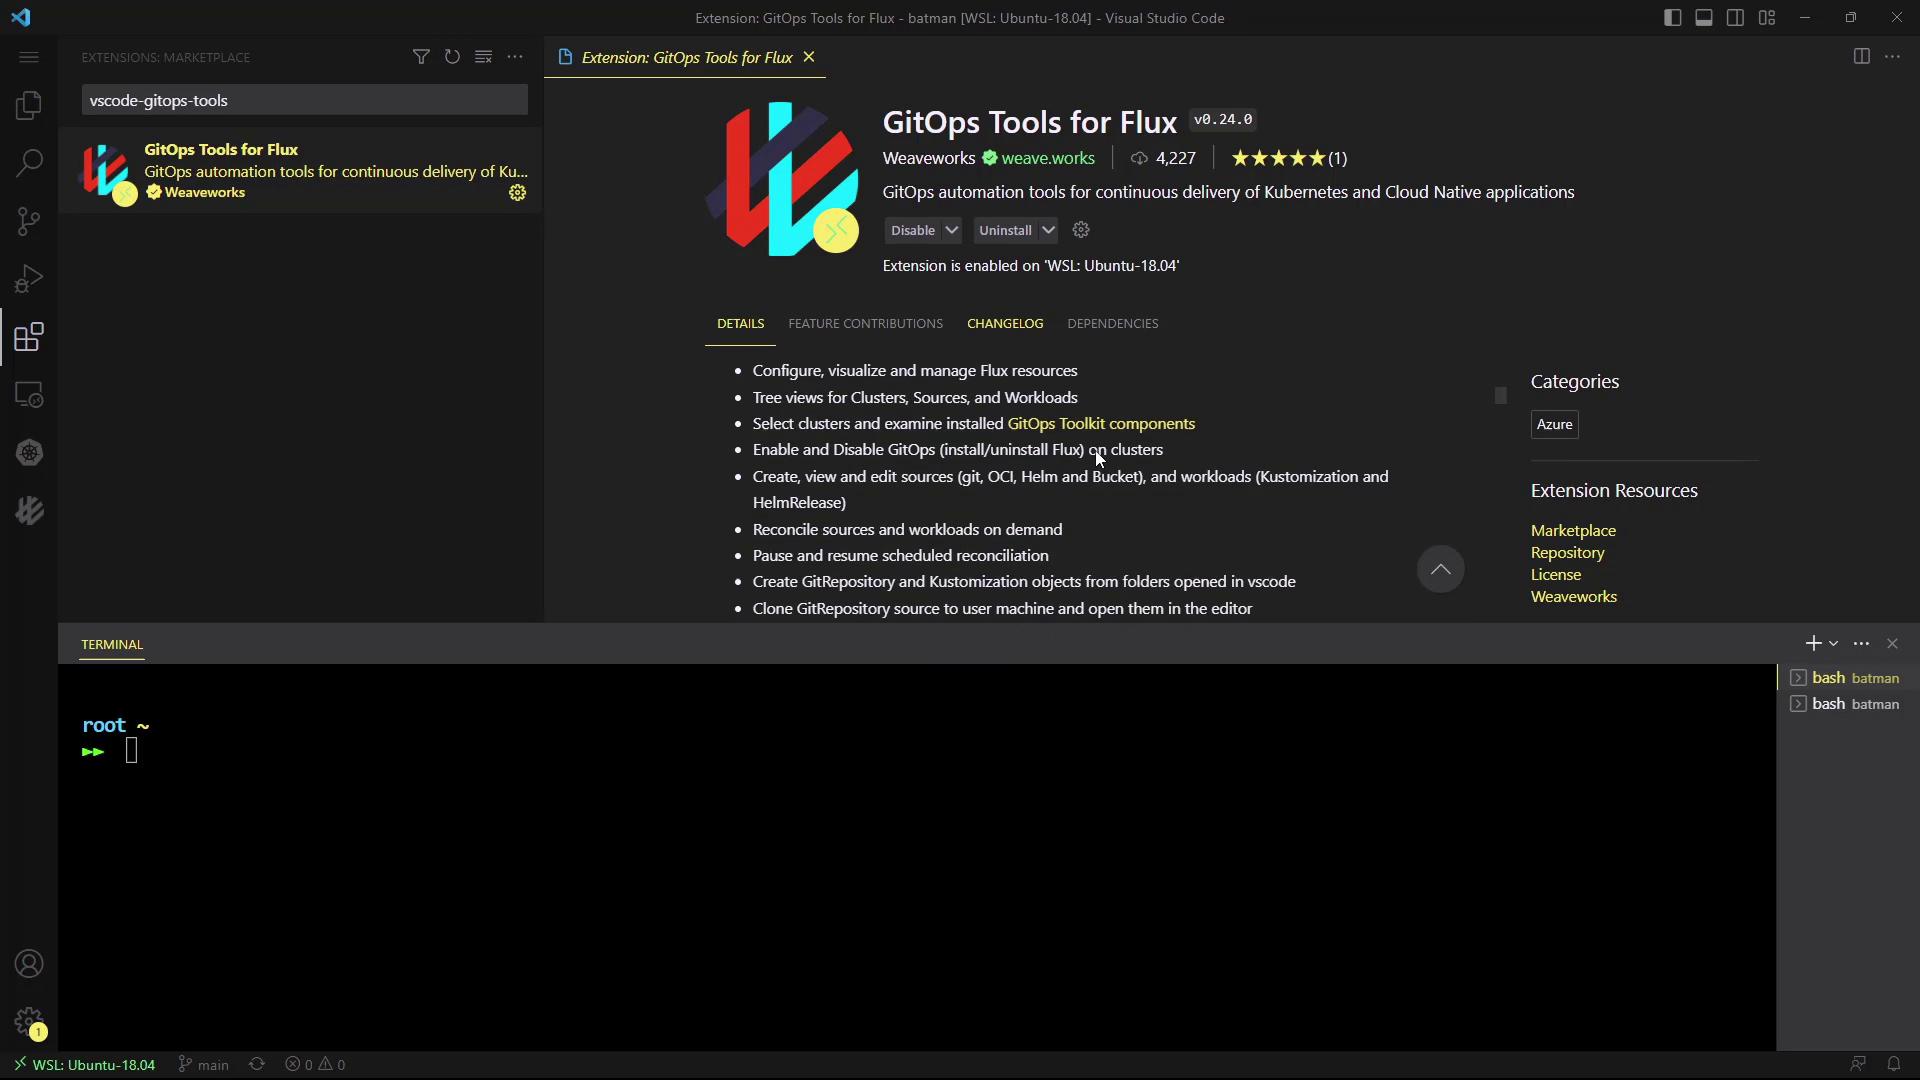
1. VS Code GitOps Extension for Flux
The GitOps Tools for Flux extension brings Flux CD insights directly into Visual Studio Code.Install the Extension
- Open Extensions (⇧⌘X or Ctrl+Shift+X).
- Search for GitOps Tools for Flux.
- Click Install.
Navigating the GitOps Pane
Click the GitOps icon to reveal four sections:- Clusters – view all Flux controllers
- Sources – inspect GitRepositories, HelmRepositories, Buckets, OCIRepositories
- Workloads – check Kustomizations & HelmReleases
- Documentation – quick links to Flux docs
Clusters
Select your Kubernetes context (e.g., Docker Desktop) to see live YAML for each controller: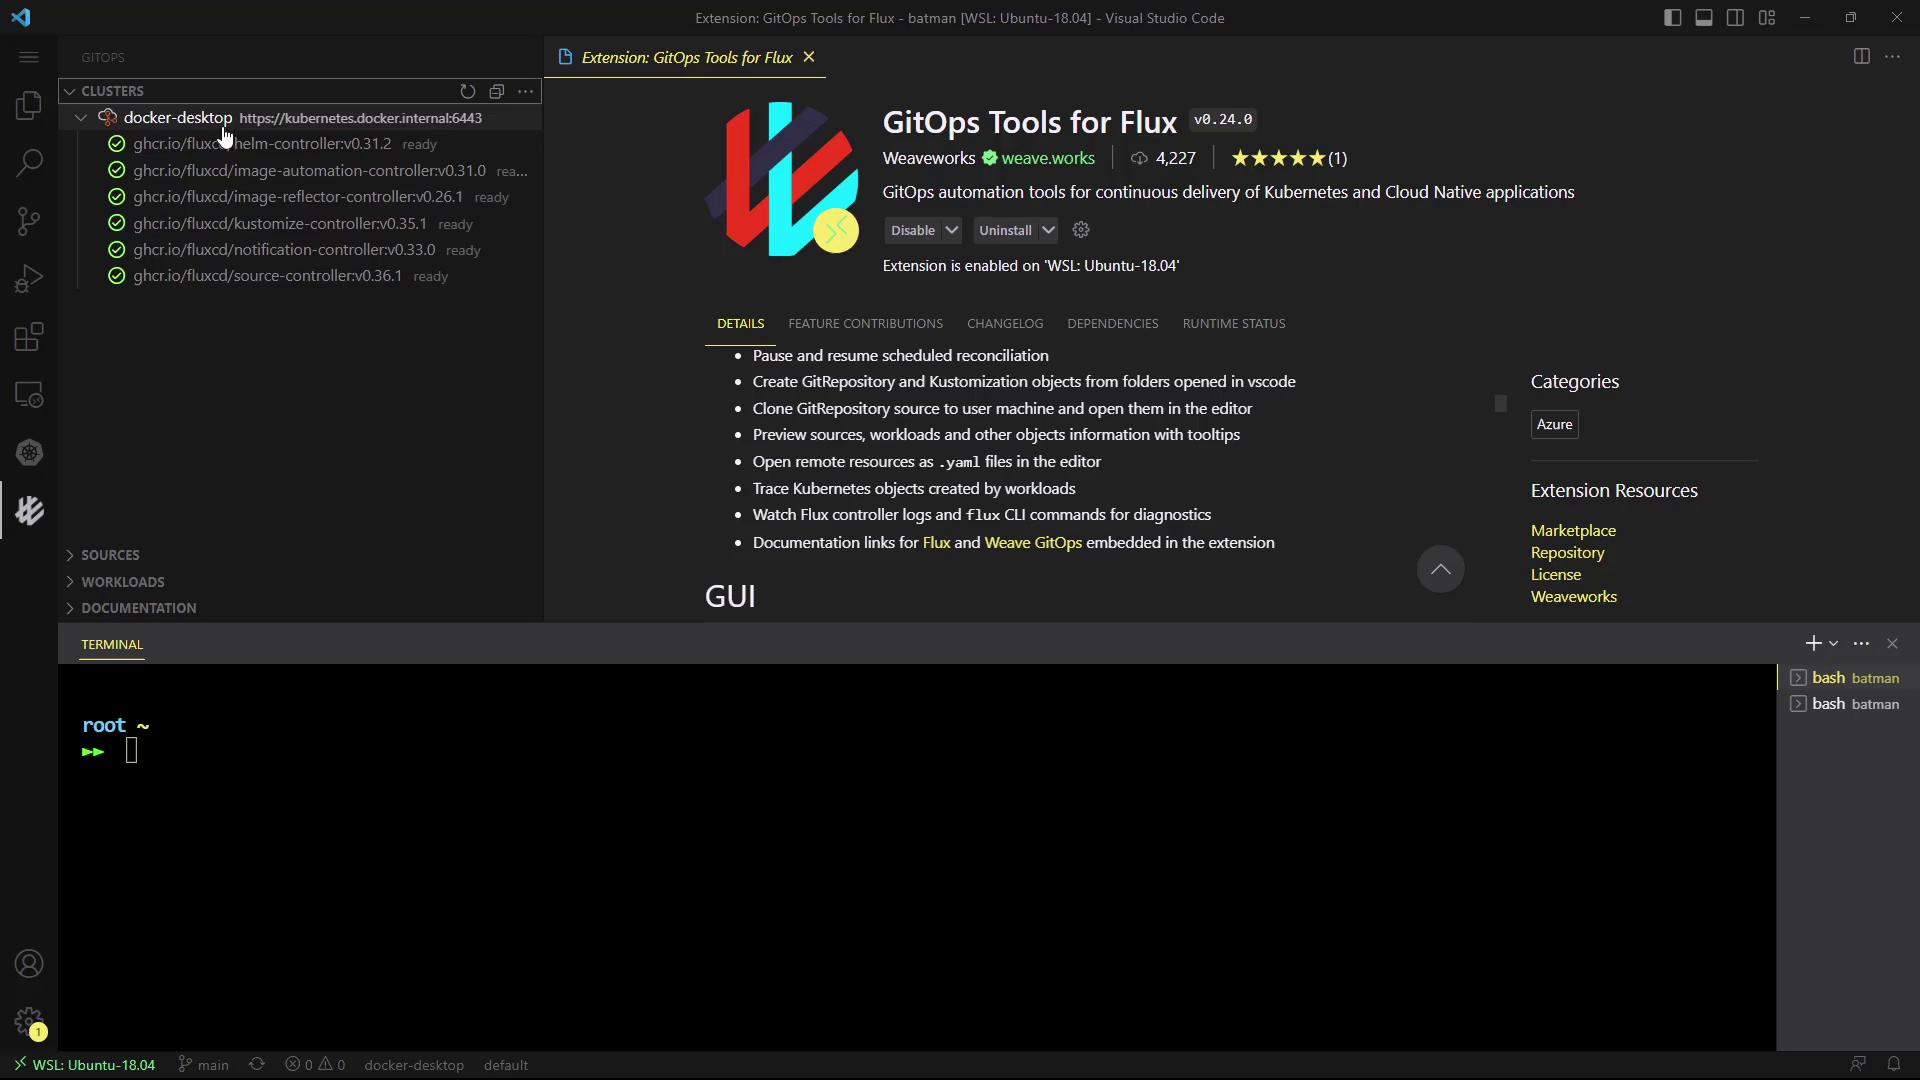
Sources
Browse all configured Sources in theflux-system namespace:
- GitRepository
- HelmRepository
- Bucket
- OCIRepository
Workloads
Inspect Kustomizations and HelmReleases in one place. For example, clicking a HelmRelease reveals its specification: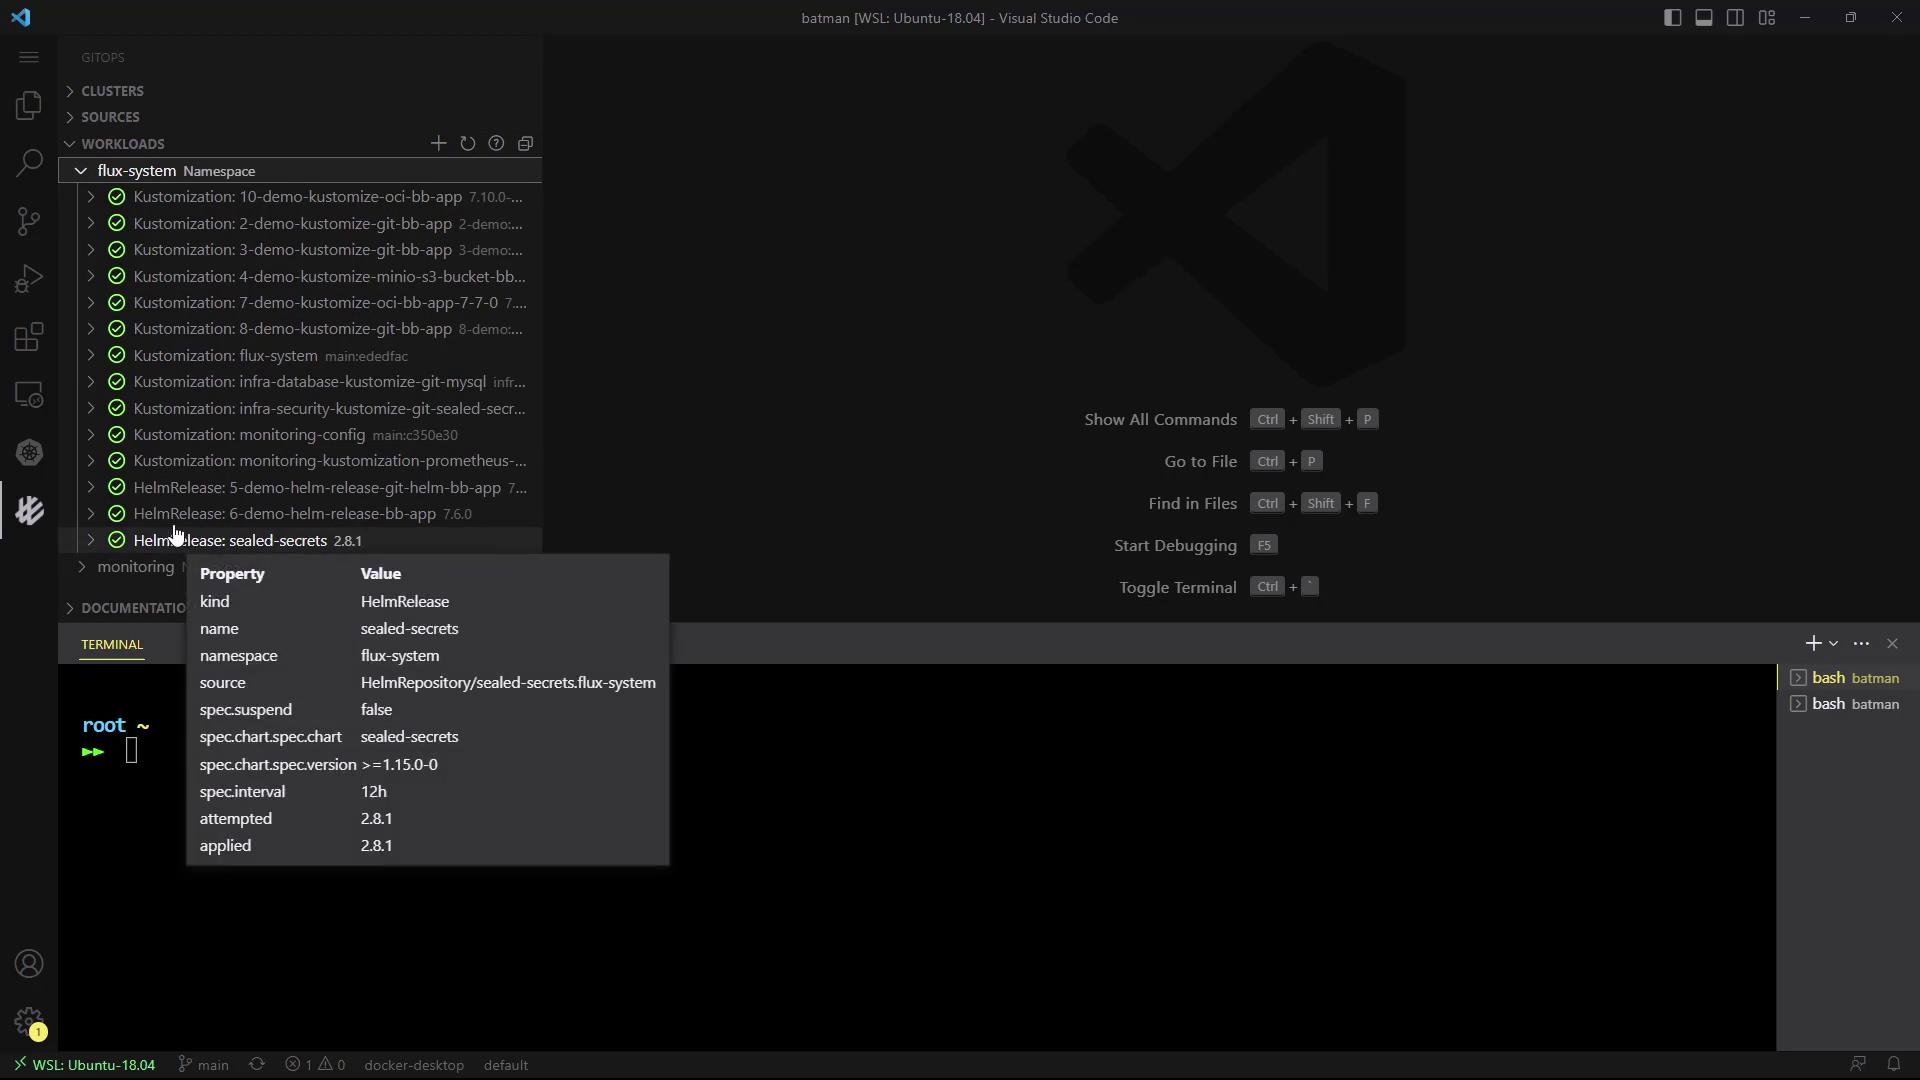
Adding New Sources or Kustomizations
Create new Git sources or Kustomizations via an intuitive form: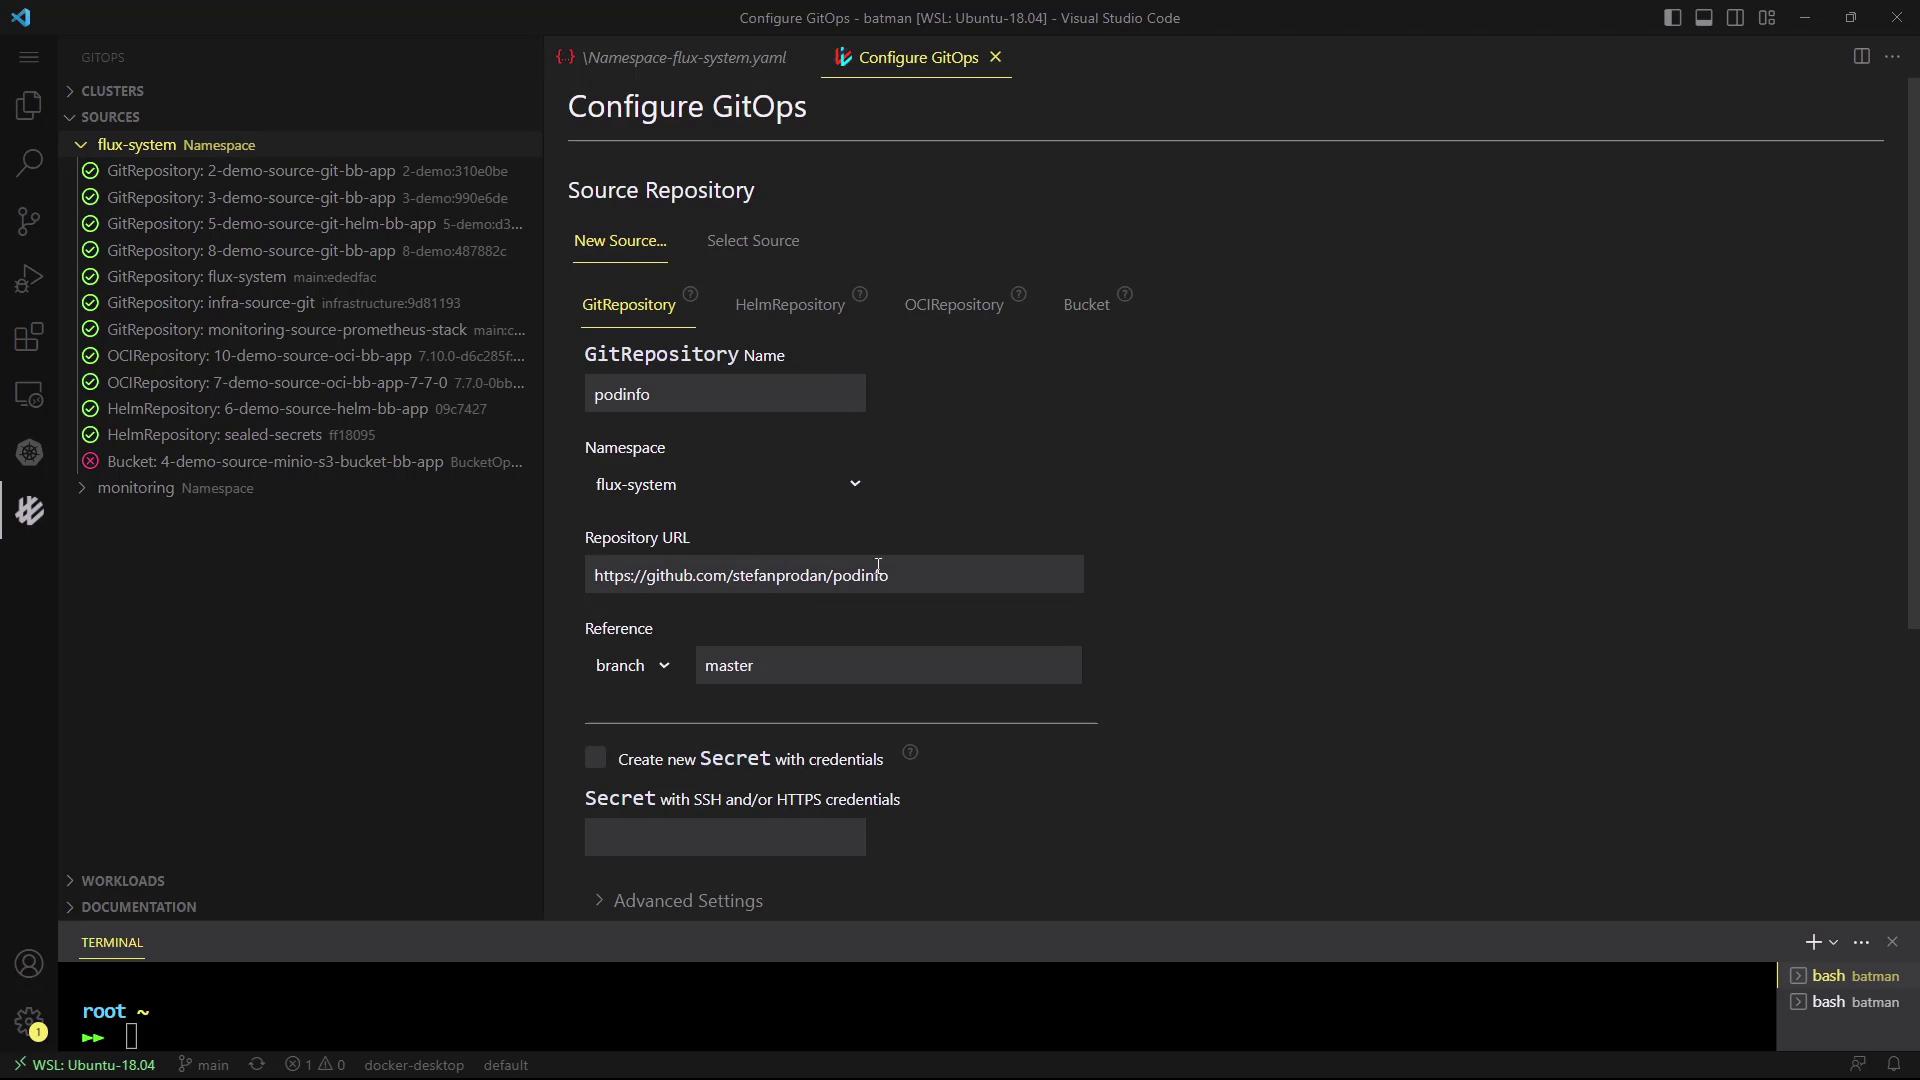
The VS Code extension is ideal for developers who prefer keeping their GitOps workflow within the editor.
2. Weaveworks GitOps User Interface
The Weaveworks GitOps UI (part of Weave GitOps) provides a standalone web dashboard for Flux.Prerequisites
- Kubernetes cluster with Flux installed
kubectlconfigured
Install the Weave GitOps CLI
Deploy the Dashboard
Generate and apply the dashboard manifest: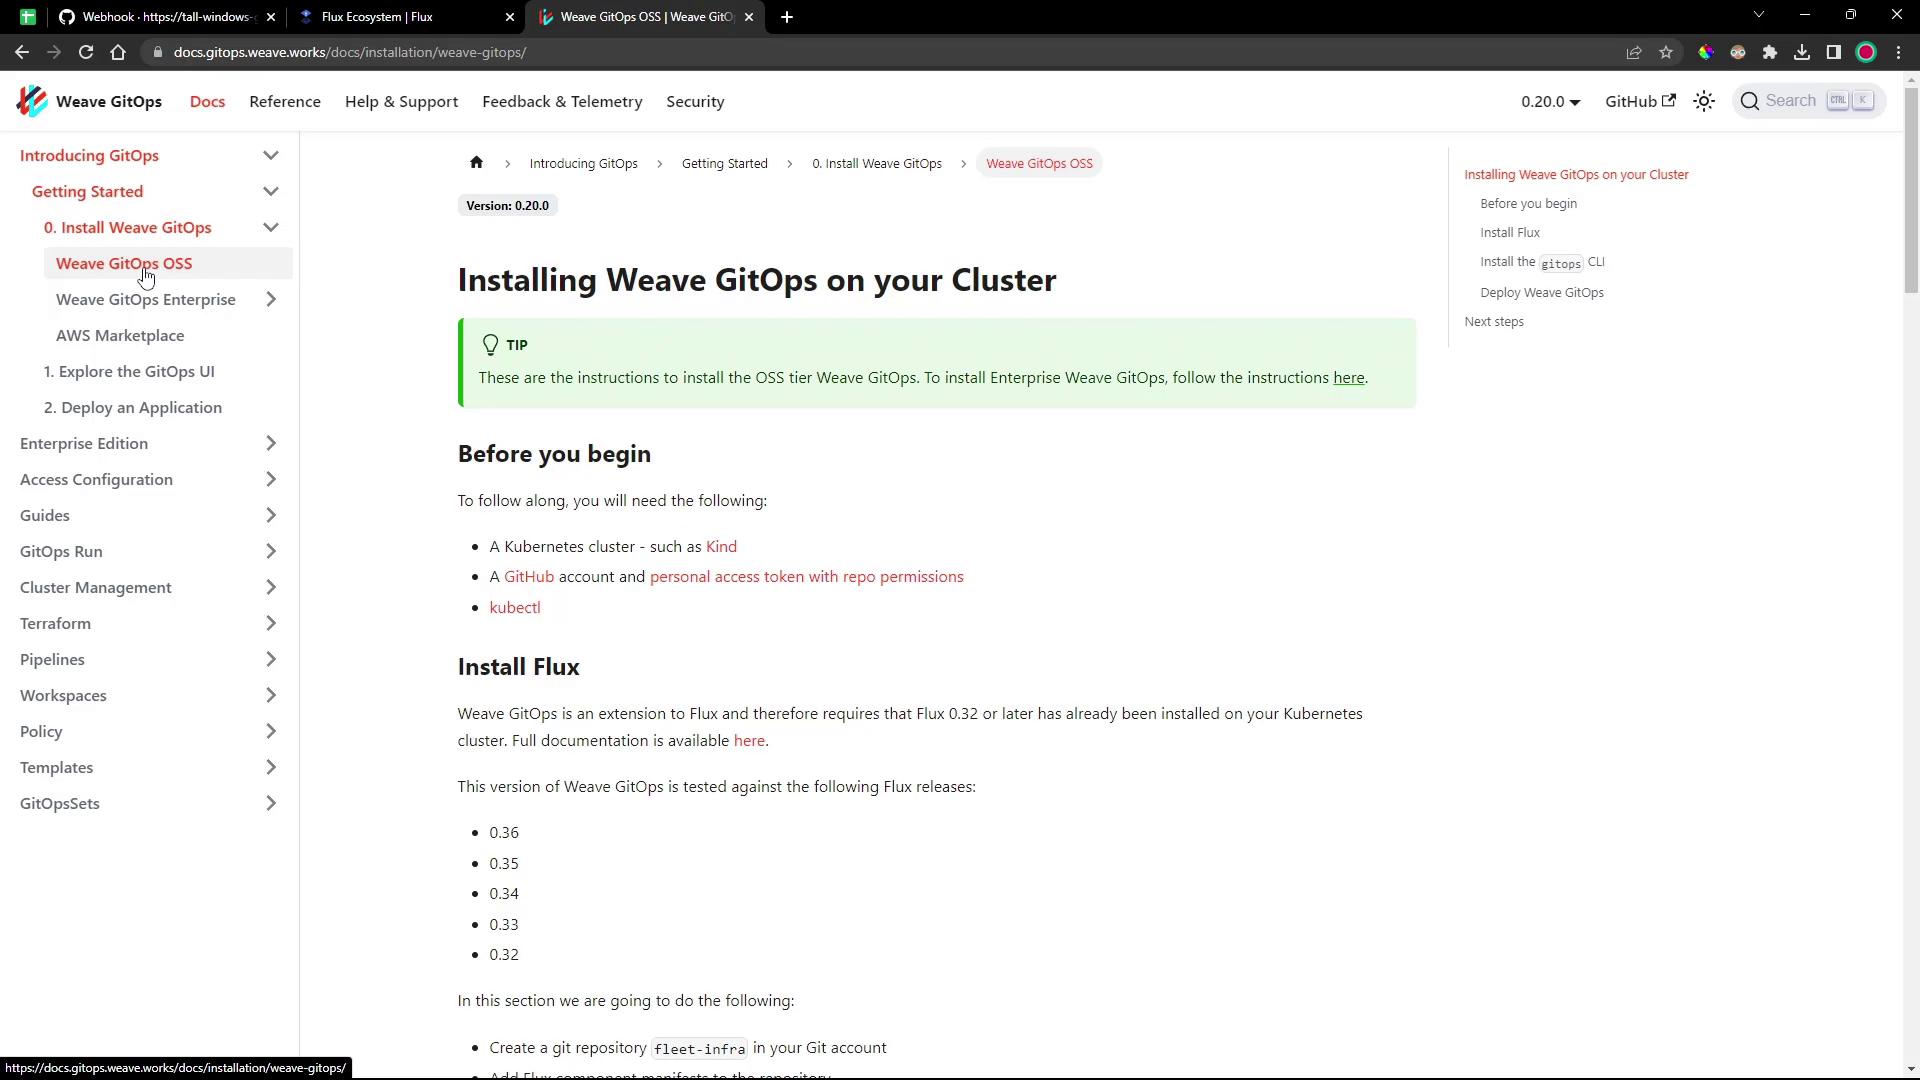
Expose & Access the Dashboard
List the GitOps service and pod:NodePort:
http://localhost:9001
Login with admin and your password.
Exposing services via
NodePort can pose security risks. Ensure proper network policies and firewall rules are in place.Dashboard Overview
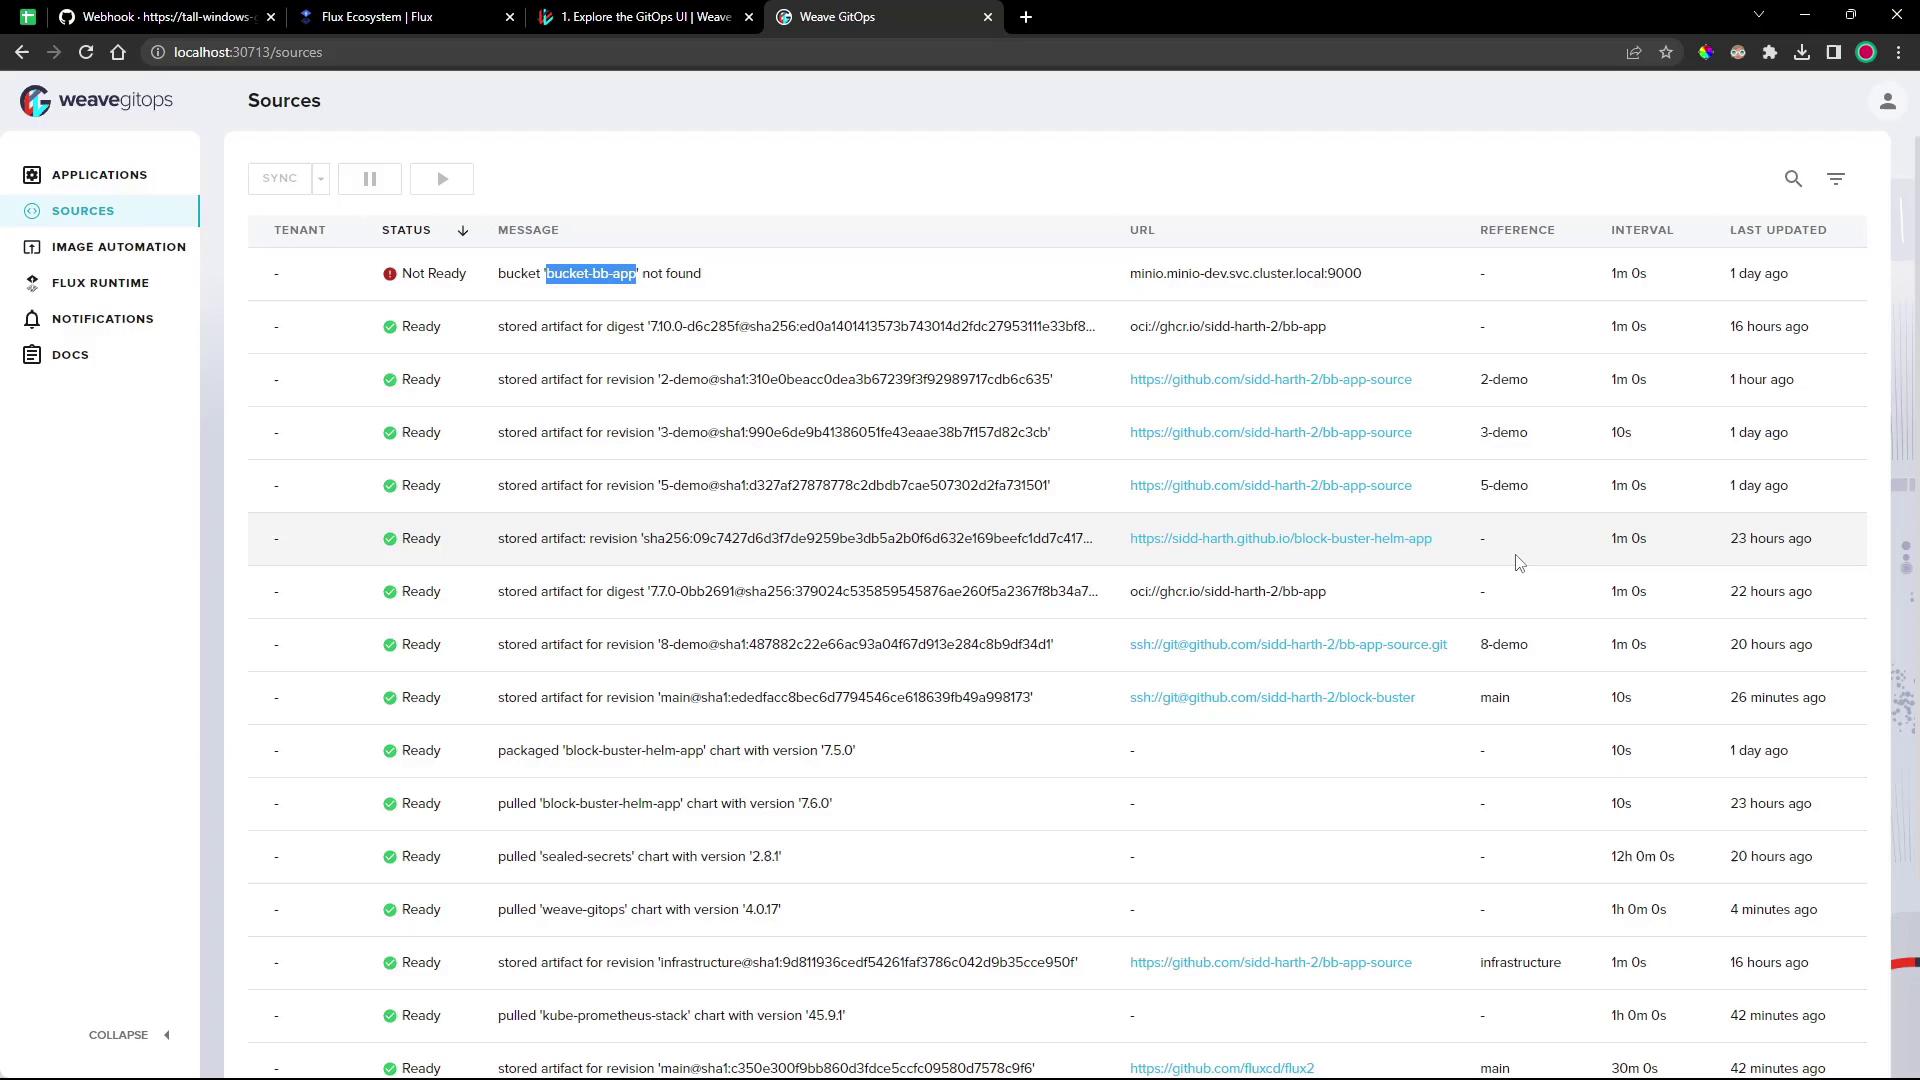
Sources
Monitor all Git and Helm sources, their sync status, intervals, and last reconciliation: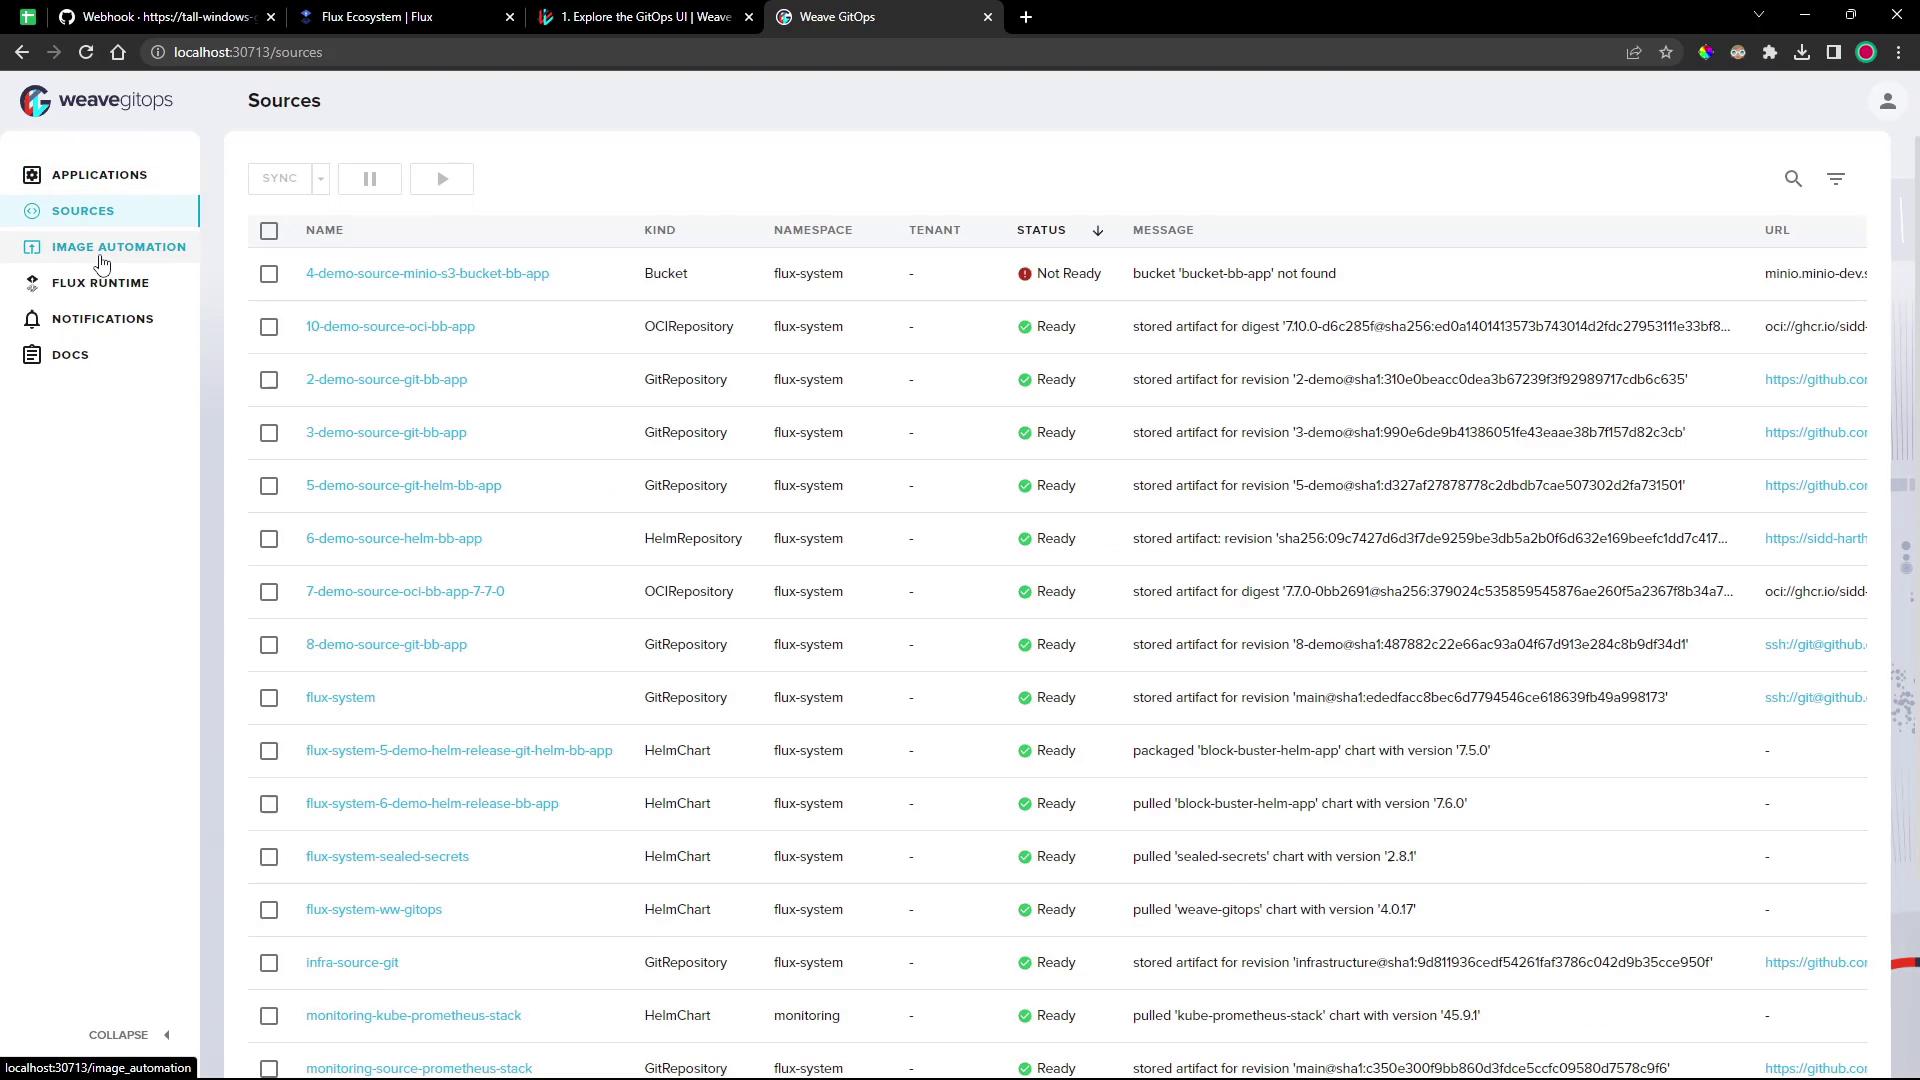
Applications
Inspect Kustomizations and HelmReleases along with dependency graphs, events, and raw YAML: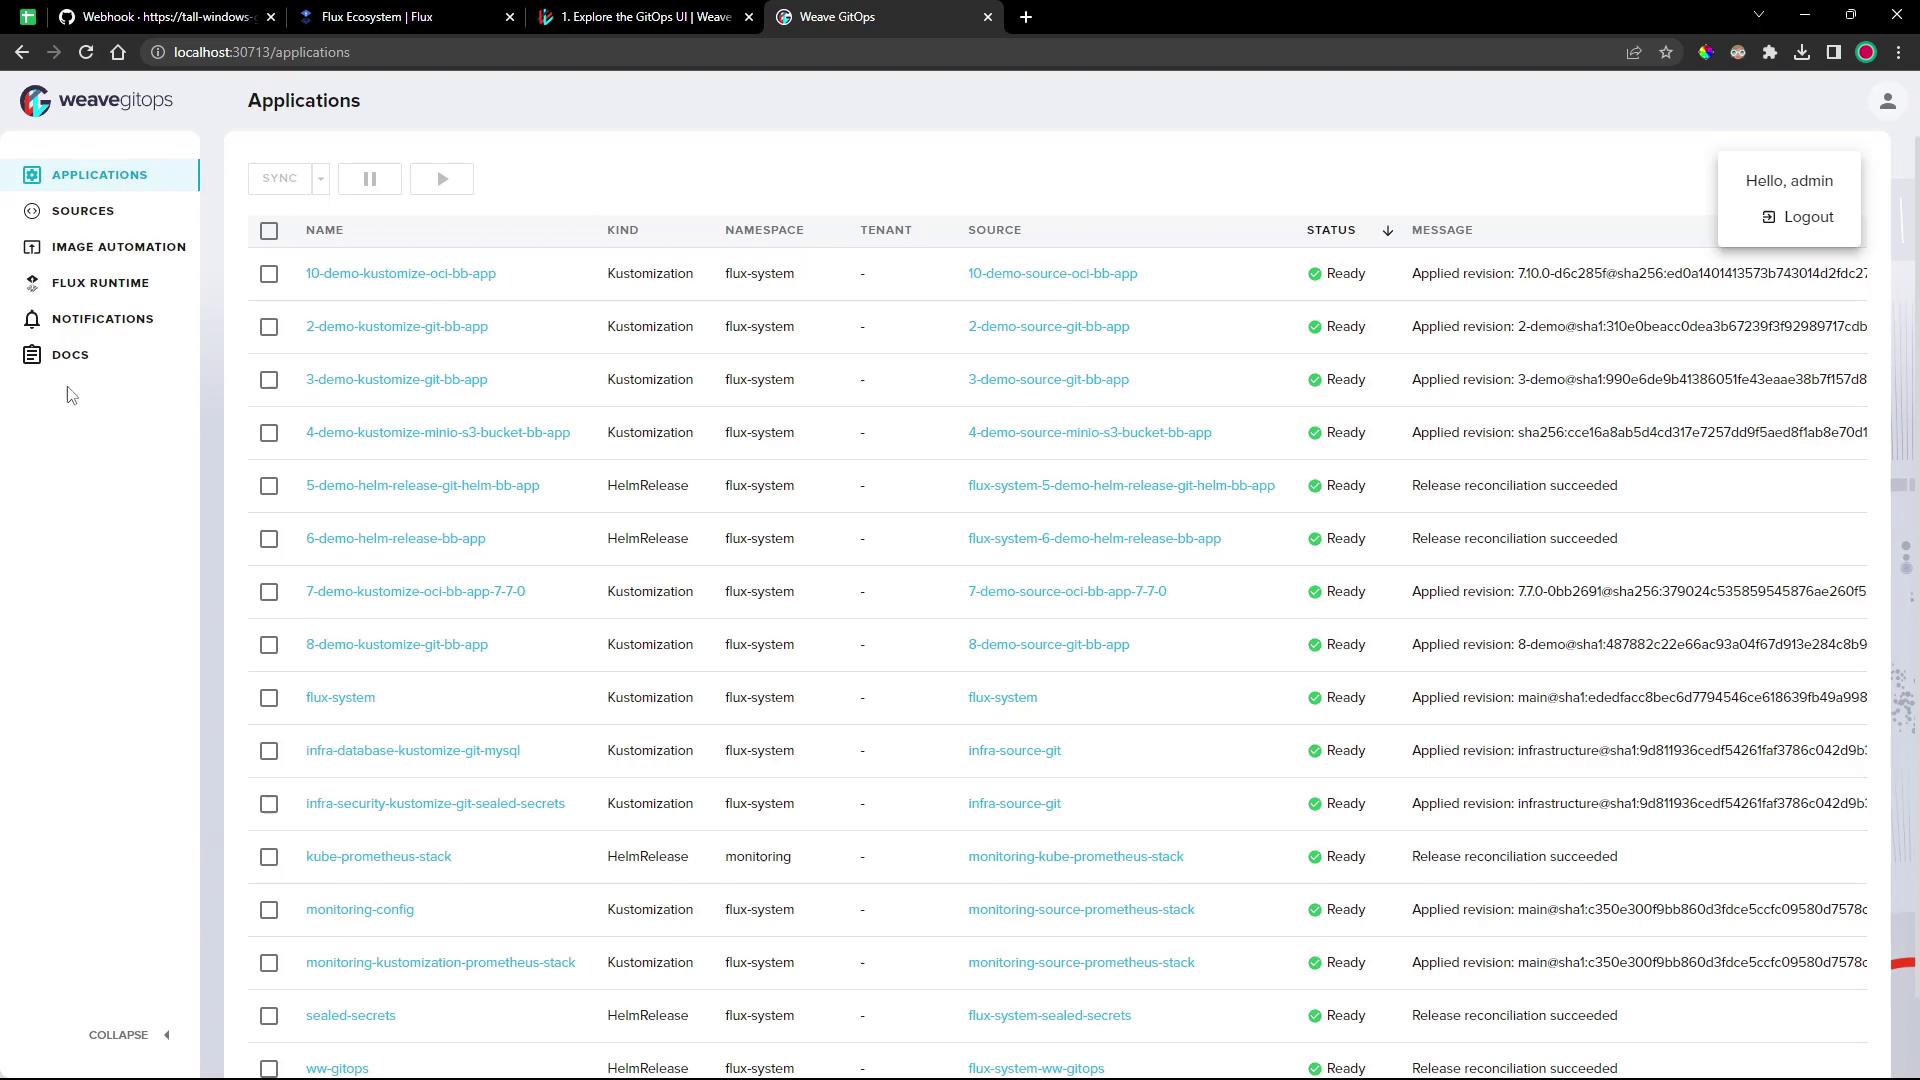
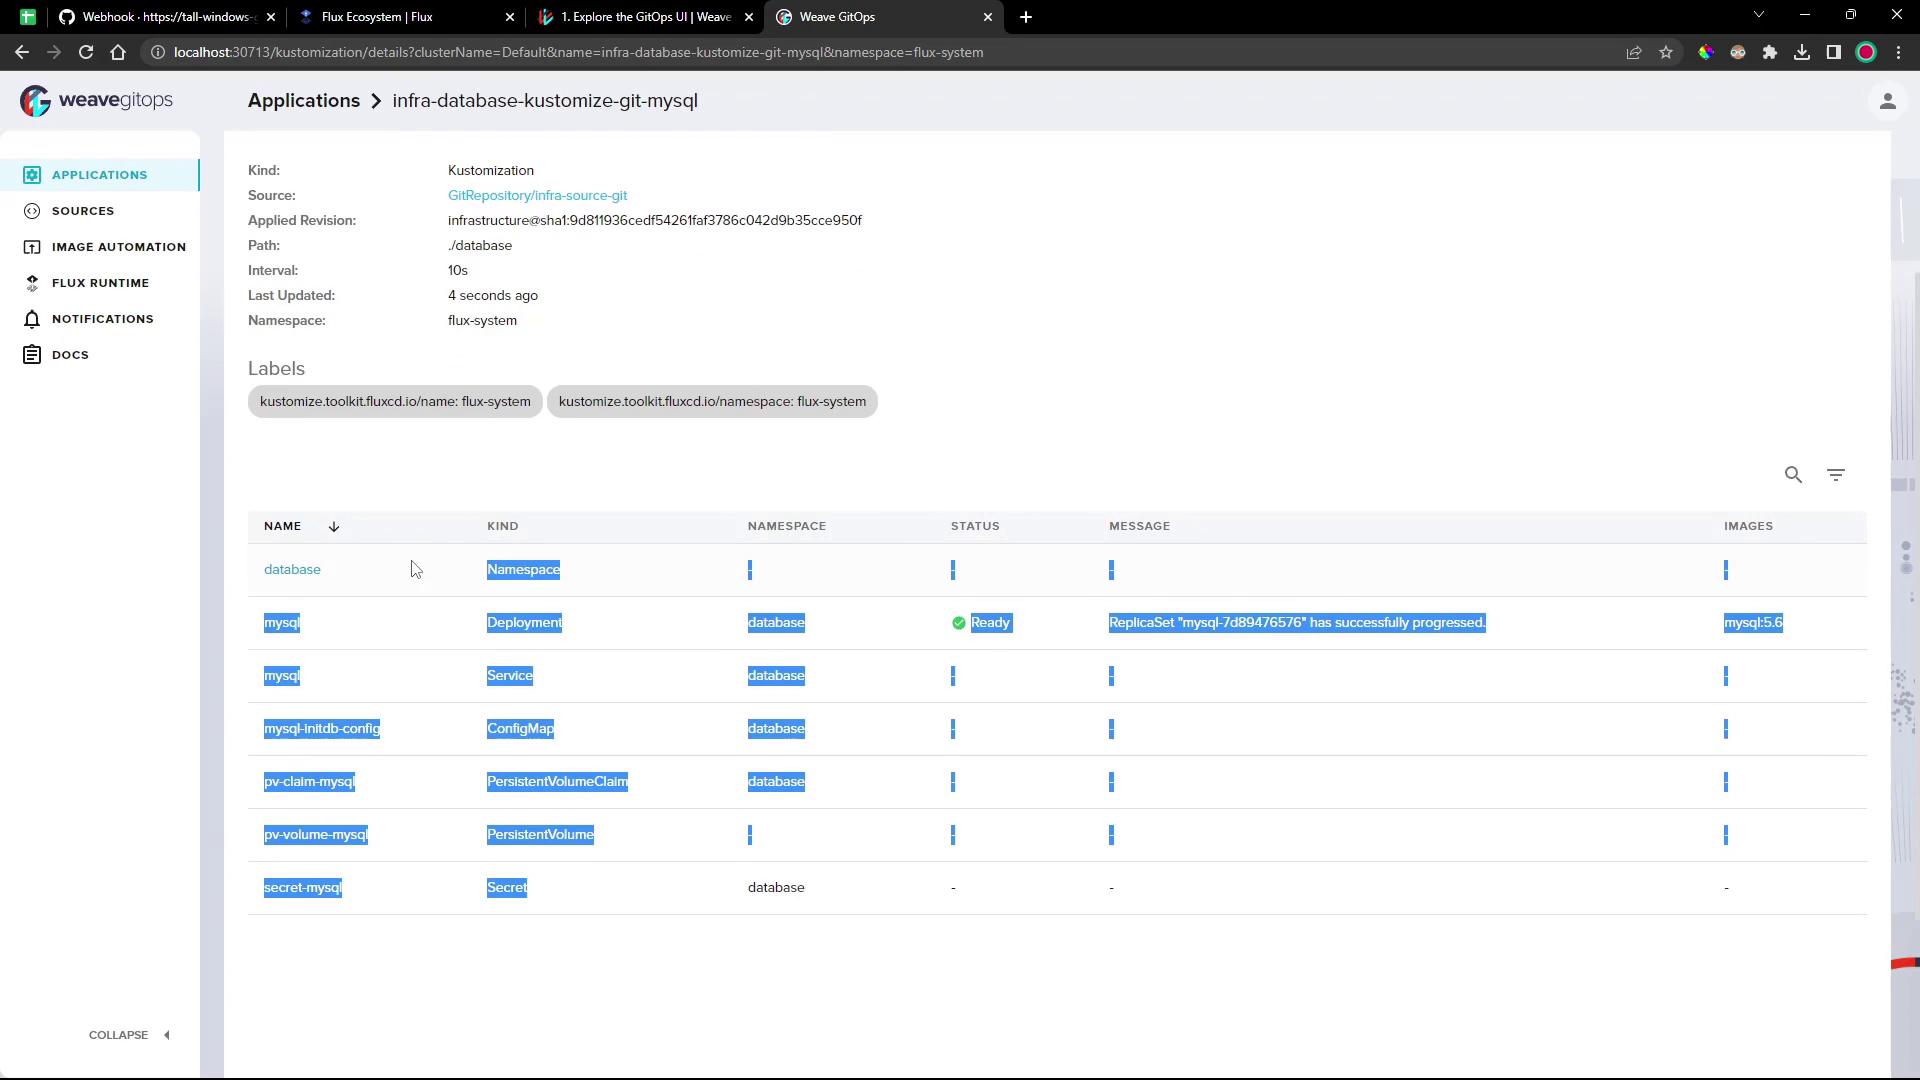
Image Automation & Notifications
Manage image repositories, policies, automation events, and notification controllers—all from the UI.Flux Runtime
View the status of all Flux controllers and custom resources in one panel: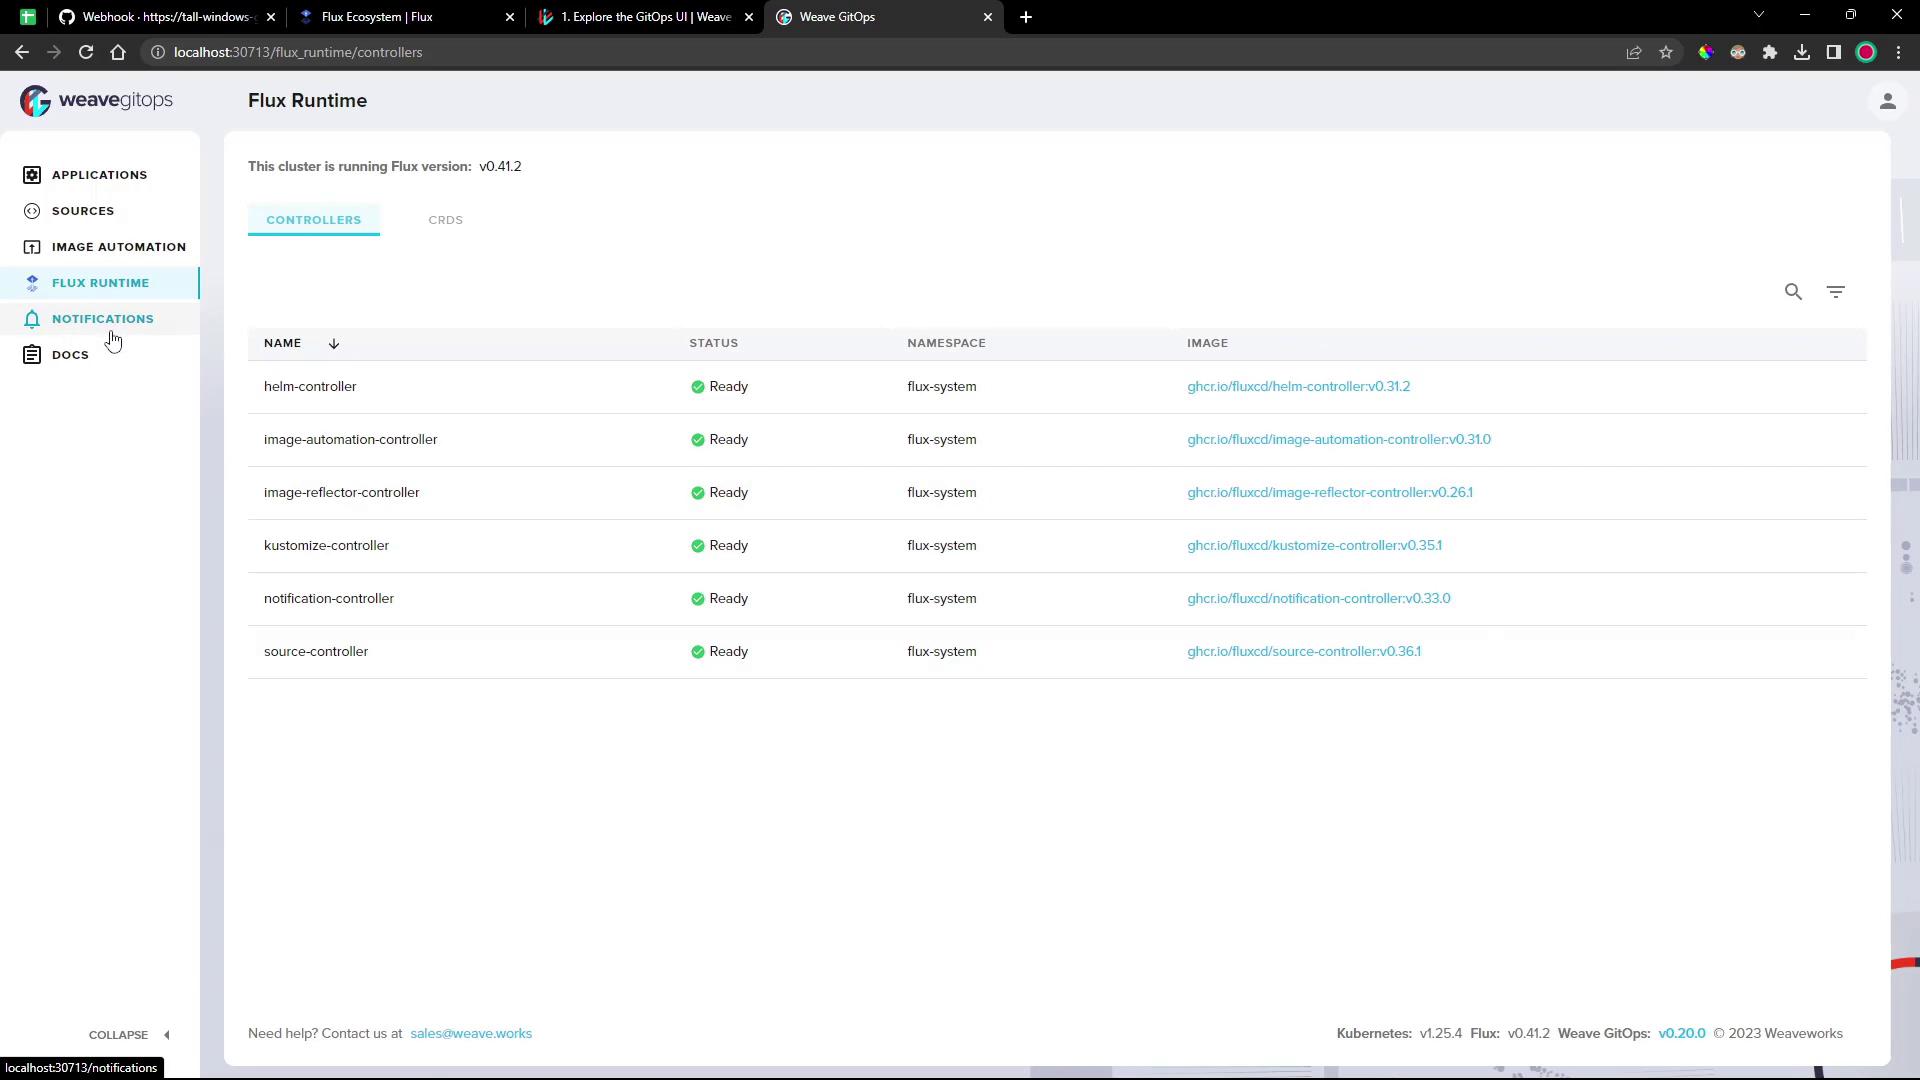
Whether you embed GitOps directly in VS Code or operate via a standalone dashboard, these tools streamline your Flux workflows and improve observability.