monitoring folder from the fluxcd/flux2 GitHub repo and deploy a PodMonitor CRD and Grafana dashboards via Flux Kustomizations.
1. Explore the monitoring directory
Clone or browse the Flux repository and locate themonitoring folder:
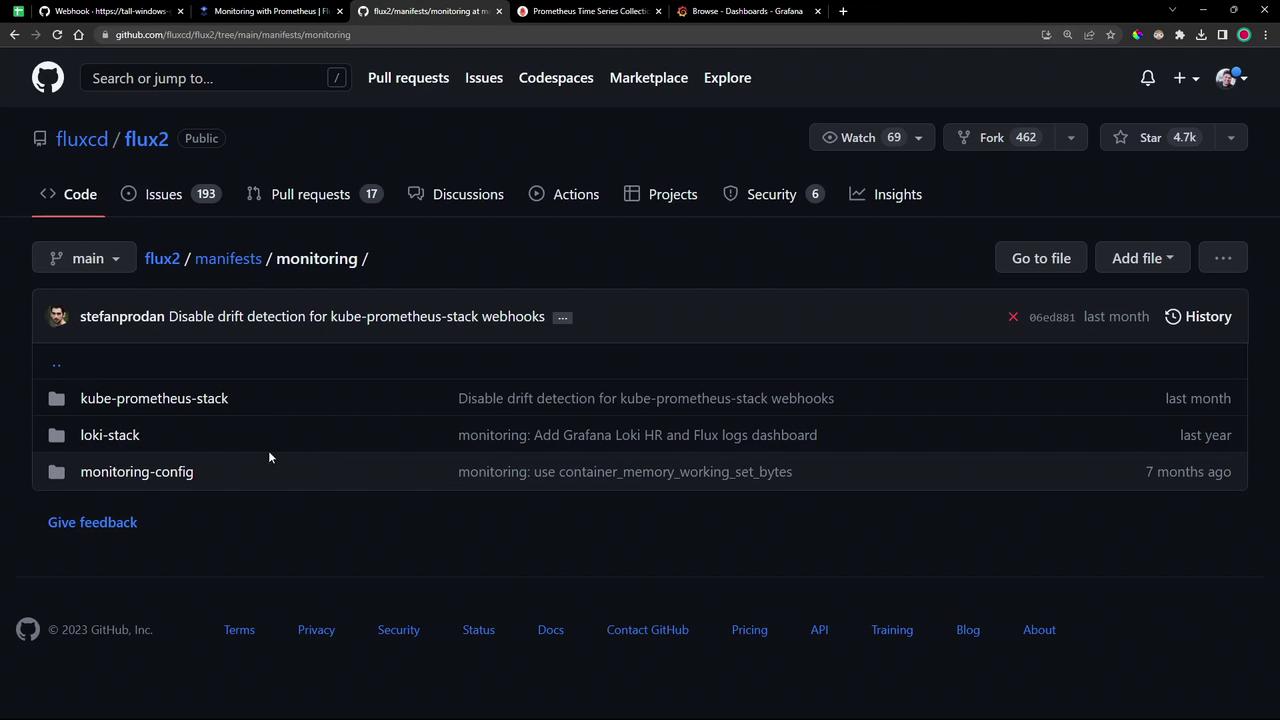
monitoring/ you’ll find:
- PodMonitor YAML for scraping all Flux controllers.
- A
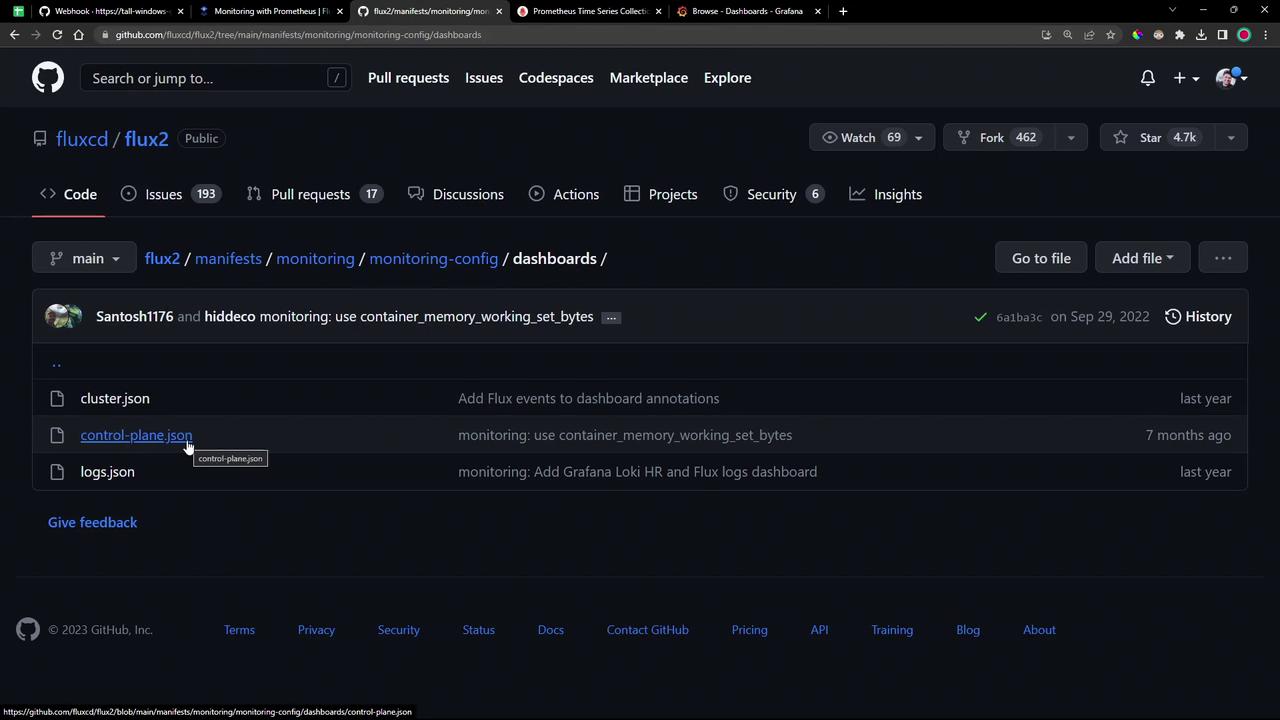
dashboards/folder with two Grafana JSON files:cluster.jsoncontrolplane.json
2. Apply the Flux PodMonitor
ThePodMonitor CRD instructs Prometheus to scrape metrics from Flux controllers in the flux-system namespace:
Ensure the Prometheus Operator and its CRDs (including
PodMonitor) are installed (for example via the kube-prometheus-stack).3. Create a Flux Kustomization
Automate the deployment by defining a FluxKustomization that points to your Git source:
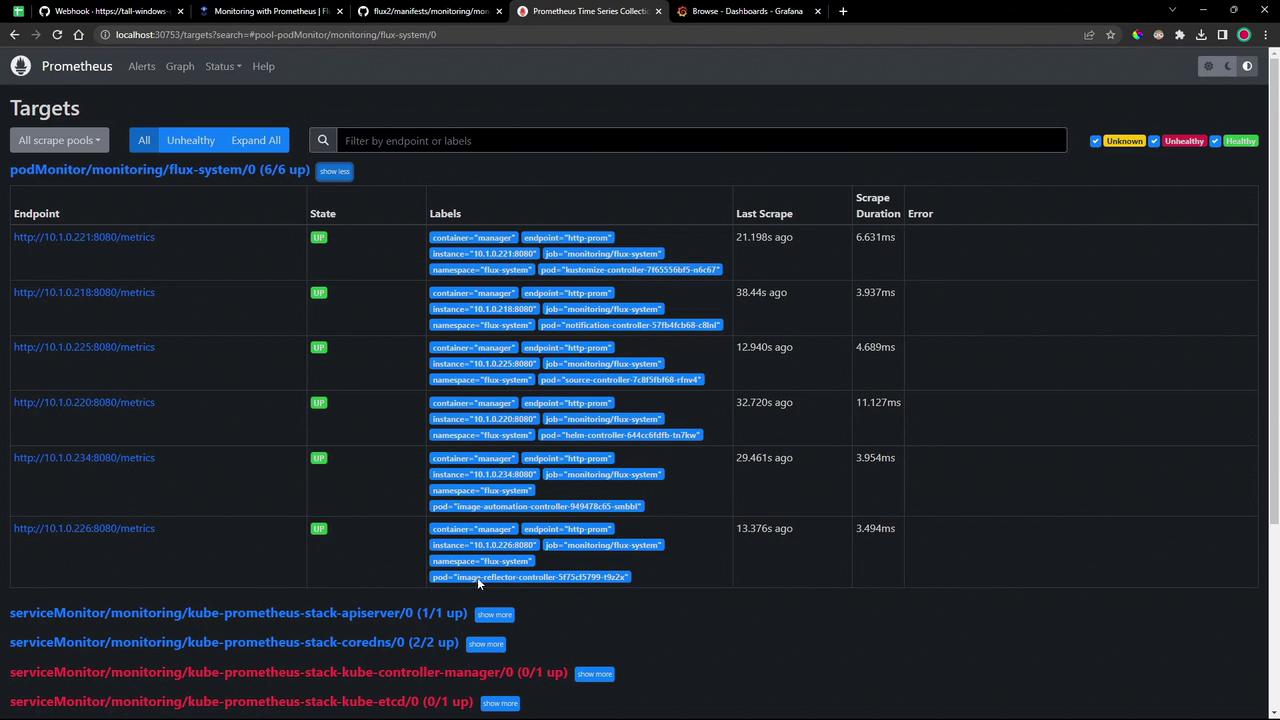
4. Validate in Prometheus
Open your Prometheus UI and go to Status → Targets. Within seconds, the Flux controller endpoints should appear asUP:
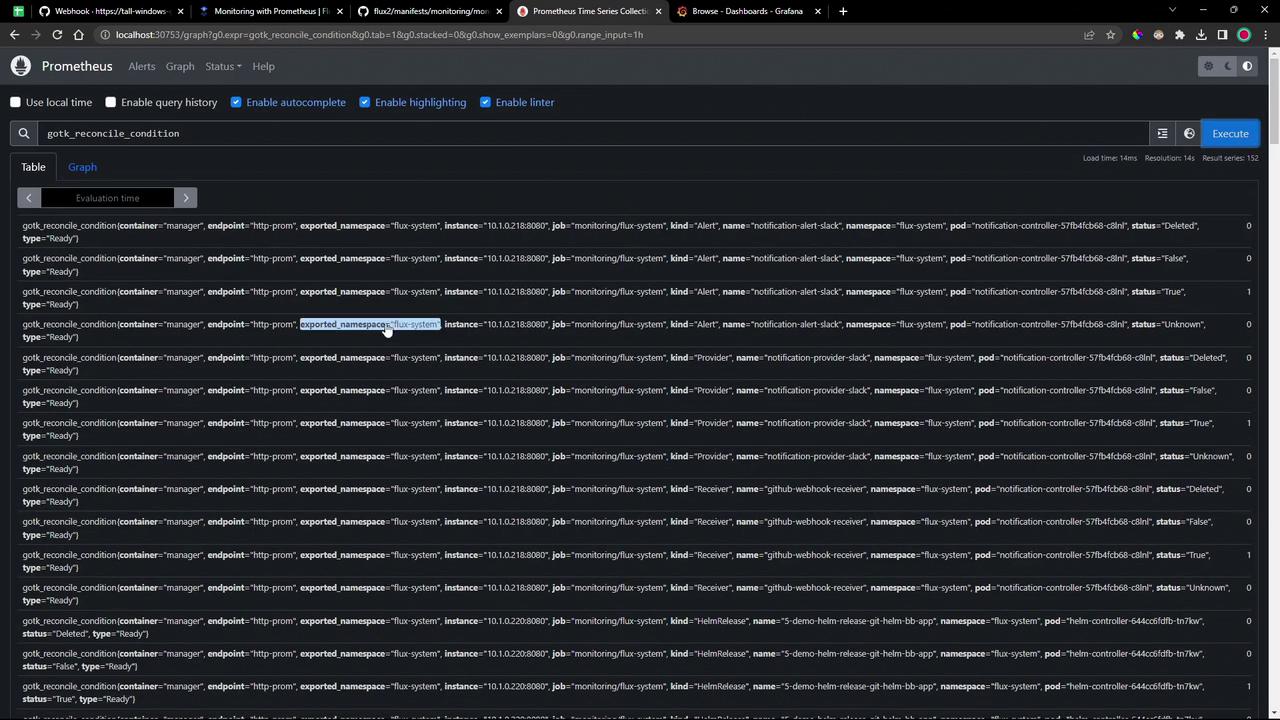
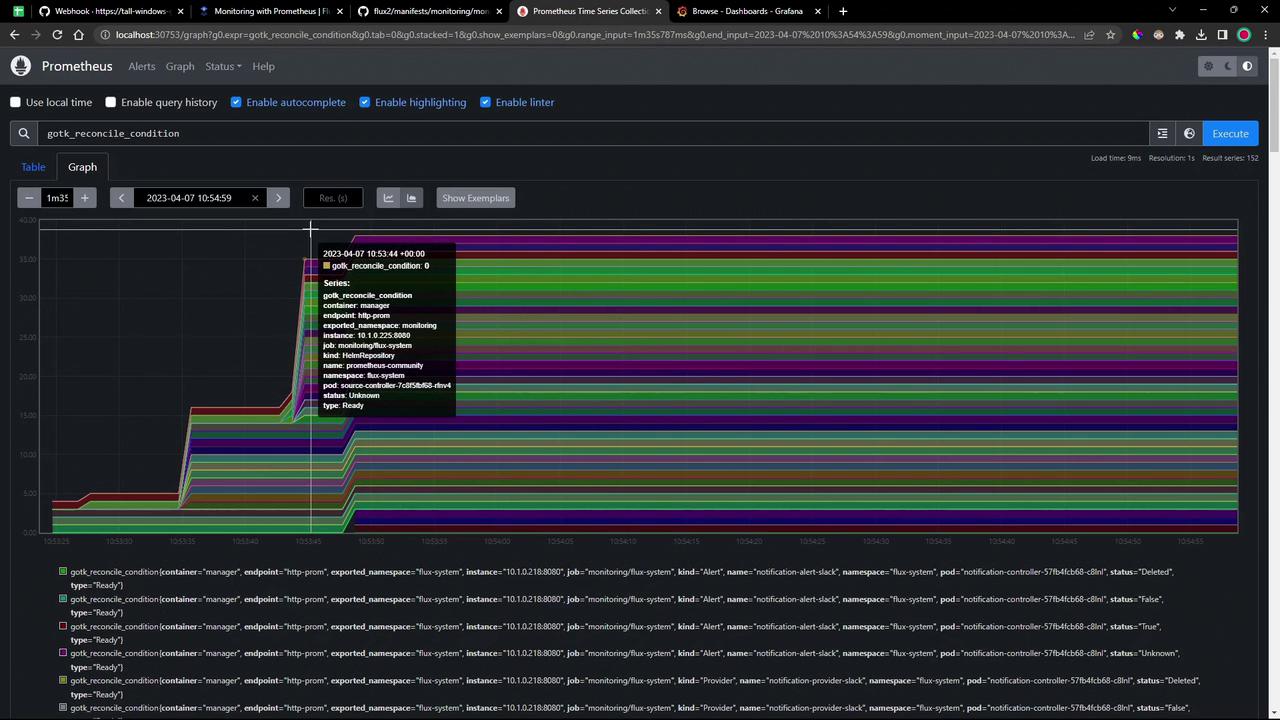
Common gotk_ Queries
| Query | Description |
|---|---|
gotk_reconcile_condition{type="Ready", status="True"} | Count of successful reconciliations |
gotk_reconcile_condition{type="Ready", status="False"} | Count of failed reconciliations |
gotk_suspend_status | Suspension state of Git sources/controllers |
gotk_reconcile_duration_seconds_bucket | Histogram buckets for reconcile durations |
gotk_reconcile_duration_seconds_sum | Total reconcile duration |
gotk_reconcile_duration_seconds_count | Number of reconcile operations |
5. Explore Grafana Dashboards
After Flux applies the dashboard JSON, refresh Grafana. Two dashboards are now available:- Flux Control Plane
- Flux Cluster Stats
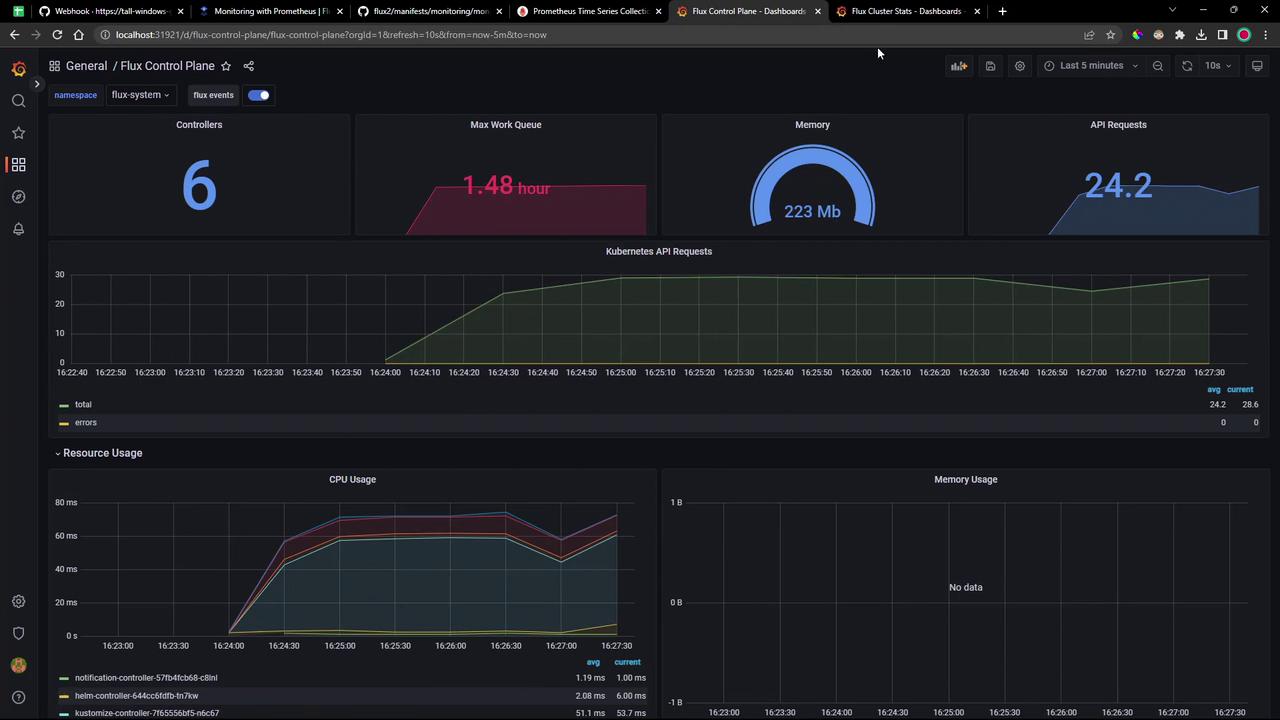
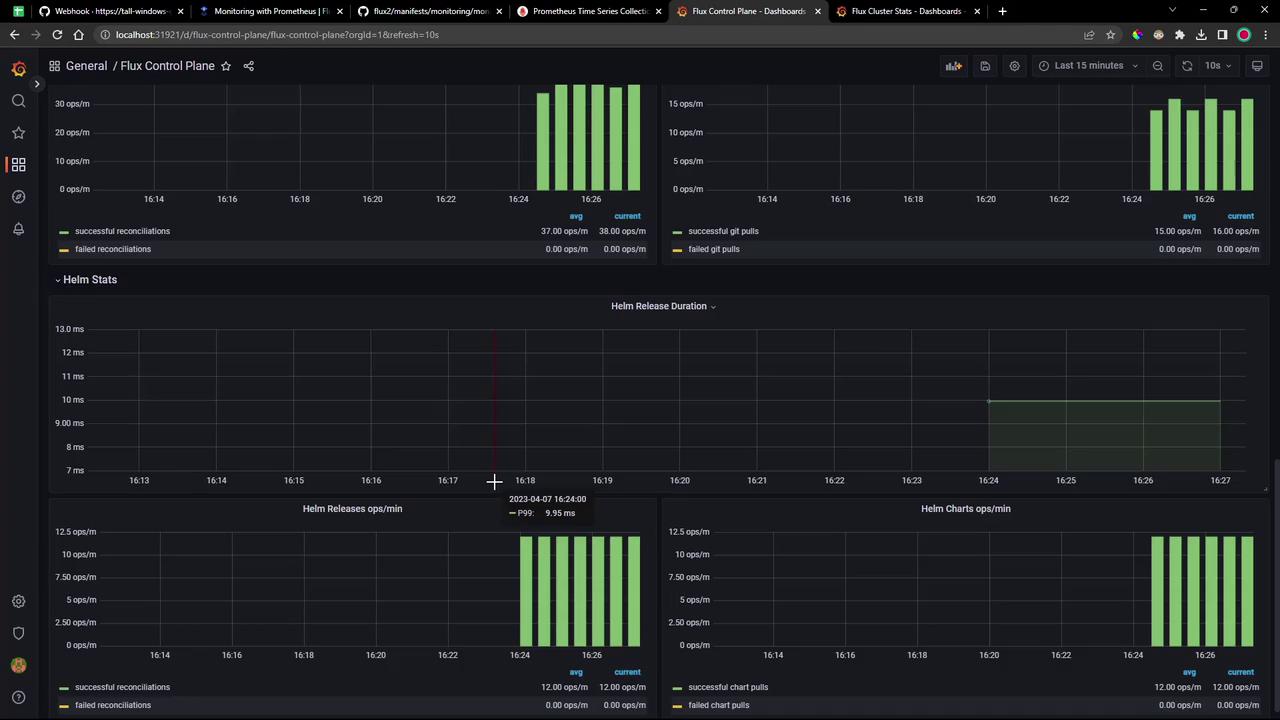
Flux Control Plane
Tracks each controller’s queue lengths, CPU/memory usage, API request rates, and reconciliation durations: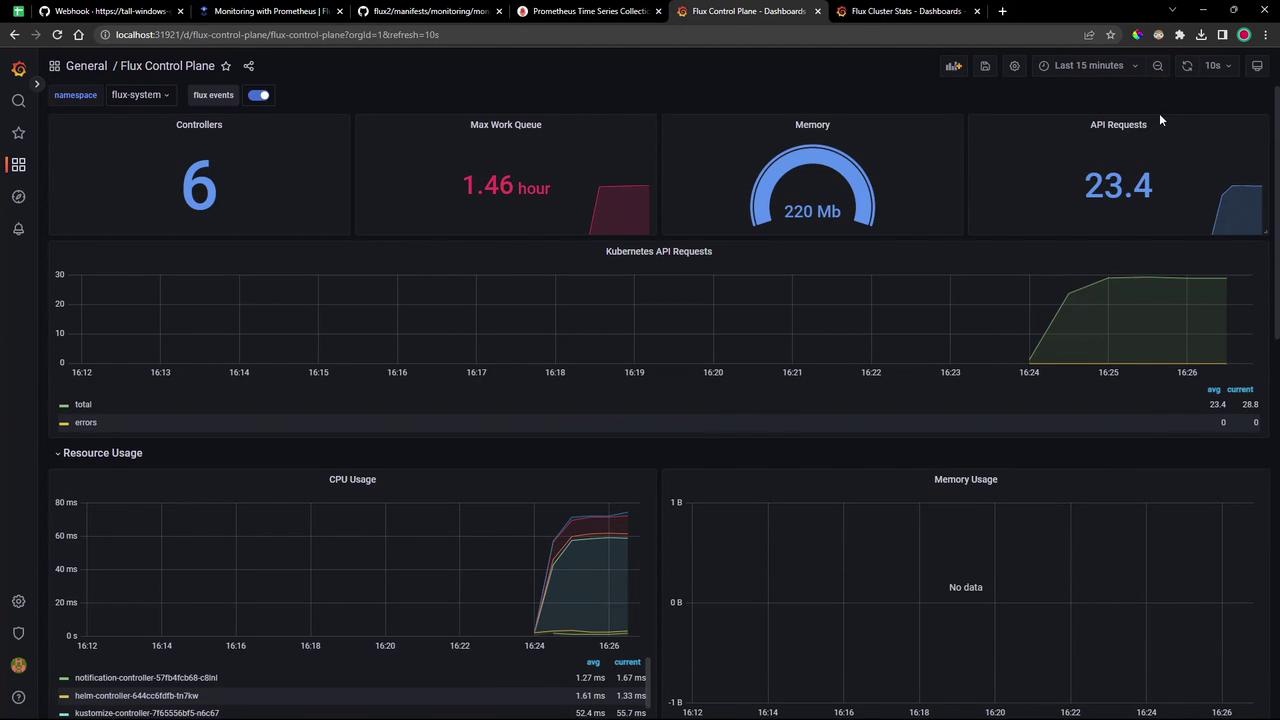
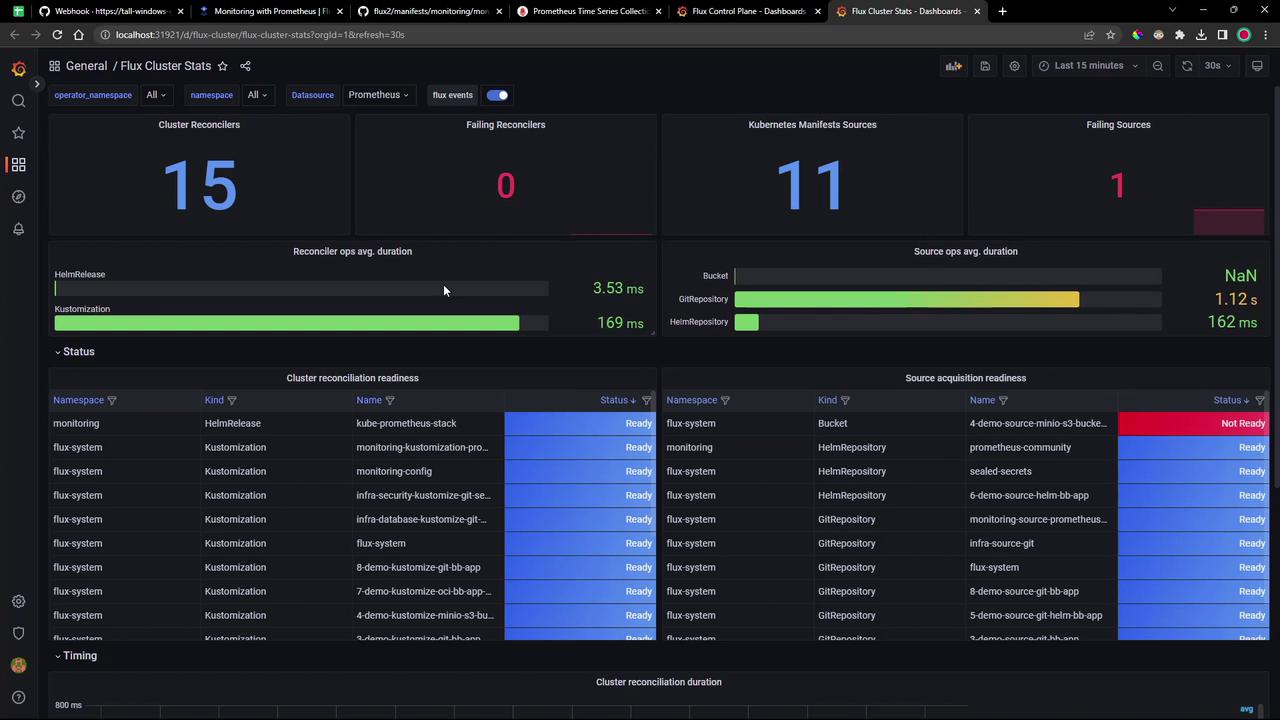
Flux Cluster Stats
Provides cluster-wide health: counts of reconcilers, failing controllers, manifest source statuses, operation durations, and readiness tables: