Verify Integrity and Availability of Resources and Processes
This article explains how to verify the integrity and availability of system resources and processes through various monitoring tools and commands.
In this lesson, we explain how to verify the integrity and availability of key system resources and processes. Over time, servers tend to use more resources—storage space may fill up as databases grow or users store more files. In cloud environments, adding storage devices is relatively straightforward, but knowing when your storage is near capacity is essential.Below, we provide detailed steps to monitor disk space, RAM, CPU load, file system integrity, and essential services.─────────────────────────────────────────────
The “df” (disk free) utility reports on disk usage. By default, sizes are shown in 1-kilobyte blocks, which can be difficult to interpret. Use the “-h” option to display sizes in a human-readable format (MB, GB, TB).Example output of “df”:
In the output above, filesystems labeled as “tmpfs” are virtual filesystems that only reside in memory. In this case, only two actual filesystems are in use: the root filesystem (mounted on ”/”) where the Linux operating system is installed, and the smaller “/boot” filesystem that holds boot files.To view the disk space used by a specific directory, use the “du” (disk usage) utility. By default, “du” lists the space used by the directory and all of its subdirectories. The “-s” (summarize) option provides output for the specified directory only, while “-h” displays sizes in a human-friendly format.
Monitoring RAM is as important as disk monitoring. The “free” command displays how much RAM is used and available, while the “-h” option renders sizes in a human-readable format (using mebibytes and gibibytes).
Copy
$ free -h total used free shared buff/cache availableMem: 3.6Gi 1.0Gi 1.5Gi 15Mi 1.1Gi 2.4GiSwap: 2.0Gi 0B 2.0Gi
In this example, the “used” value might appear high, but the “available” column indicates that 2.4 GiB of memory can still be reclaimed if necessary. Temporary memory used for caching large files does not prevent the memory from being available to applications.
Use the “free -h” command as a quick reference to ensure your system has adequate memory, especially when running high-load applications.
The “uptime” command provides key data about system load and uptime. The output shows three load average numbers representing the average system load over the last 1, 5, and 15 minutes.
A load average of 1.0 over the last minute indicates that one CPU core has been fully utilized on average. For systems with multiple cores, a load average higher than the number of cores suggests some processes are waiting for CPU time. Consistently high load averages may signal the need to upgrade hardware or optimize running processes.─────────────────────────────────────────────
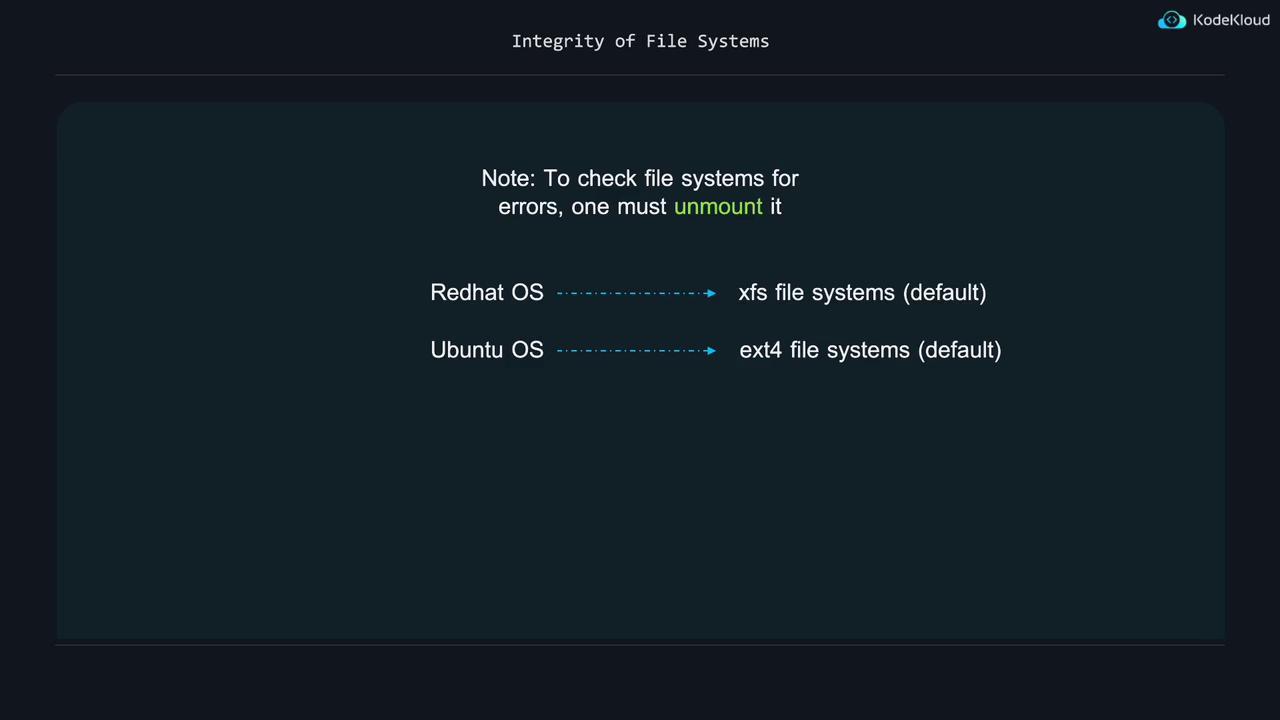
Before checking a file system for errors, ensure it is unmounted. File system checks differ depending on whether your system uses XFS or ext4. For more detailed information on file systems, partitions, mounting, and unmounting, refer to our upcoming storage sections.
Operating systems in the Red Hat family typically use the XFS file system by default, while Ubuntu systems use ext4.
To verify an XFS file system, run:
Copy
$ sudo xfs_repair -v /dev/vdb1Phase 1 - find and verify superblock... - block cache size set to 175968 entriesPhase 2 - using internal log zero log...zero_log: head block 103 tail block 103 scan filesystem freespac and inode maps... found root inode chunkPhase 3 - for each AG... scan and clear agi unlinked lists... process known inodes and perform inode discovery... agno = 0 agno = 1 agno = 2 agno = 3Phase 4 - check for duplicate blocks... setting up duplicate extent list... check for inodes claiming duplicate blocks... agno = 0 agno = 1 agno = 2 agno = 3Phase 5 - rebuild AG headers and trees... agno = 0 agno = 1 agno = 2 agno = 3Phase 6 - check inode connectivity... resetting contents of realtime bitmap and summary inodes traversing filesystem agno = 0 agno = 1 agno = 2 agno = 3Phase 7 - scan finished ... moving disconnected inodes to lost+found ...done
Here, “/dev/vdb1” is the partition containing the file system. Depending on your configuration, the device name might differ (for example, “/dev/vda2” or “/dev/sdc3”).For an ext4 file system, use the fsck utility with ext4 options. The “-v” flag increases verbosity, “-f” forces a check even on healthy filesystems, and “-p” (preen mode) fixes simple issues automatically.
Copy
$ sudo fsck.ext4 -v -f -p /dev/vdb211 inodes used (0.00%, out of 262144)0 non-contiguous files (0.0%)0 non-contiguous directories (0.0%)# of inodes with ind/dind/tind blocks: 0/0/0Extent depth histogram: 336942 blocks used (3.52%, out of 1048576)0 bad blocks1 large file0 regular files2 directories0 character device files0 block device files0 fifos0 links0 symbolic links (0 fast symbolic links)0 sockets__________2 files
Using the “-p” option with fsck.ext4 is especially useful when the file system has many errors, as it automates the repair process.
Ensuring that critical services are running is vital for system stability. The following command displays systemd unit dependencies in a tree-like structure, helping you visualize service relationships.
In the dependency tree, a green (active) circle indicates the service is running, while a white (inactive) circle means it isn’t. Some services only run briefly at boot (and then exit), but others—like ssh.service, cron.service, and atd.service—should remain active.To simulate an issue, let’s terminate the atd daemon:
Copy
$ sudo pkill atd
After terminating, check the dependencies to see that the atd service is now inactive:
By using tools such as df, du, free, uptime, and file system check utilities like xfs_repair and fsck.ext4, alongside service monitoring commands like systemctl and journalctl, you can proactively verify the integrity and availability of your server’s resources and processes. This systematic monitoring helps ensure your systems run smoothly and alerts you early to potential issues.Happy monitoring!