AWS Certified SysOps Administrator - Associate
Domain 1 Monitoring Logging and Remediation
Demo Building a simple CloudWatch Dashboard
Welcome to this lesson on creating a custom AWS CloudWatch dashboard. In this guide, we will walk through the process of designing your own dashboard, adding various widgets, and configuring alarms to monitor your AWS resources effectively.
Creating the Dashboard
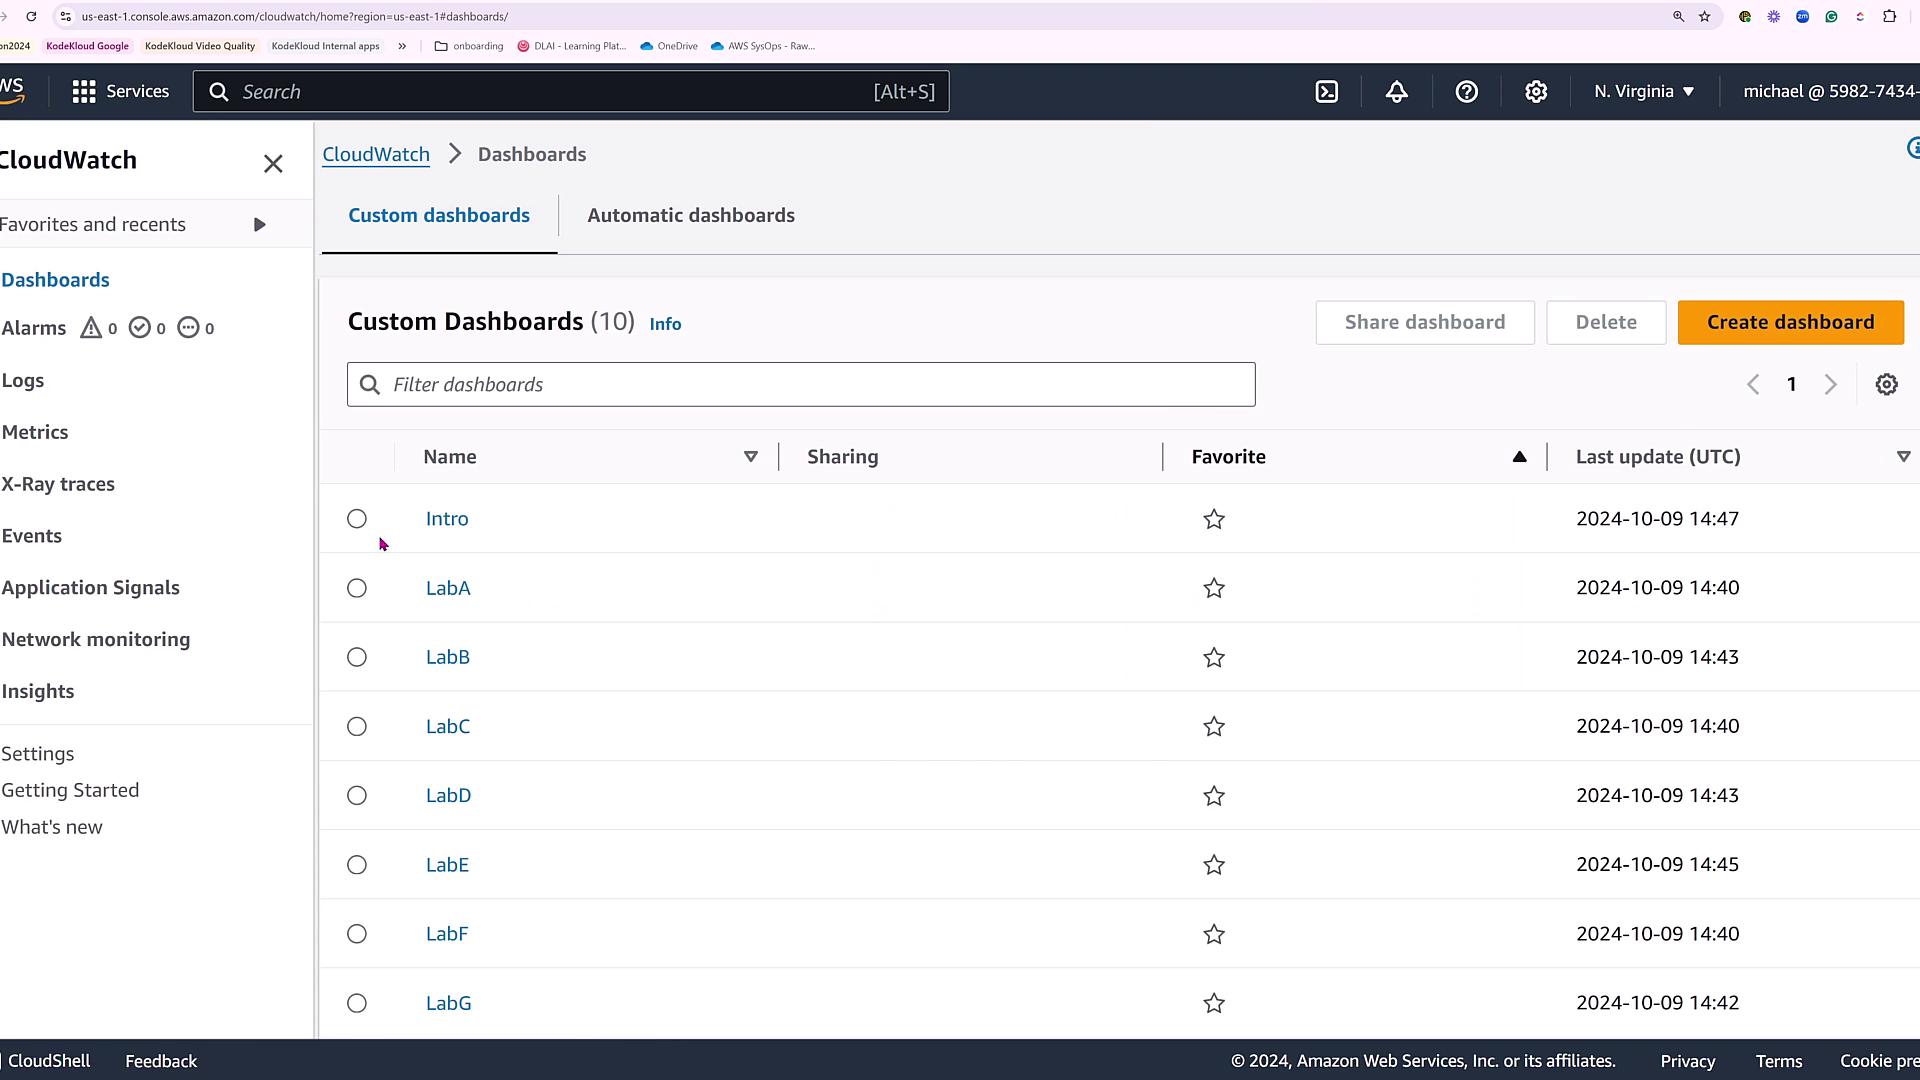
Begin by navigating to the CloudWatch service and clicking on "Dashboards." Here you will see a list of existing dashboards:
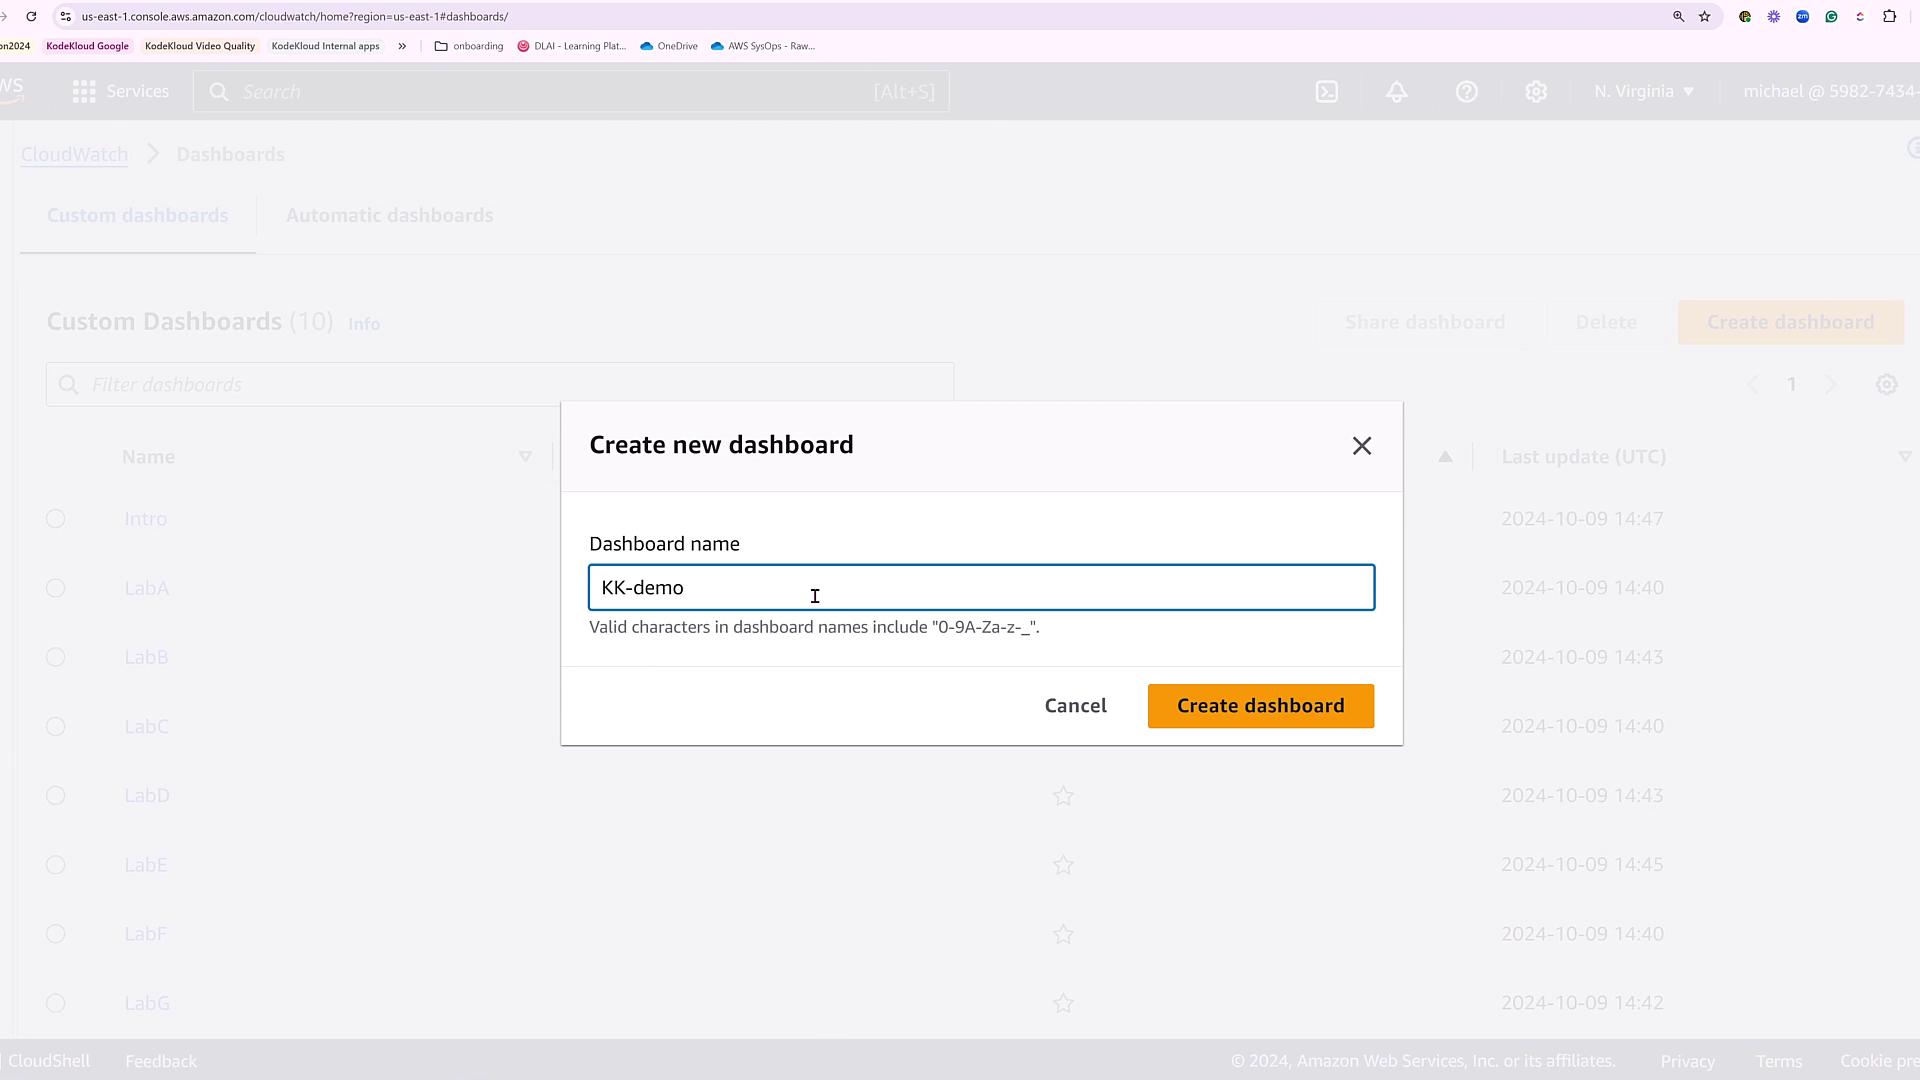
Click on "Create dashboard" to start building your new dashboard. For this demonstration, we will name the dashboard "KodeKloud demo dashboard":
Choosing the Data Source
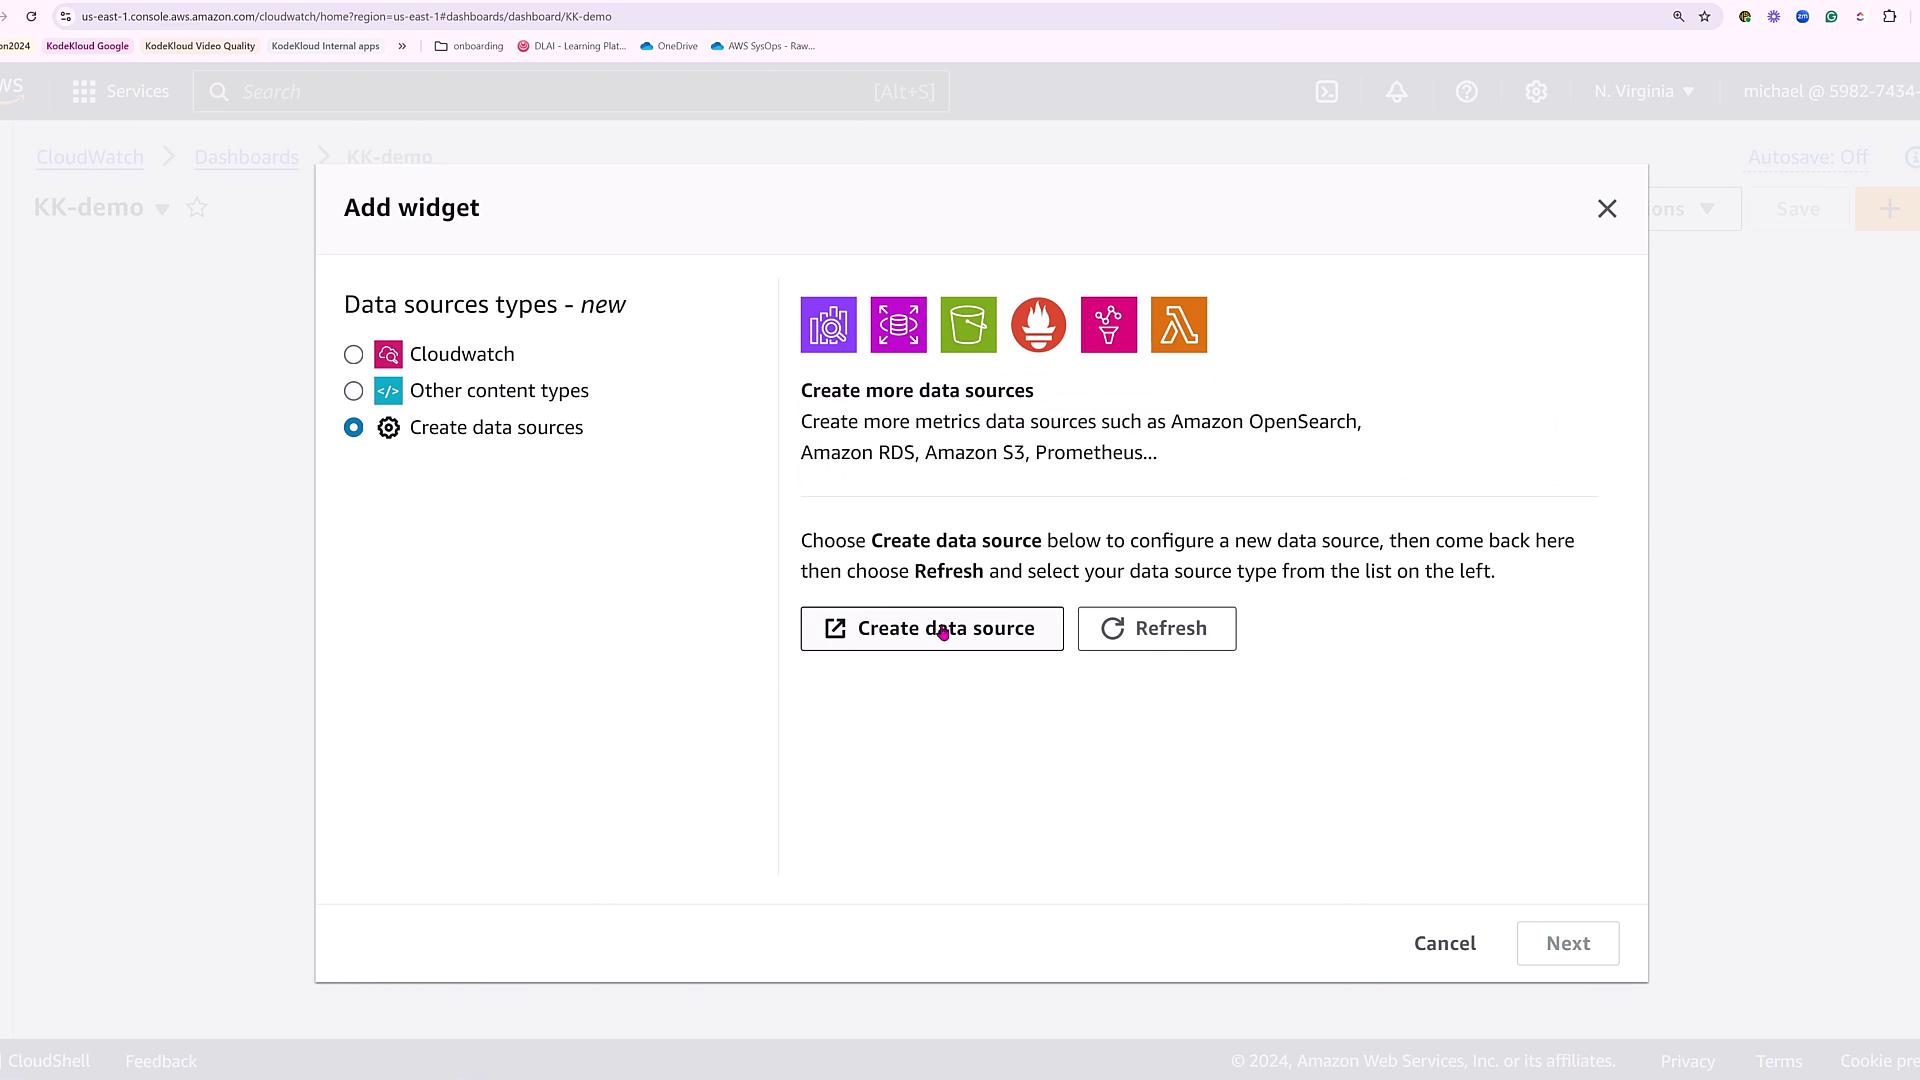
After specifying your dashboard name, you will be presented with several data source options. In addition to CloudWatch, you can link other data sources such as Lambda, Prometheus, and more.
For this demo, we will continue to use CloudWatch as our primary data source:
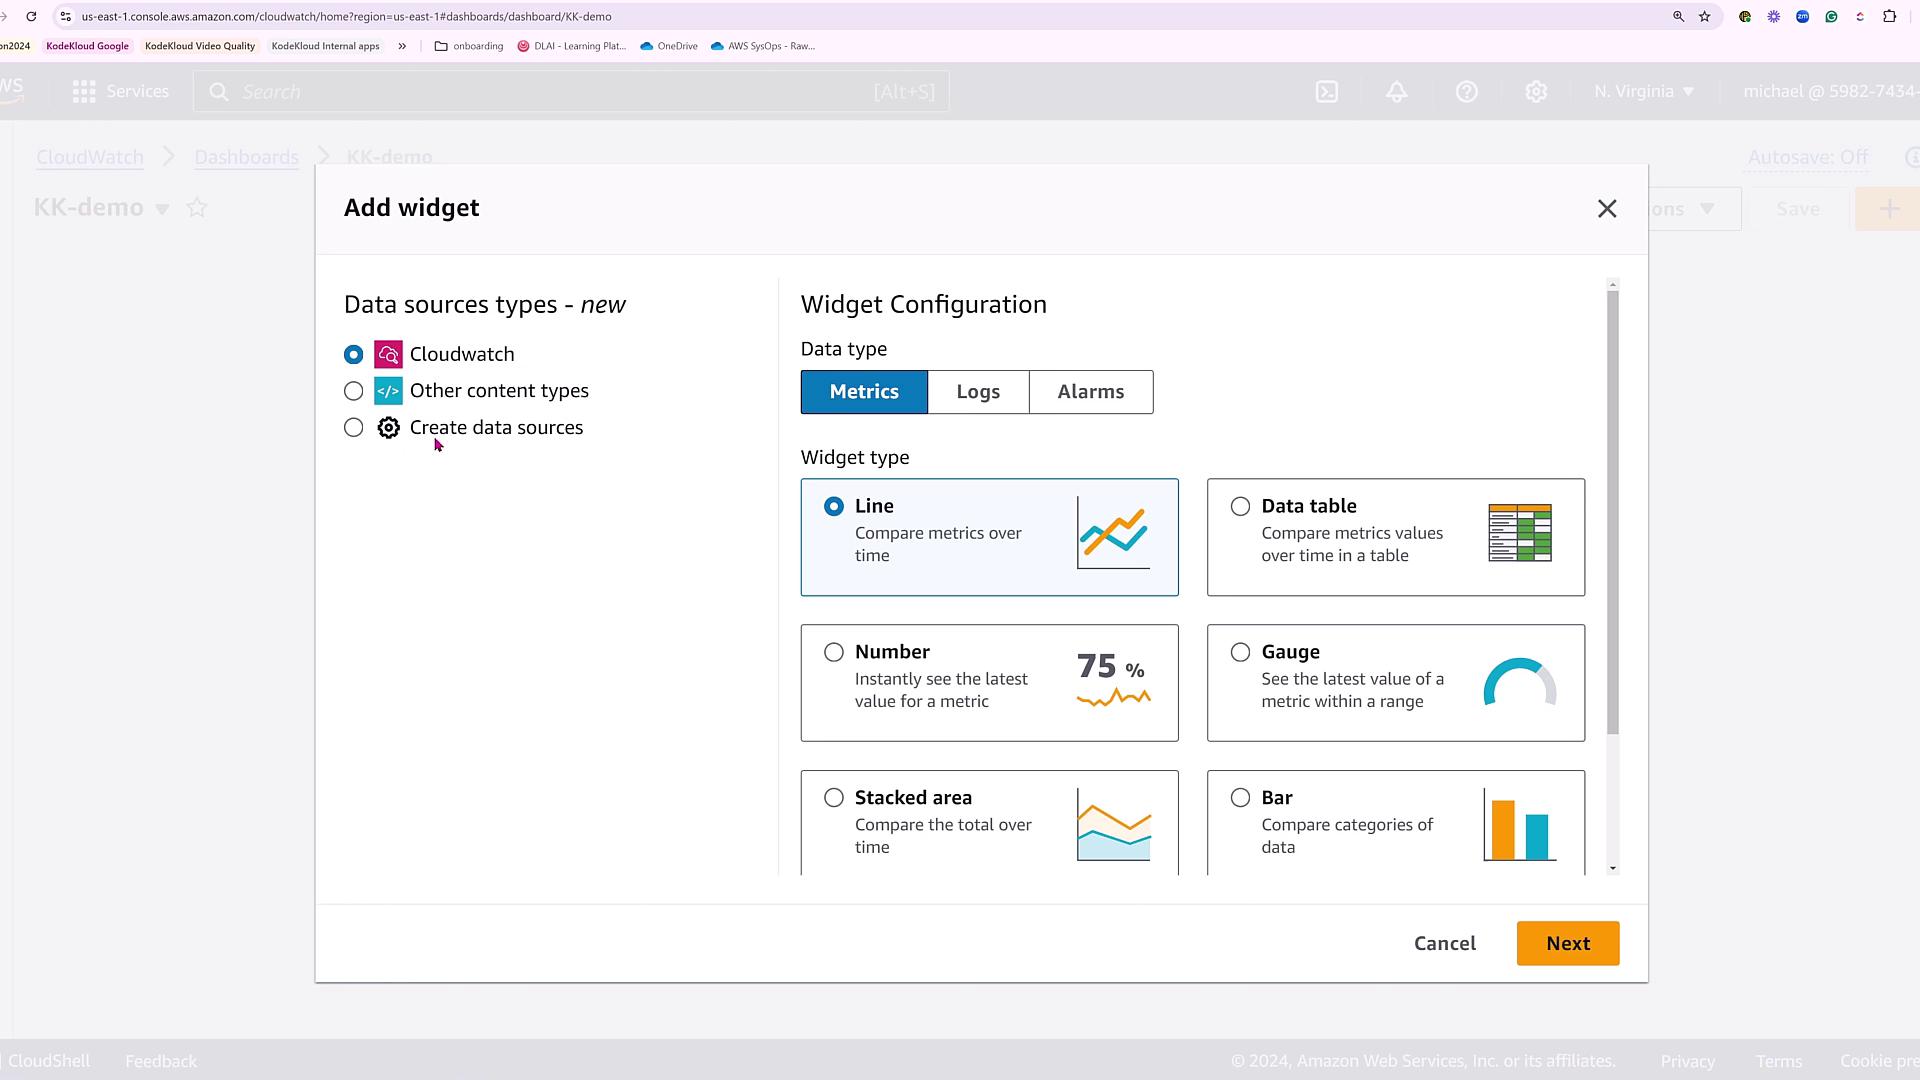
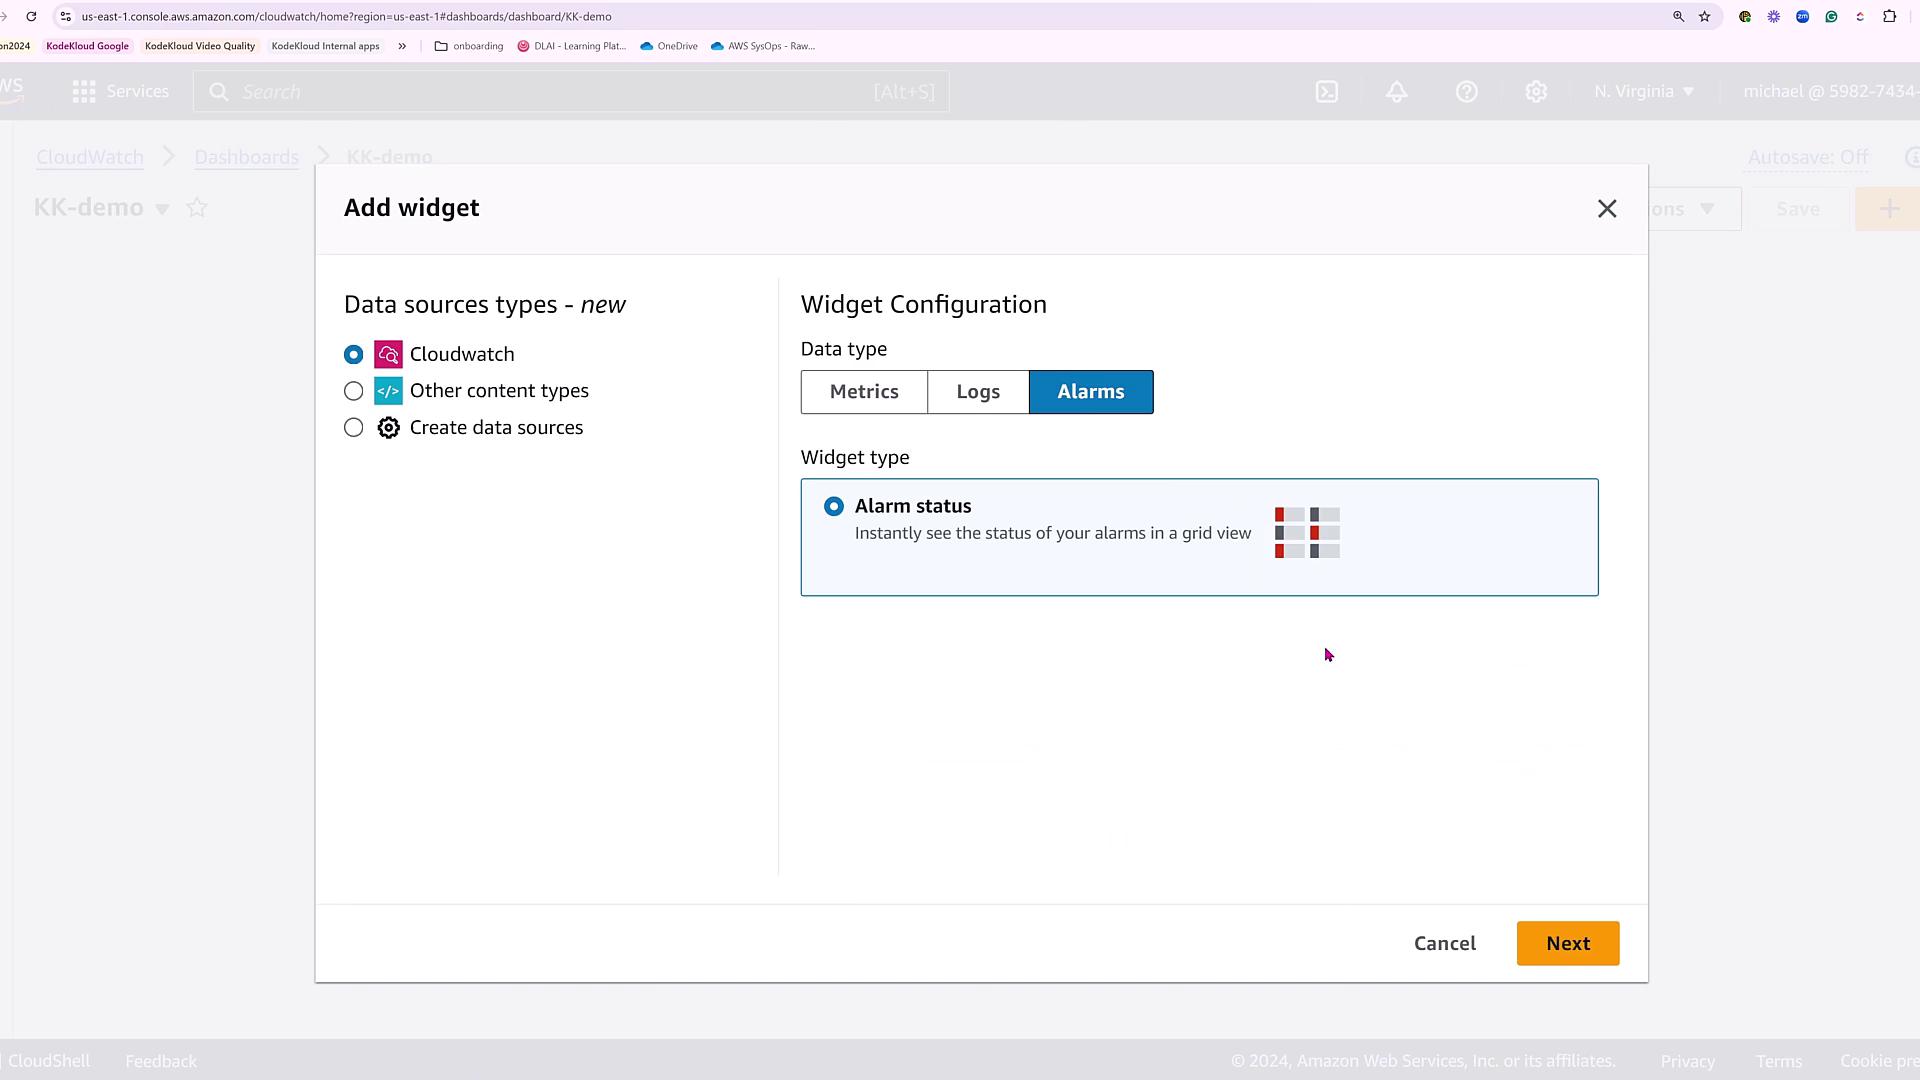
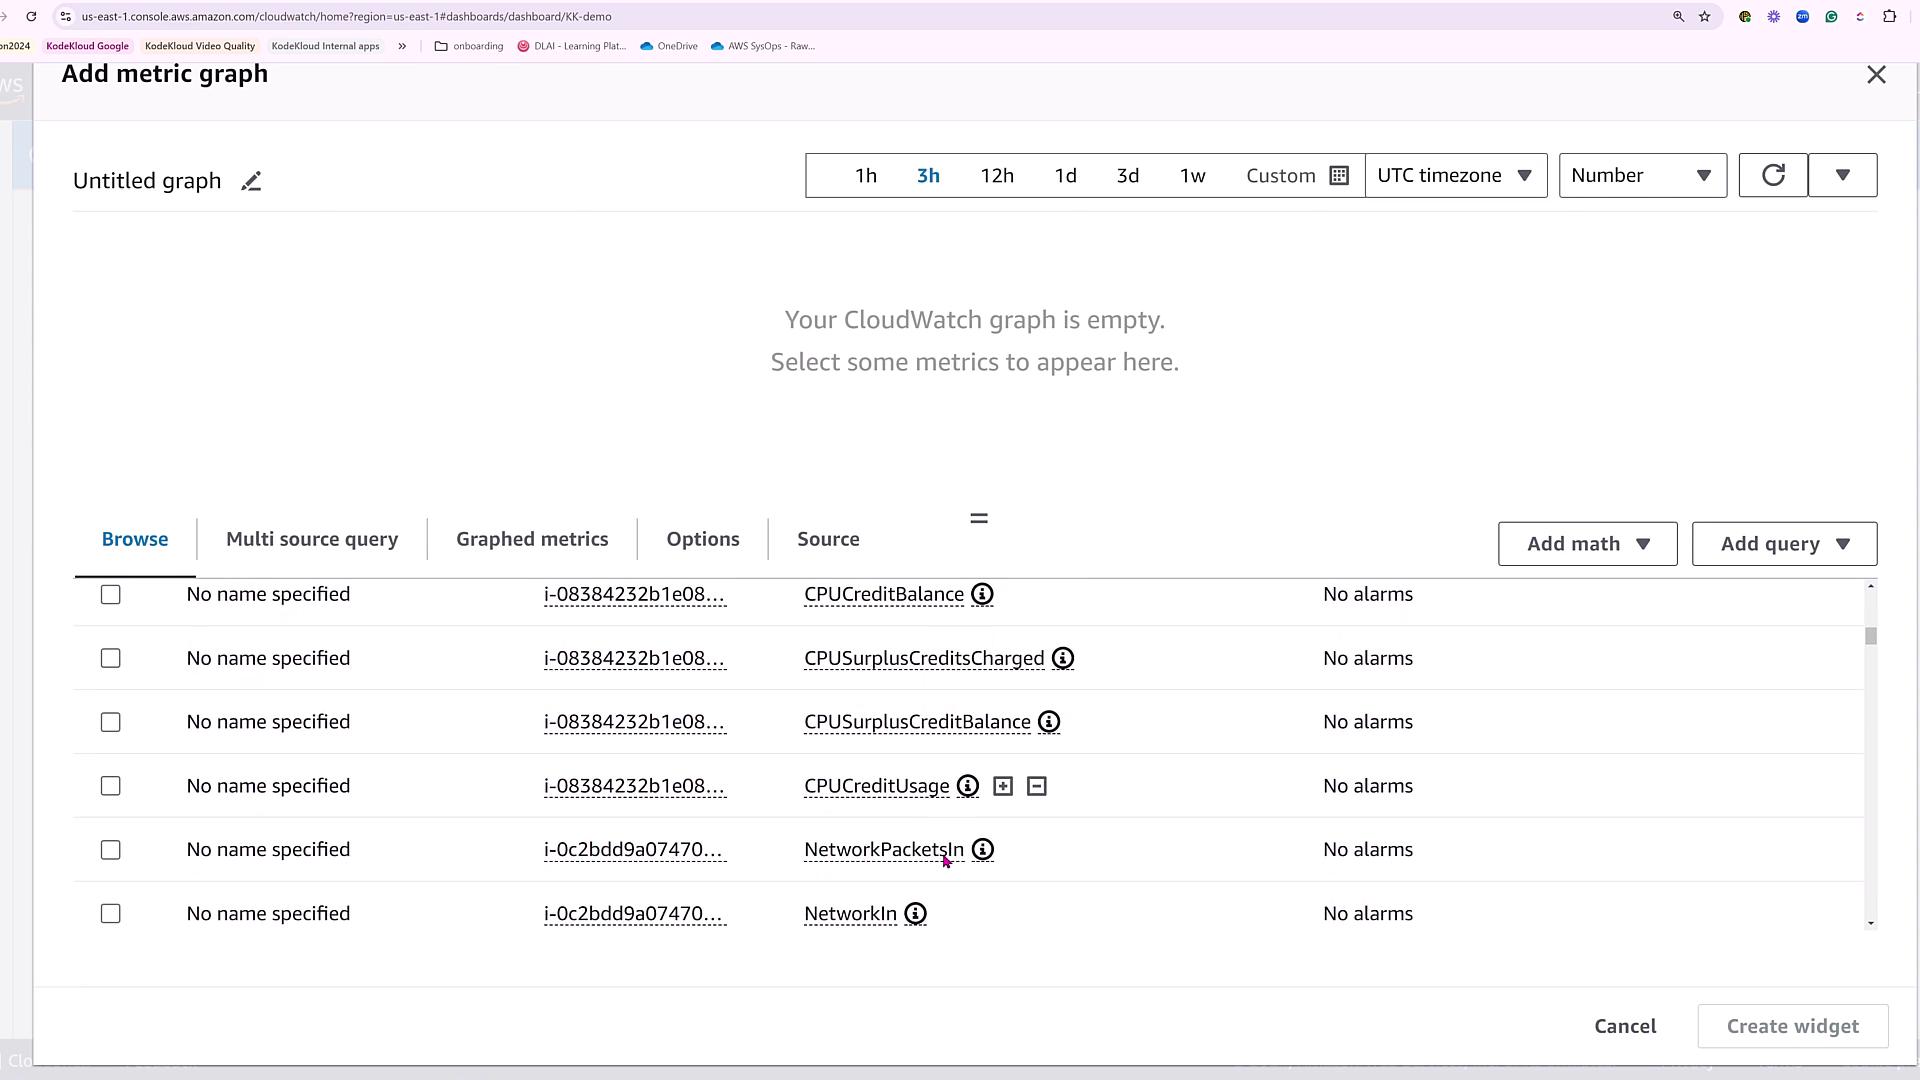
When adding a widget, you have a variety of options. You can choose from eight different widget types for metrics—including line charts, data tables, gauges, bar charts, stacked areas, and pie charts—five options for logs, and one for an alarm status view.
Configuring Alarms
Let's configure an alarm to monitor resource health via an alarm status widget. Although no alarms exist by default, you can easily create one based on a single metric. For instance, if you are monitoring EC2 instances, you might want to trigger an alarm when an instance’s CPU credit balance exceeds a specified threshold—a crucial factor for T-series instances.
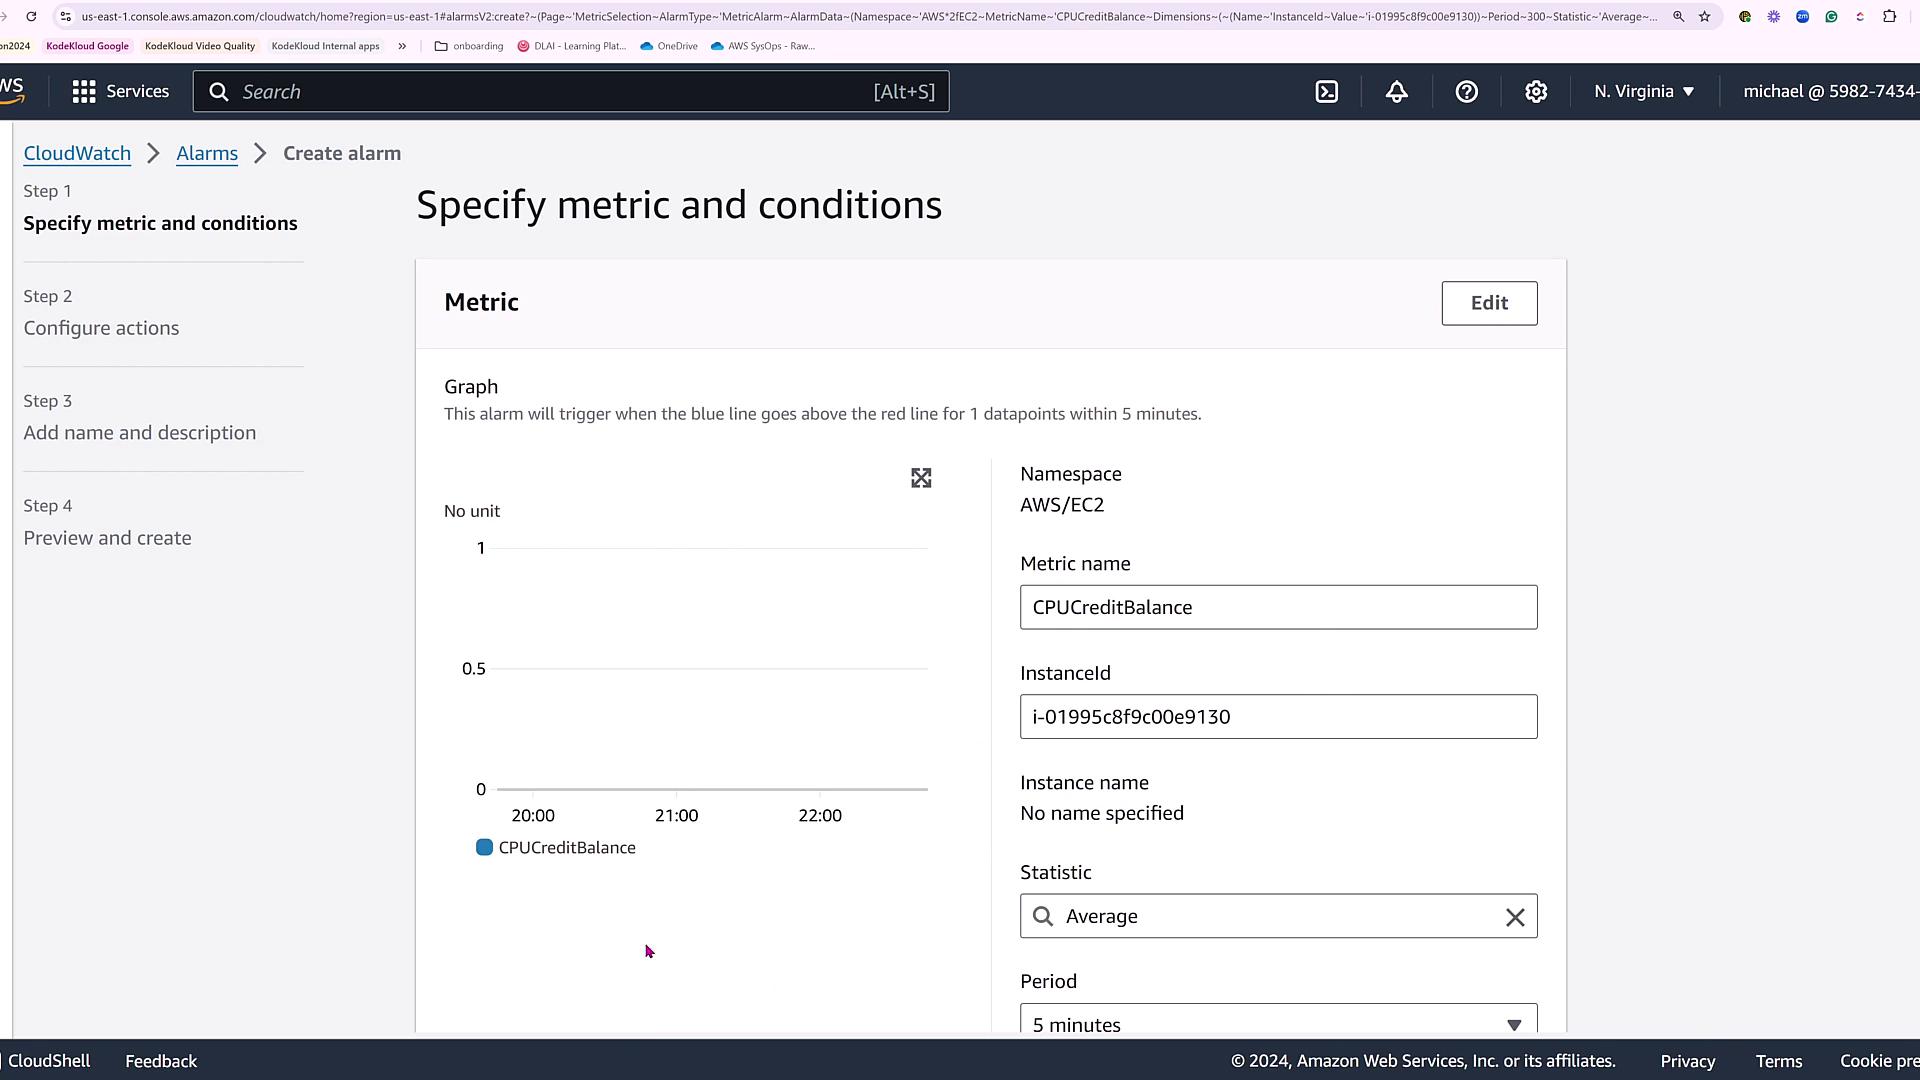
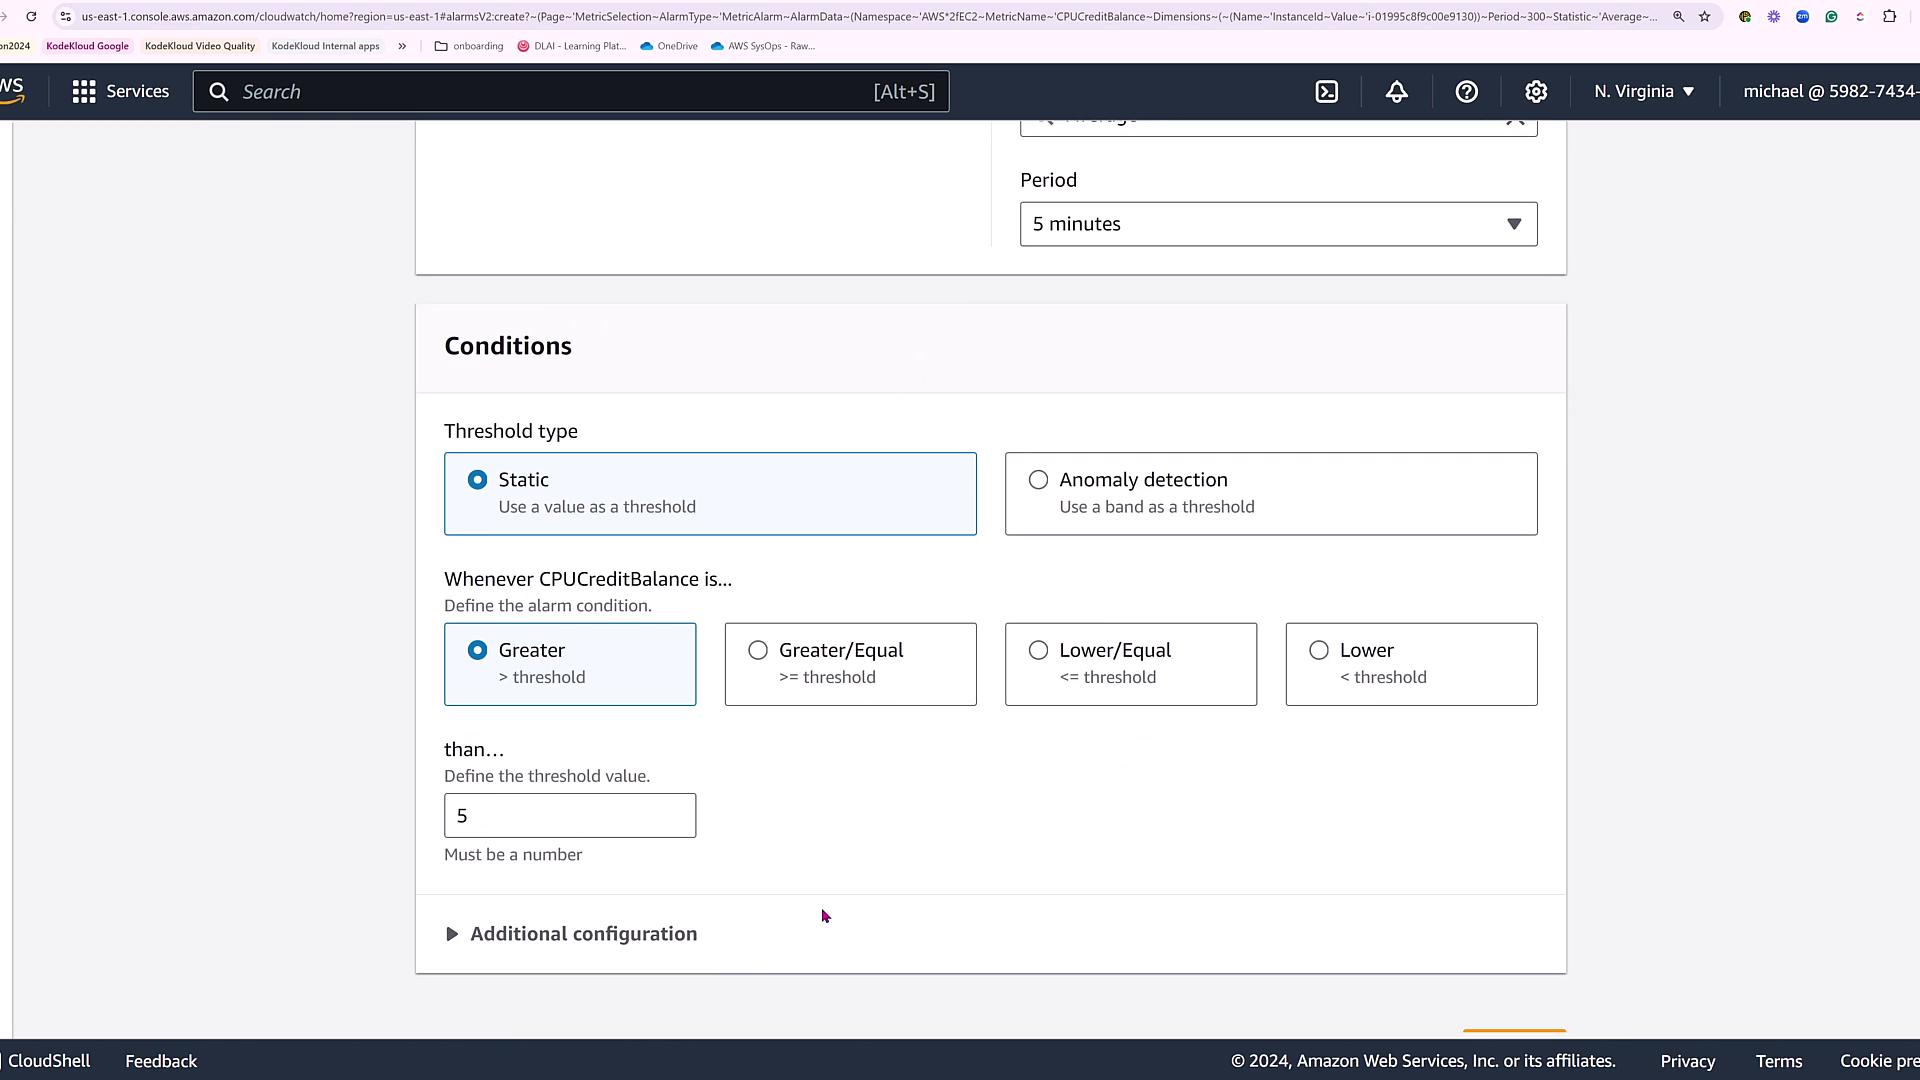
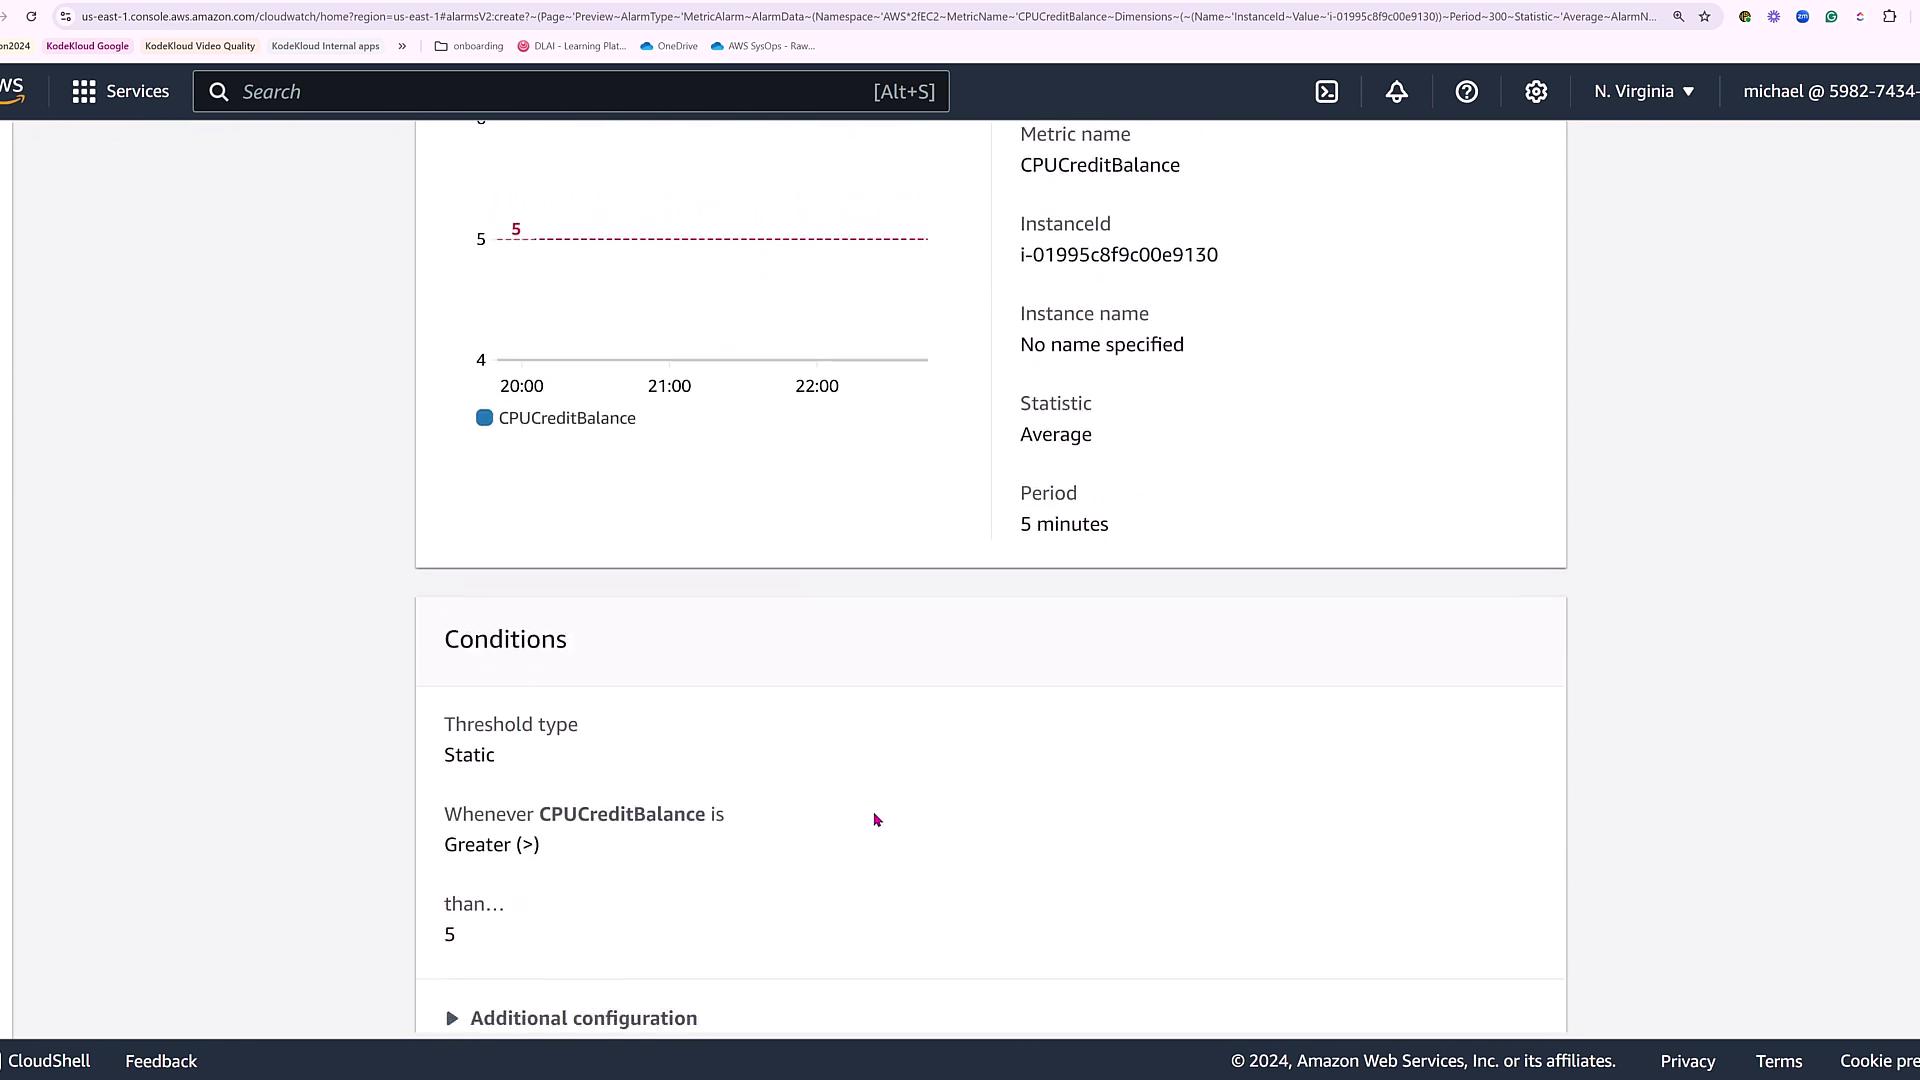
Select the CPU credit balance metric that corresponds to your EC2 instance. You can set an alarm threshold to trigger if the CPU credit balance is greater than, for example, five:
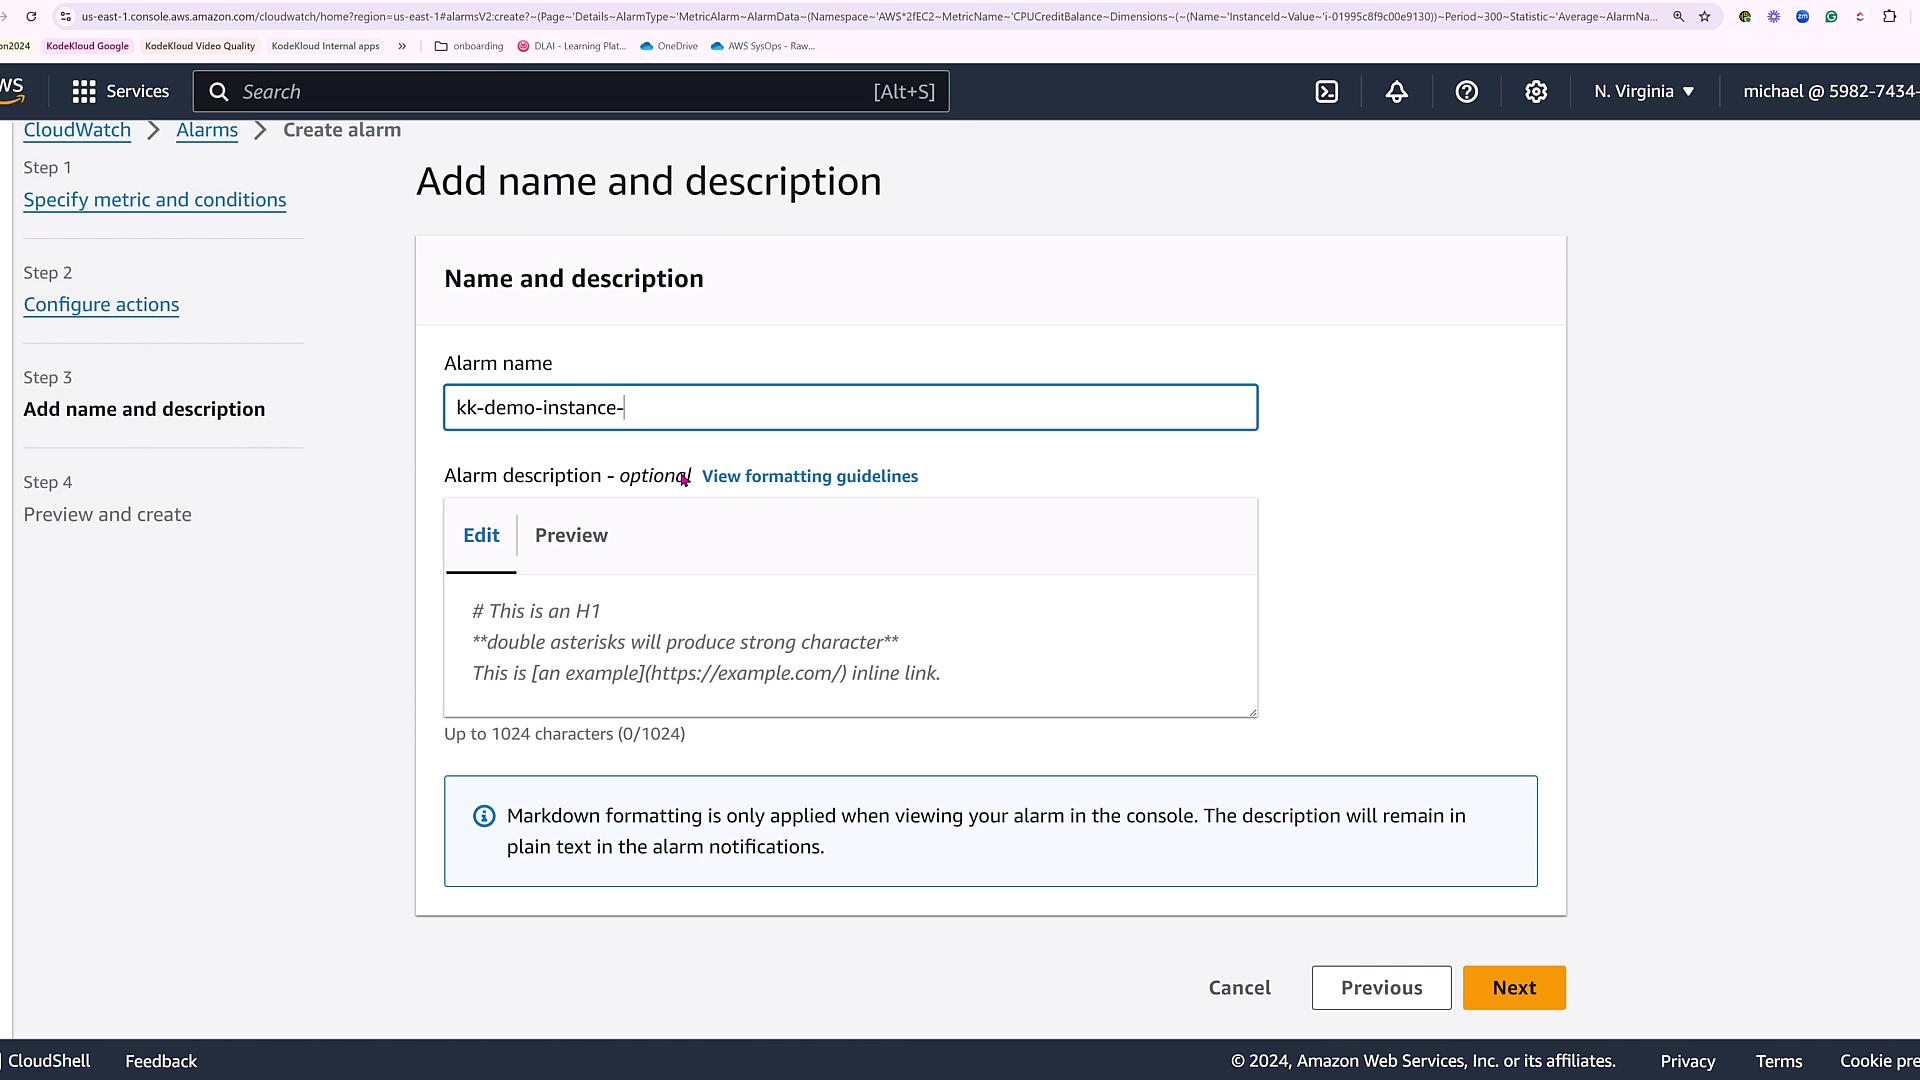
You are not required to add notification actions, Lambda functions, or other advanced configurations for this demonstration. Simply proceed by assigning a name to your alarm (e.g., "Instance alarm for CPU credits"):
The alarm utilizes a static threshold. When the defined condition is met—such as CPU utilization exceeding five—the alarm will trigger. For this demo, no follow-up actions are configured.
Adding Widgets to the Dashboard
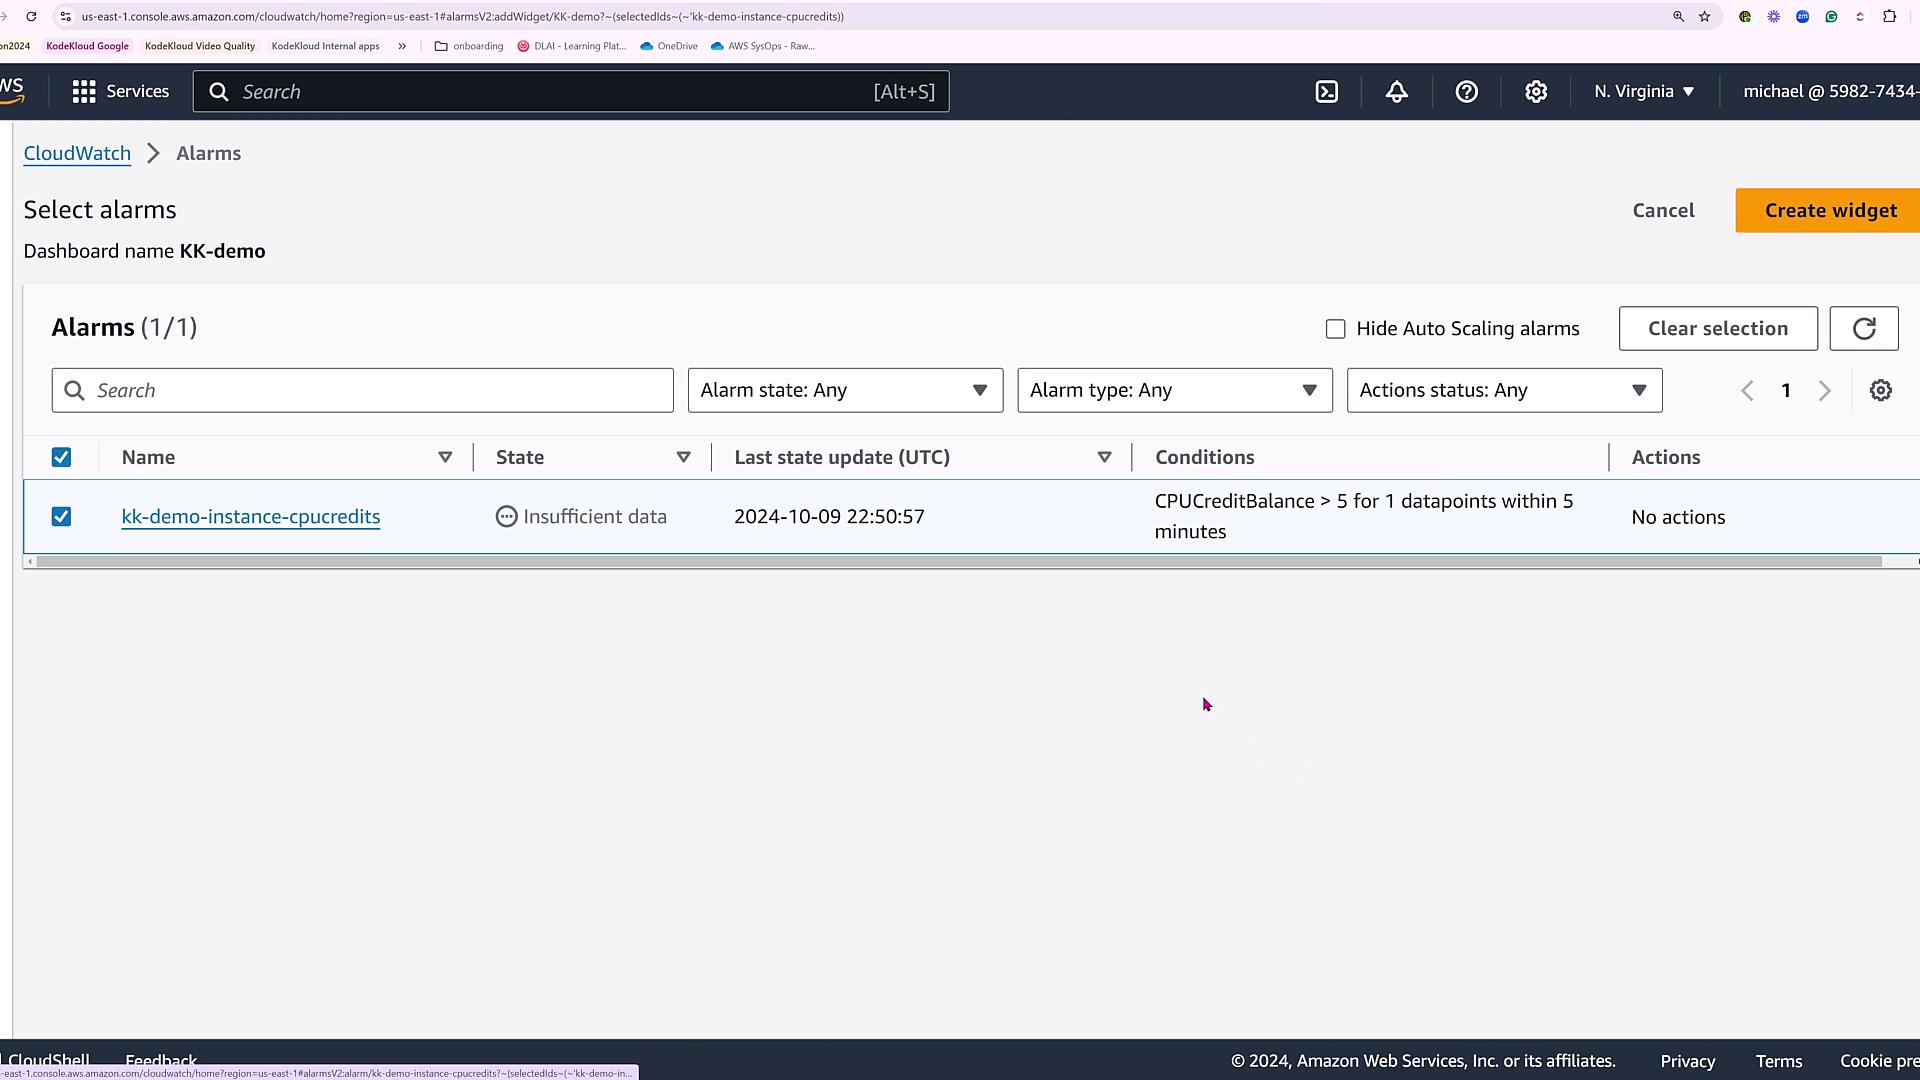
Return to your demo dashboard to start adding widgets. First, include an alarm status widget and select the alarm you just created to display its status.
Next, add another widget for displaying critical metrics. For example, you can use a "Number" widget to illustrate network packets in or out. Note that if no data is available, the widget may appear empty until data starts flowing.
You can also add a gauge widget to monitor metrics like the total write time for a specific EBS volume. After configuring the gauge range (e.g., from 1 to 5), you will observe a real-time visualization of this metric. Hovering over the widget provides additional insights, such as write time per hour.
Viewing Logs
To facilitate log analysis, you can add a logs table widget. In this demonstration, we utilize CloudTrail logs to capture operational events.
Run the following CloudWatch Logs Insights query to list relevant fields, sort the entries by timestamp (in descending order), and limit the output to 10,000 entries:
fields @timestamp, @message, @logStream, @log
| sort @timestamp desc
| limit 10000
Note
Initially, while the query executes and data is collated, the logs widget may not appear immediately. Once the process completes, the widget will display streaming log entries from your chosen log group.
Final Dashboard Overview
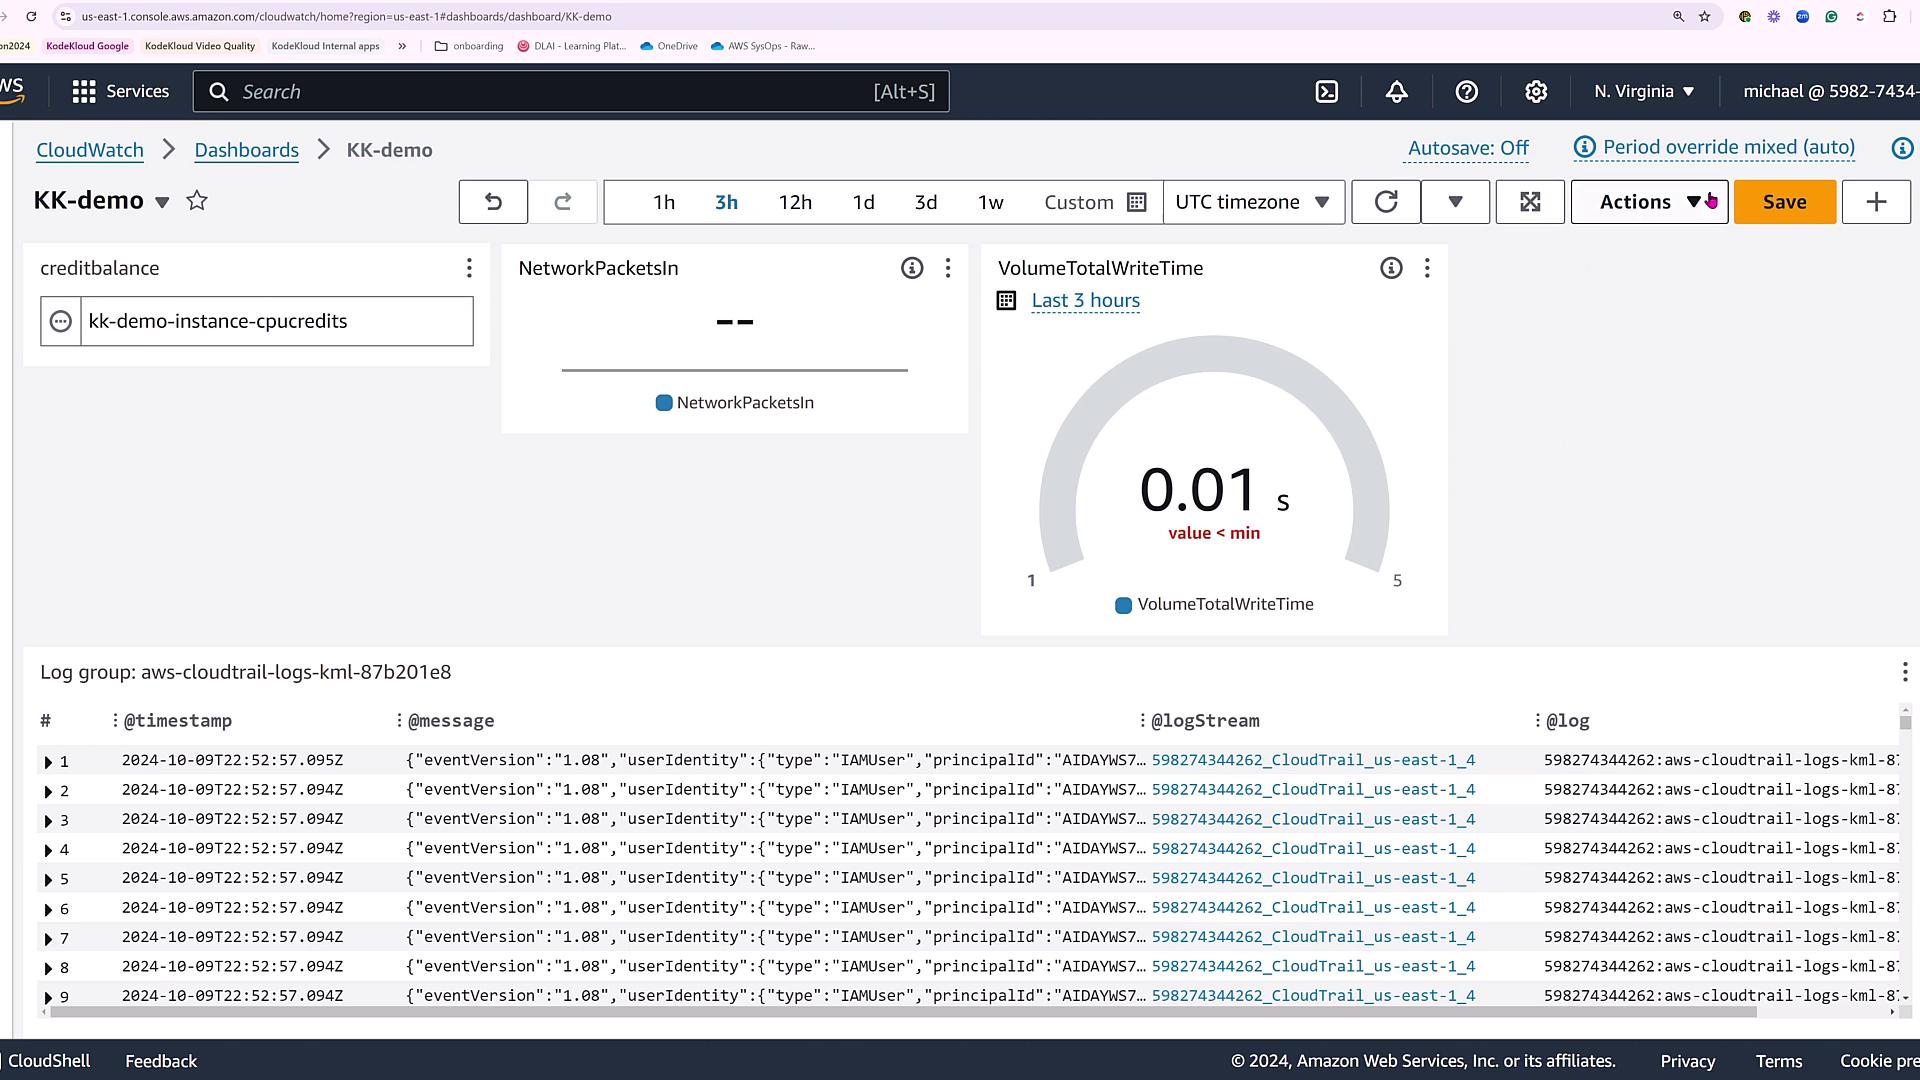
At this stage, your CloudWatch dashboard aggregates multiple widgets, providing a comprehensive view of your system’s performance:
- Alarm status widget for monitoring CPU credit balance.
- A numeric widget displaying key metrics (e.g., network packets).
- A gauge widget tracking EBS volume write time.
- A logs table widget showcasing CloudTrail events.
These widgets collectively provide deep insights into your resources. Additionally, the dashboard supports customizable time ranges, refresh intervals, a full-screen mode, and options to add variables or additional components.
Conclusion
This simple dashboard demonstration highlights several key aspects:
- Integration of multiple data sources into a unified CloudWatch dashboard.
- A variety of widget types available for displaying metrics, logs, and alarms.
- A practical example of setting up a static alarm for monitoring CPU credits.
Tips for Effective Monitoring
Remember, CloudWatch dashboards allow you to link data from various tools, providing comprehensive insights into your AWS environment. Explore the wide range of widget options to tailor your dashboard to your specific monitoring needs.
We hope this lesson has given you a clear understanding of how to build and customize your CloudWatch dashboards. For further details and advanced configurations, check out the AWS CloudWatch Documentation.
Happy monitoring, and see you in the next lesson!
Watch Video
Watch video content