Certified Jenkins Engineer

Code Quality and Testing

Demo SAST Analysis

Perform Static Application Security Testing (SAST) on your JavaScript (Node.js) code using SonarQube. We assume SonarQube is running at http://<host>:9000.

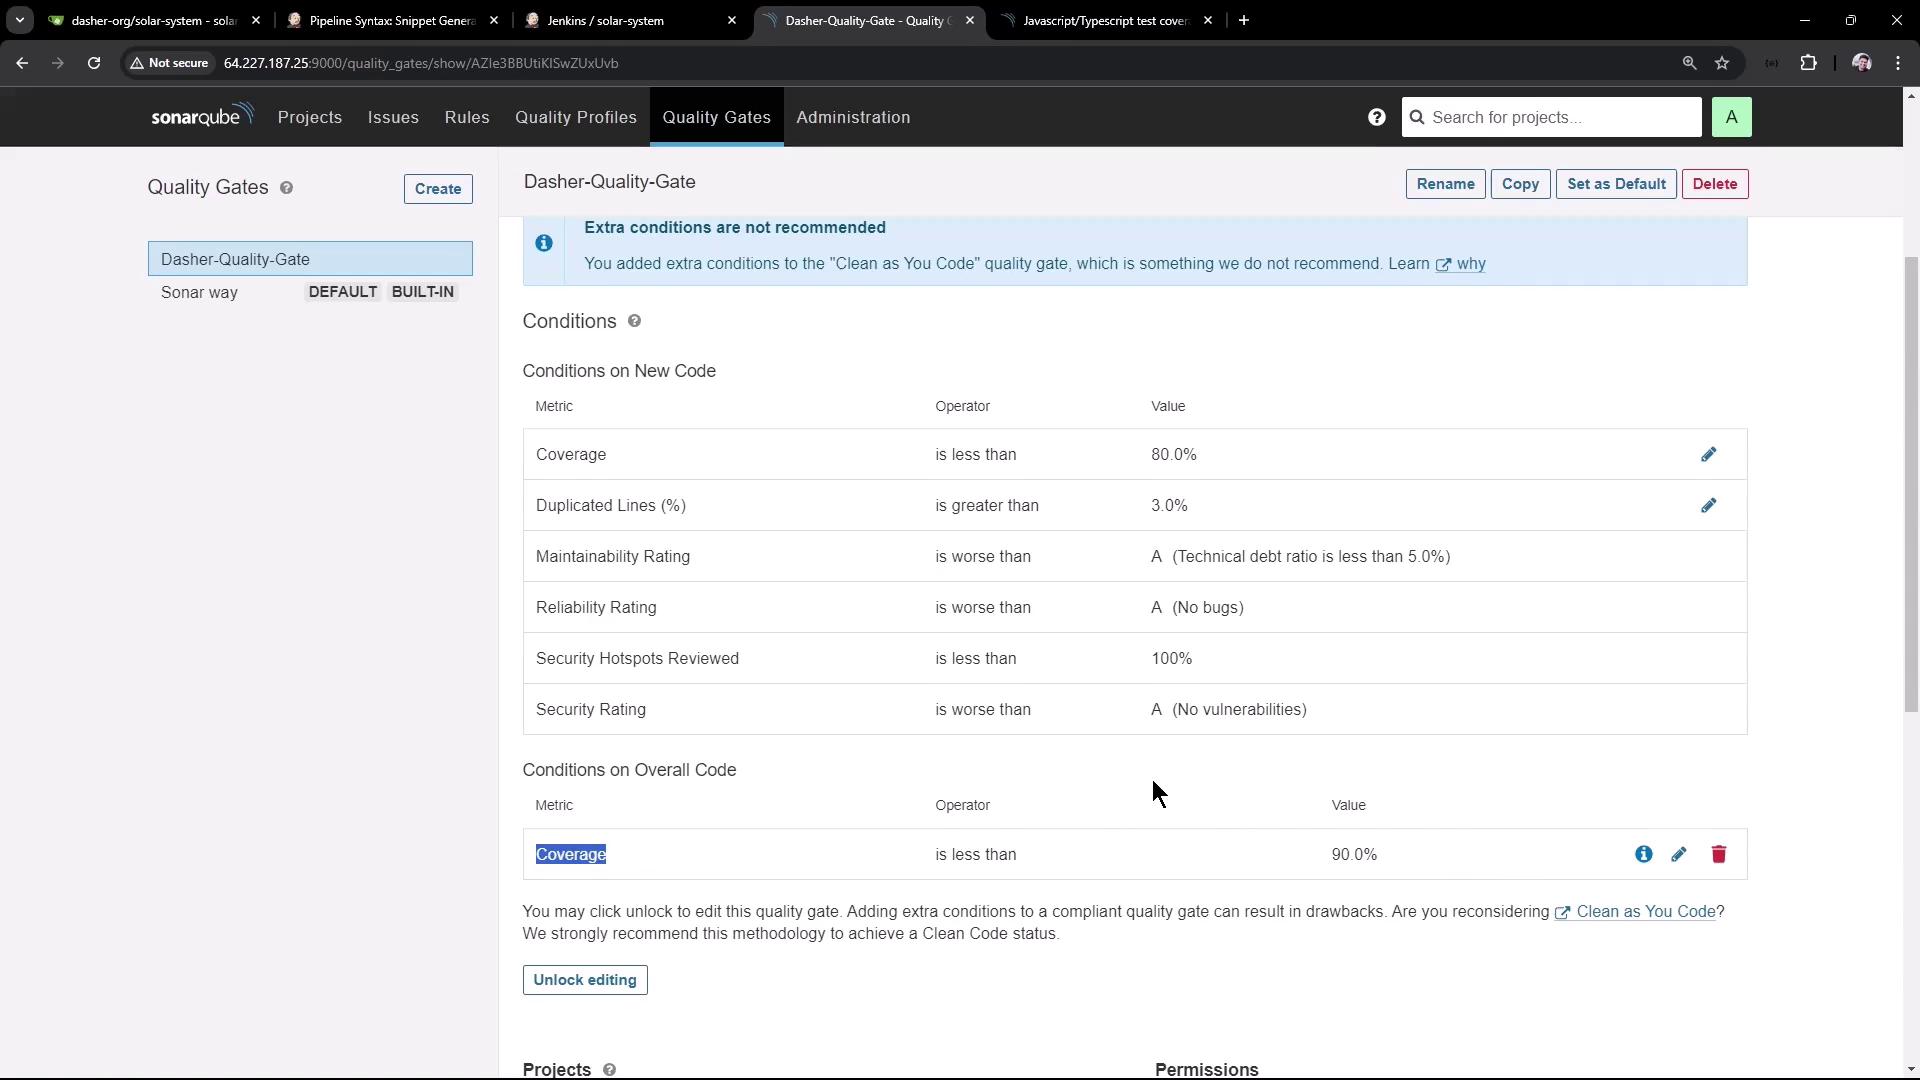
1. Configure the Default Quality Gate

  1. Log in to SonarQube and navigate to Quality Gates.
  2. Select Dasher-Quality-Gate and click Set as default.
  3. Verify the key condition: Overall Coverage < 90%.

Note

Quality Gates enforce your code quality standards automatically. Failing criteria (e.g., coverage, duplications, maintainability) will mark the gate as failed.

The image shows a SonarQube interface displaying a quality gate configuration named "Dasher-Quality-Gate," with conditions for code metrics like coverage, duplicated lines, and maintainability. It includes a warning about adding extra conditions to the "Clean as You Code" quality gate.

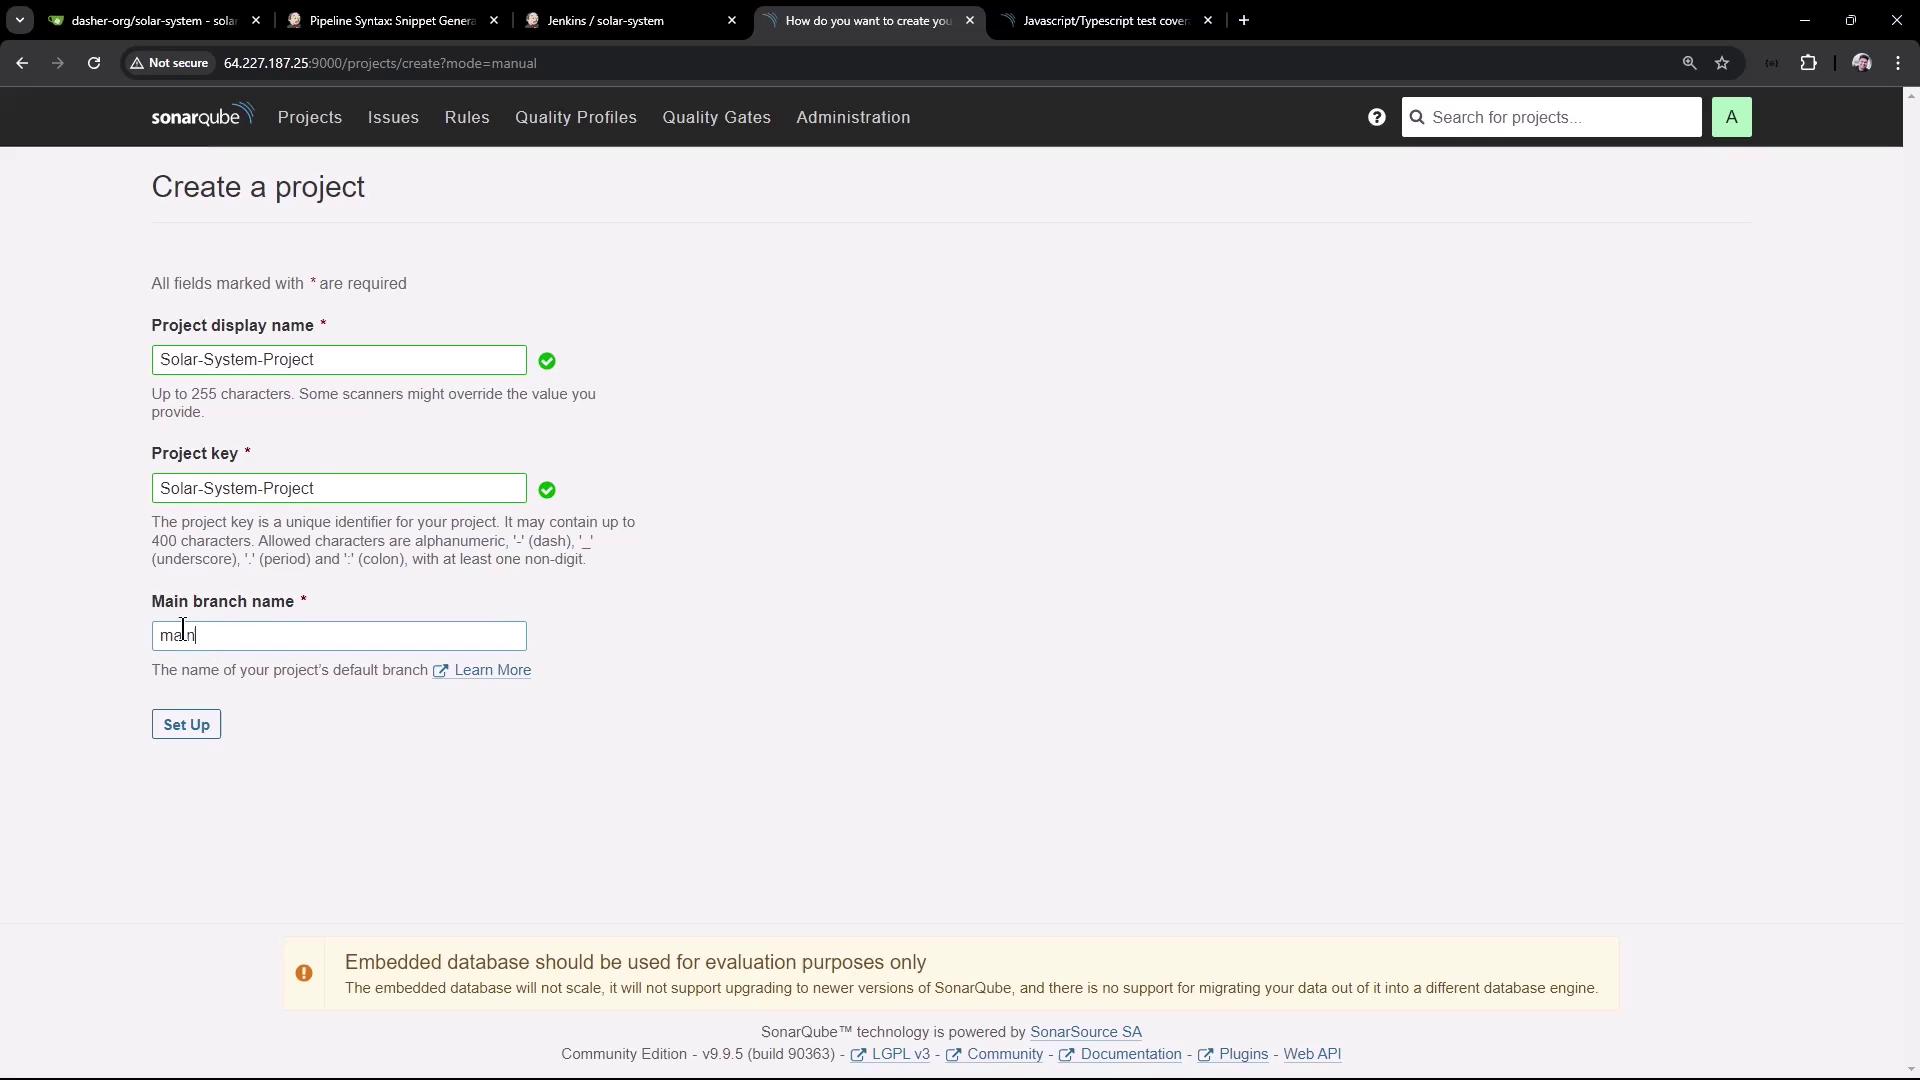
2. Create a New Project

2.1. Define Project Basics

  1. Click Create ProjectManually.
  2. Fill in the form:
    • Project Display Name: Solar-System-Project
    • Project Key: Solar-System-Project
    • Main Branch Name: main

The image shows a SonarQube interface for creating a new project, with fields for project display name, project key, and main branch name. The project is named "Solar-System-Project."

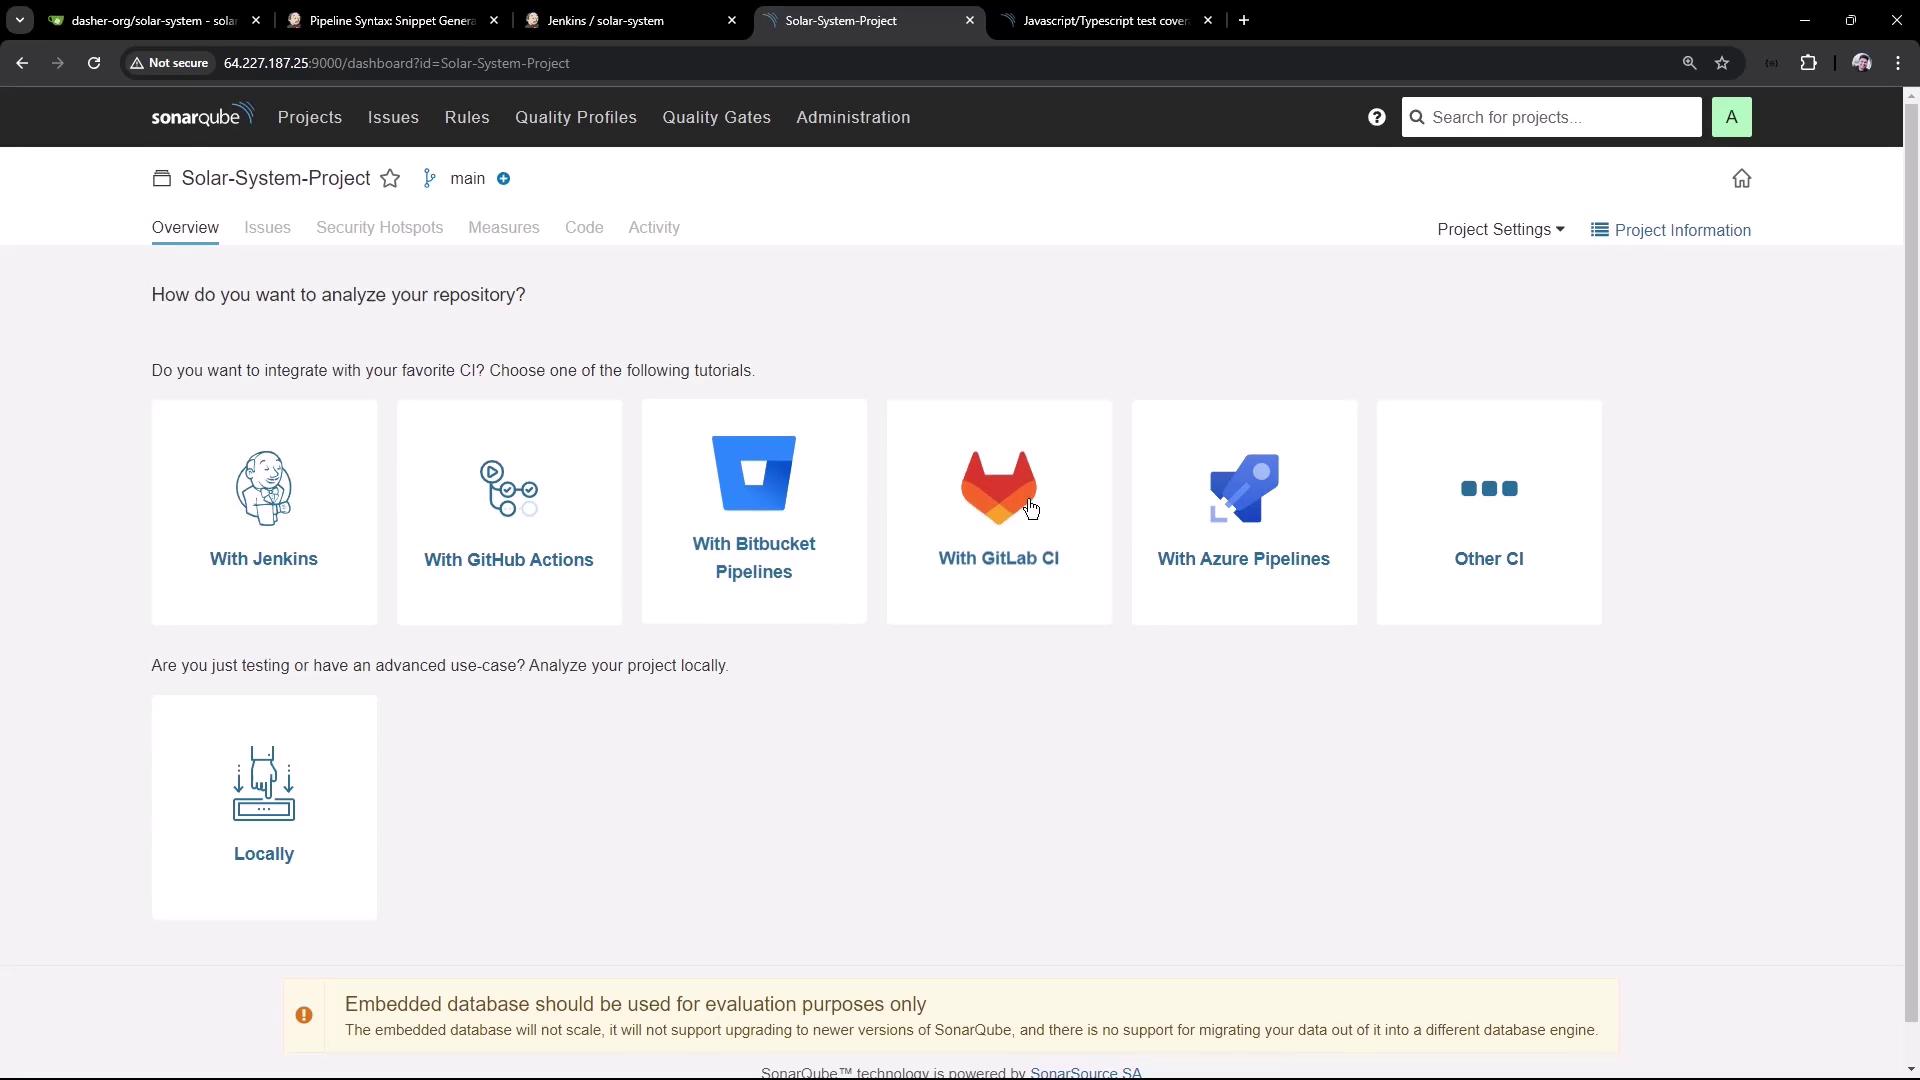
2.2. Select Technology and OS

  • Under Technology, choose Other.
  • For Operating System, select Linux.

The image shows a SonarQube dashboard for a project named "Solar-System-Project," offering integration options with various CI tools like Jenkins, GitHub Actions, and GitLab CI. There is also a note about the embedded database being for evaluation purposes only.

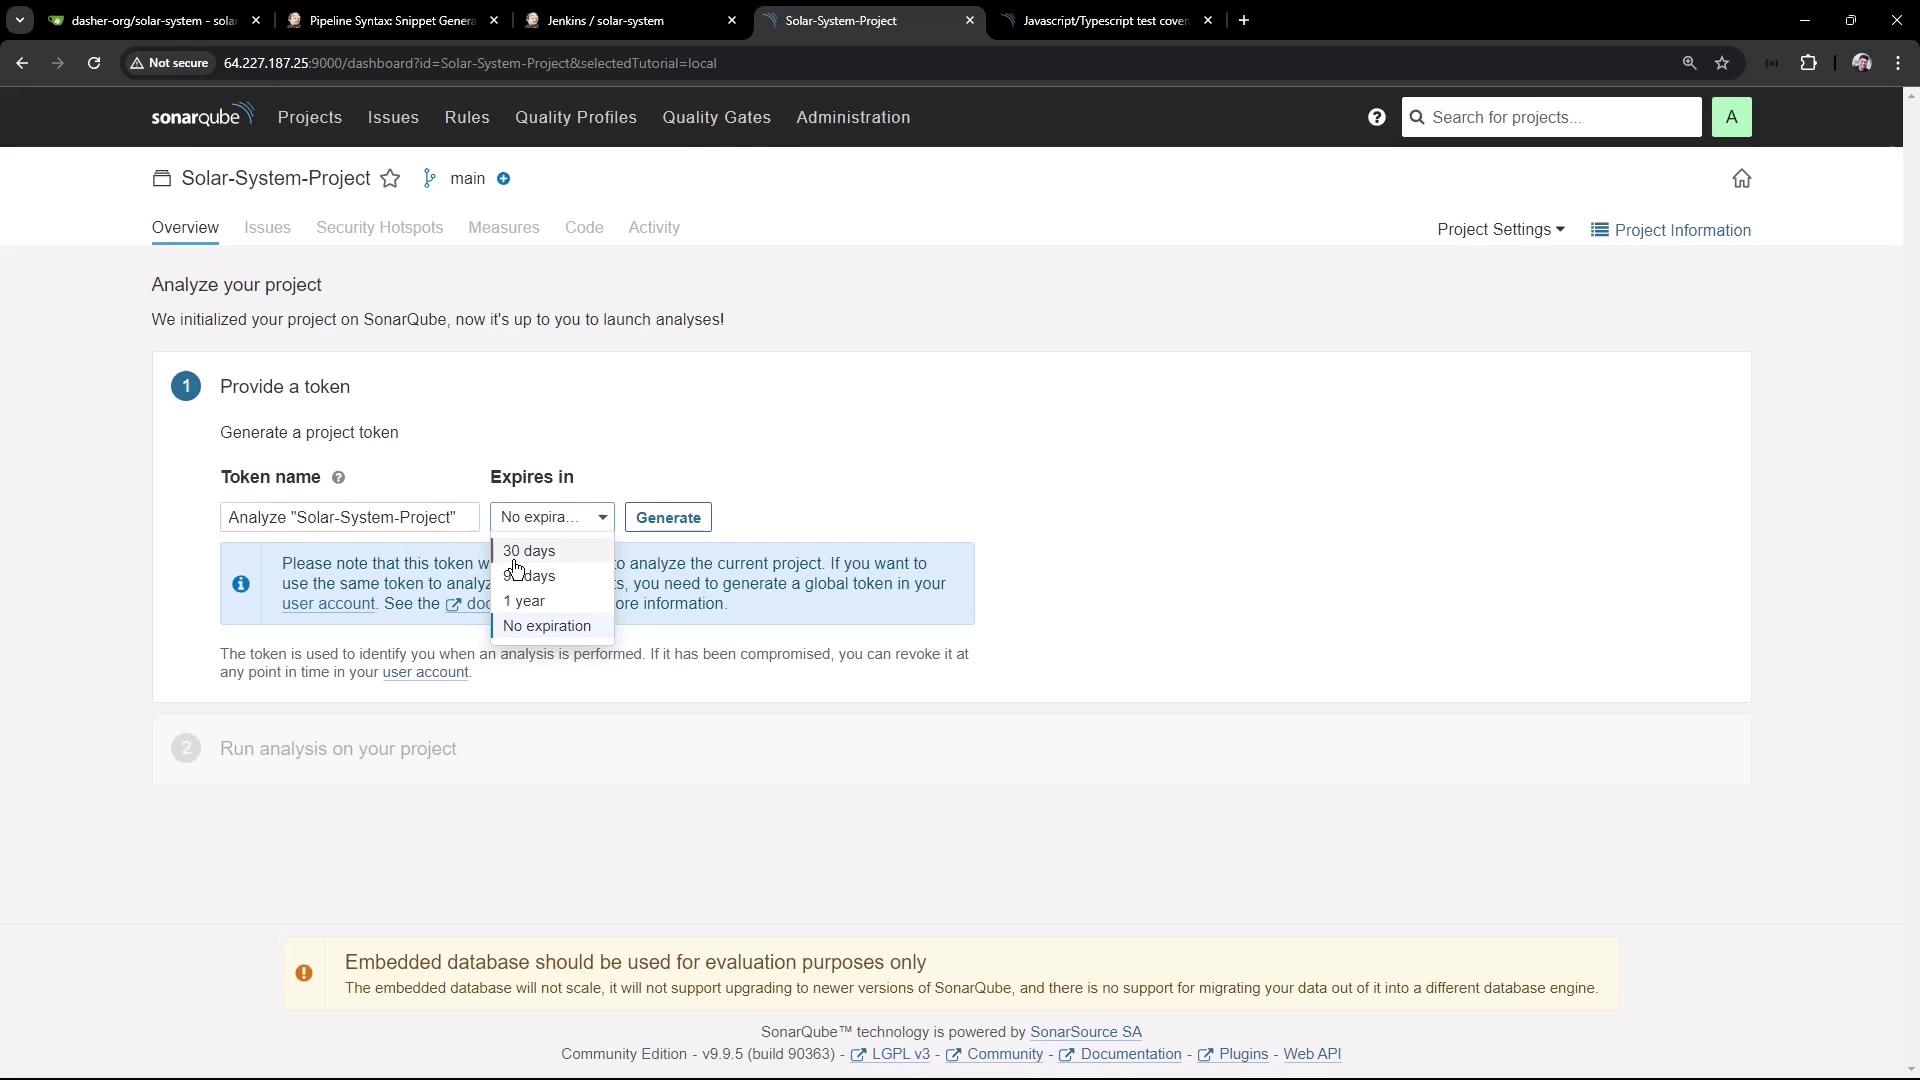
2.3. Generate an Authentication Token

  1. In the project dashboard, click Generate Token.
  2. Provide a name and select No expiration (for demo only).

Warning

Avoid using tokens without expiration in production. Rotate your tokens regularly.

The image shows a SonarQube dashboard for a project named "Solar-System-Project," where a token is being generated for project analysis. There is a dropdown menu for setting the token expiration, with options like 30 days, 1 year, and no expiration.

3. Local Analysis with sonar-scanner

Install the SonarQube Scanner locally or via your package manager. Then run:

sonar-scanner \
  -Dsonar.projectKey=Solar-System-Project \
  -Dsonar.sources=. \
  -Dsonar.host.url=http://<host>:9000 \
  -Dsonar.login=<YOUR_TOKEN>

4. Jenkins Pipeline Configuration

Integrate SAST into your CI by adding a SonarQube stage to your Jenkinsfile:

pipeline {
  agent any
  environment {
    SONAR_SCANNER_HOME = tool 'sonarqube-scanner-6.1.0'
  }
  stages {
    stage('Installing Dependencies')   { steps { /* ... */ } }
    stage('Dependency Scanning')      { steps { /* ... */ } }
    stage('Unit Testing')             { steps { /* ... */ } }
    stage('Code Coverage')            { steps { /* ... */ } }
    stage('SAST - SonarQube') {
      steps {
        sh 'echo $SONAR_SCANNER_HOME'
        sh """
          $SONAR_SCANNER_HOME/bin/sonar-scanner \
            -Dsonar.projectKey=Solar-System-Project \
            -Dsonar.sources=app.js \
            -Dsonar.host.url=http://<host>:9000 \
            -Dsonar.login=<YOUR_TOKEN>
        """
      }
    }
  }
}

For more options, see the Jenkins Pipeline Syntax guide.

5. Installing SonarScanner in Jenkins
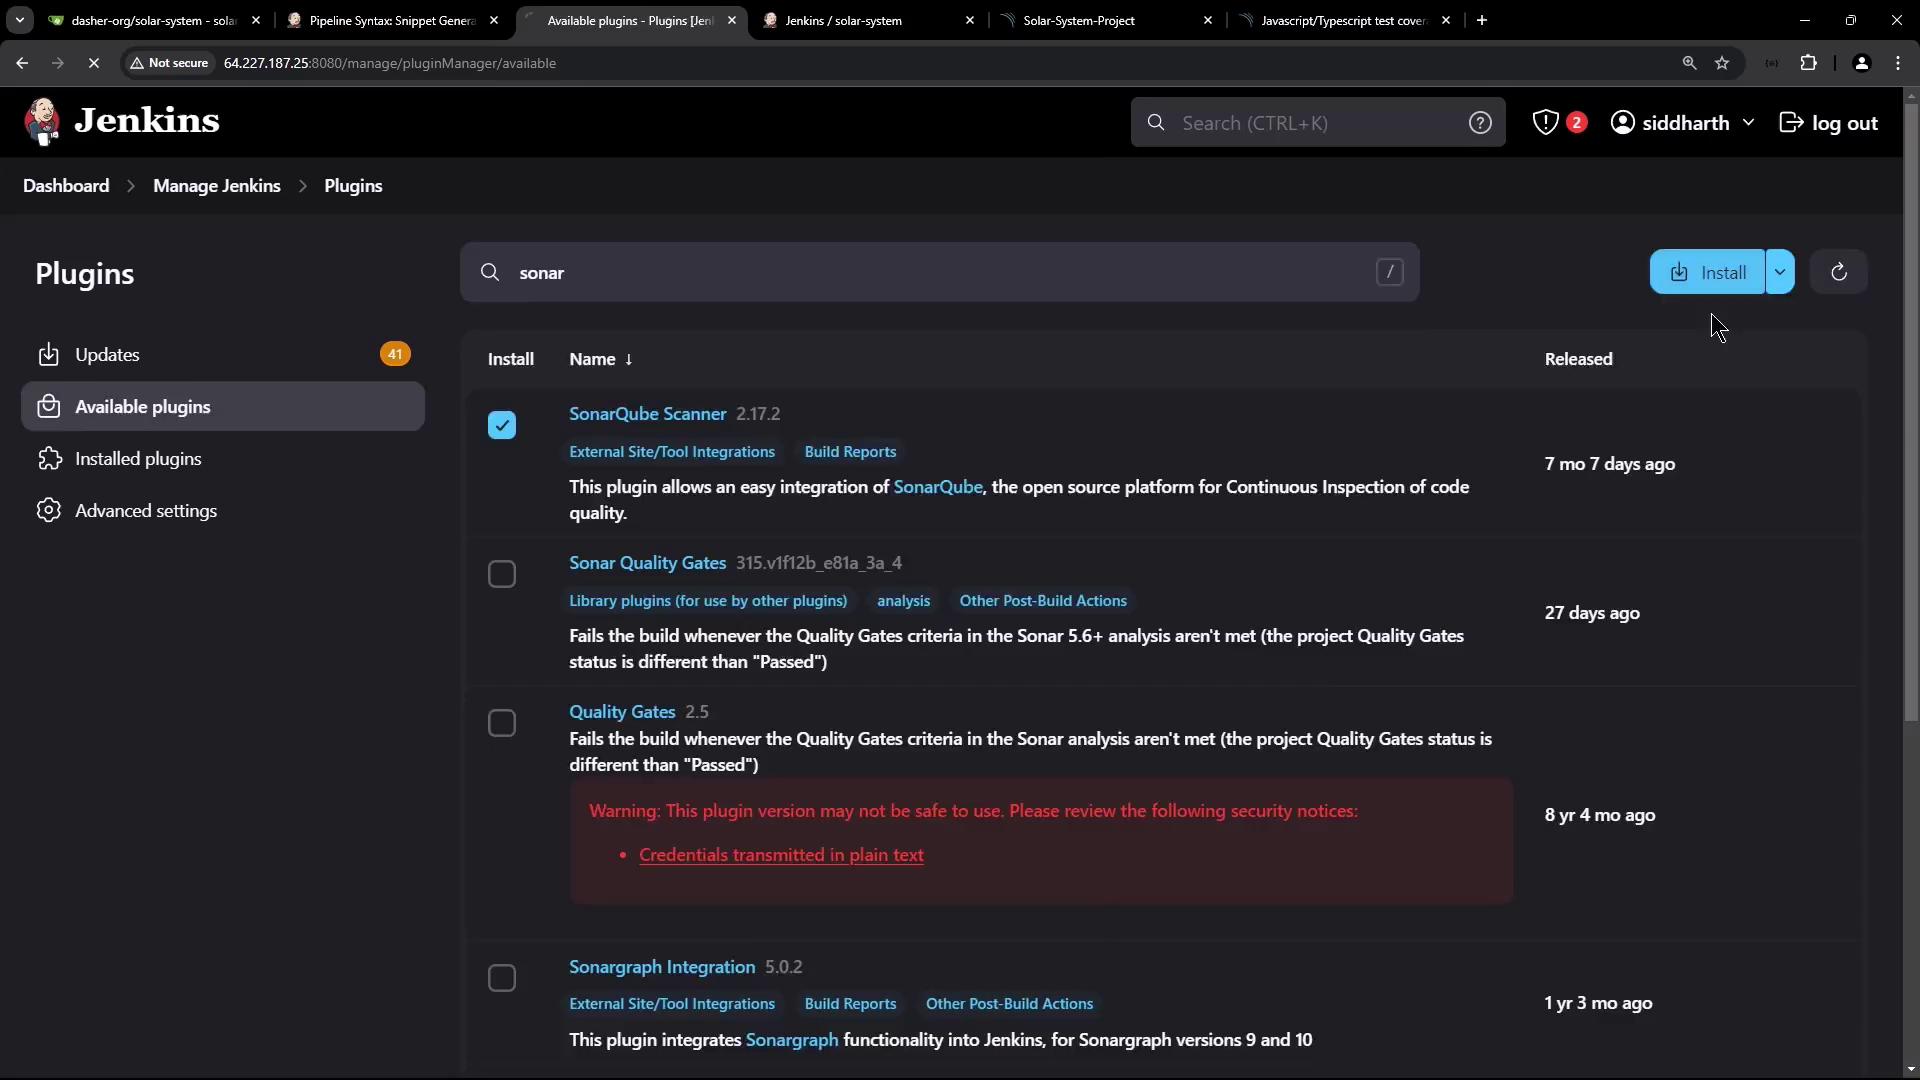
  1. Go to Manage JenkinsManage Plugins.
  2. Under Available, search for
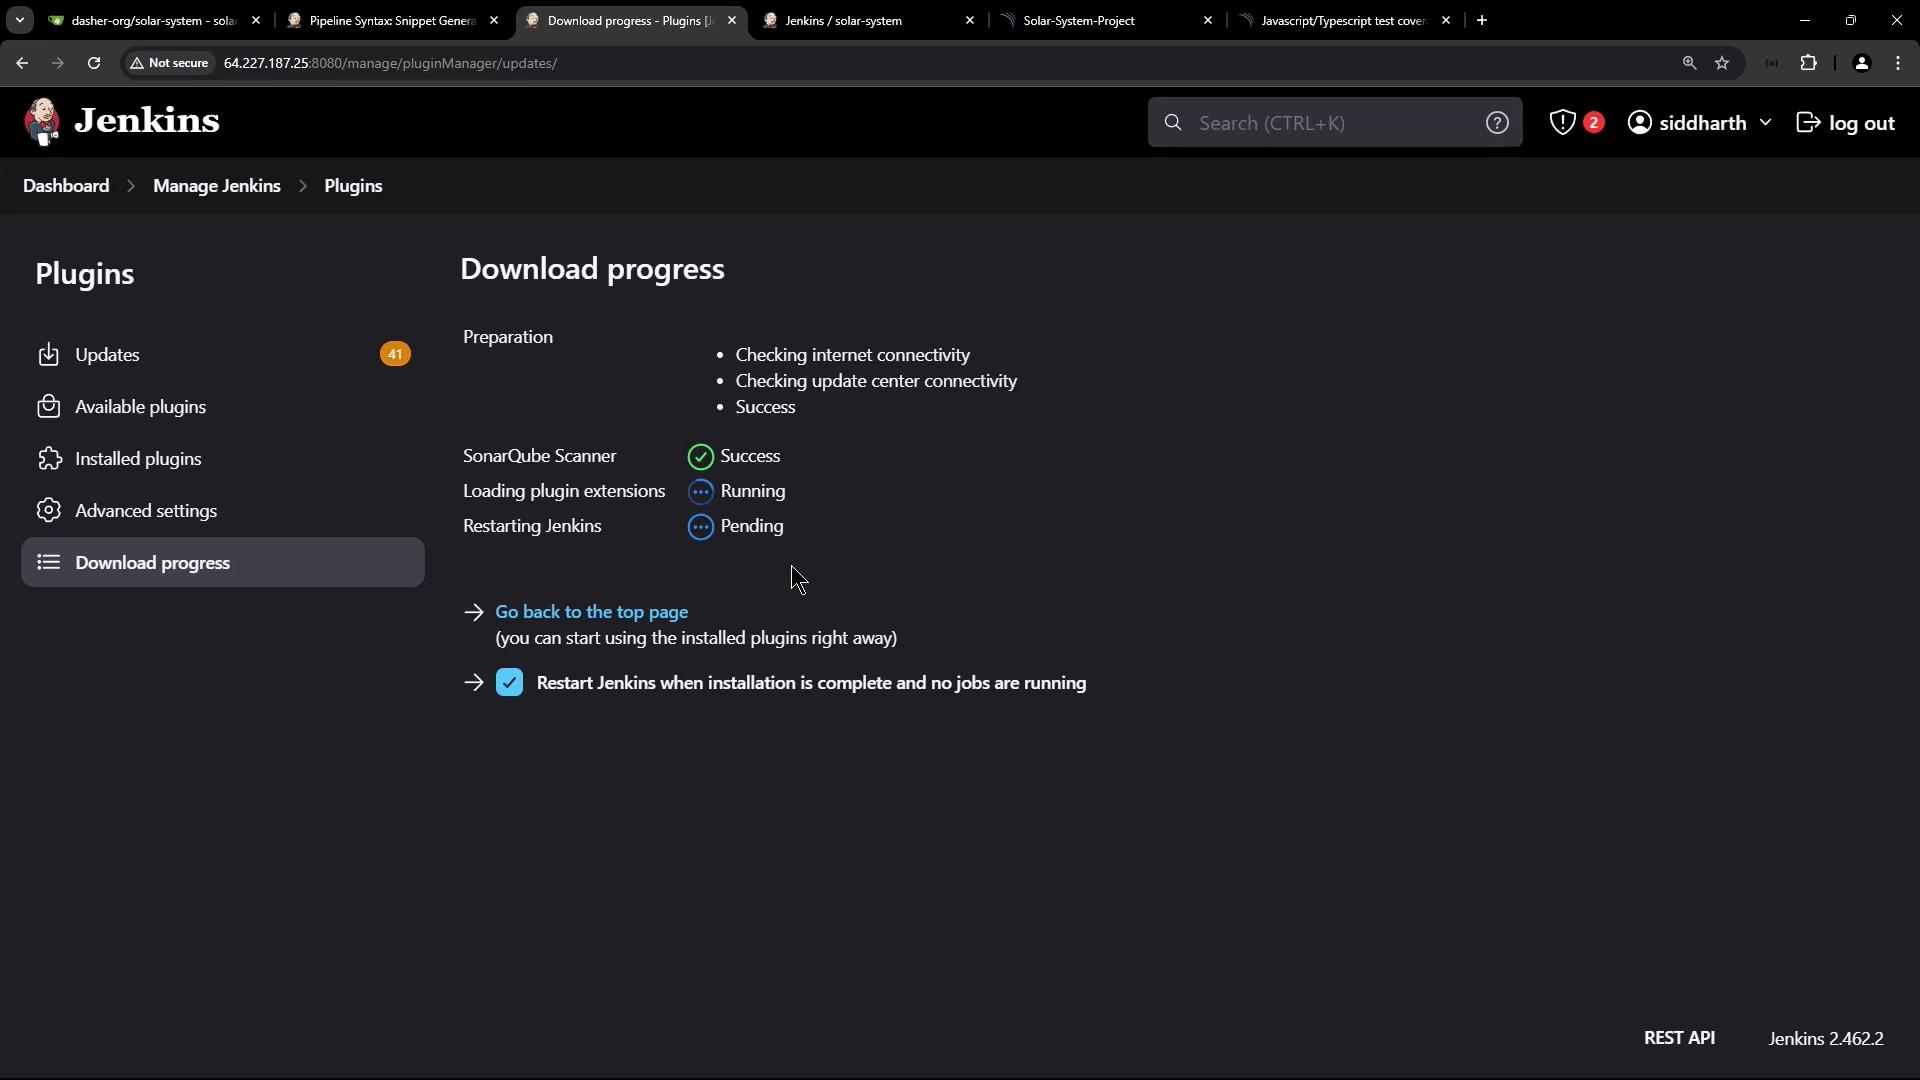
 sonar and install SonarQube Scanner. Restart Jenkins.

The image shows the Jenkins plugin management interface, specifically the "Available plugins" section, with a search for "sonar" displaying plugins like SonarQube Scanner and Sonar Quality Gates.

The image shows a Jenkins interface displaying the download progress of plugins, with statuses for SonarQube Scanner and other tasks.

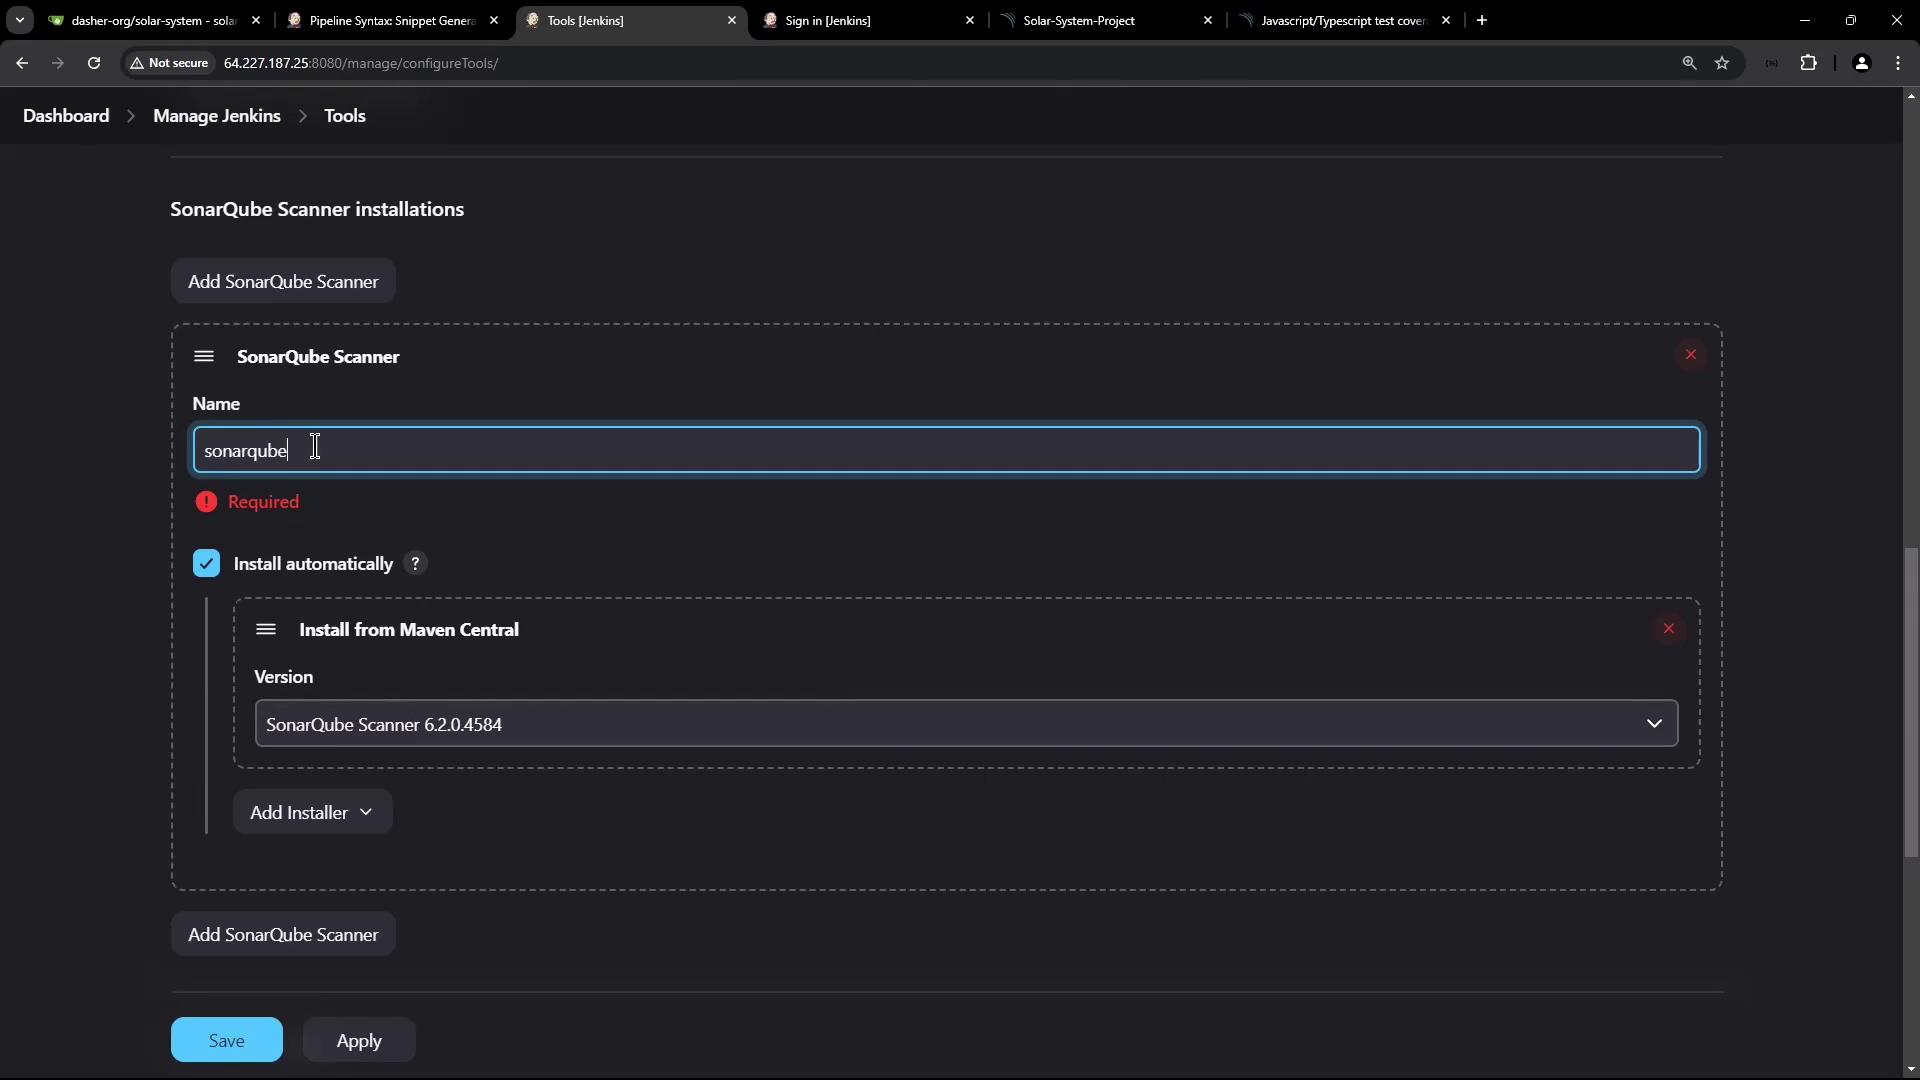
  1. After restart, navigate to Manage JenkinsGlobal Tool ConfigurationSonarQube Scanner.
    • Name: sonarqube-scanner-6.1.0
    • Select Install automatically from Maven Central

The image shows a Jenkins configuration screen for adding a SonarQube Scanner installation, with options to set the name and version, and an "Install automatically" checkbox selected.

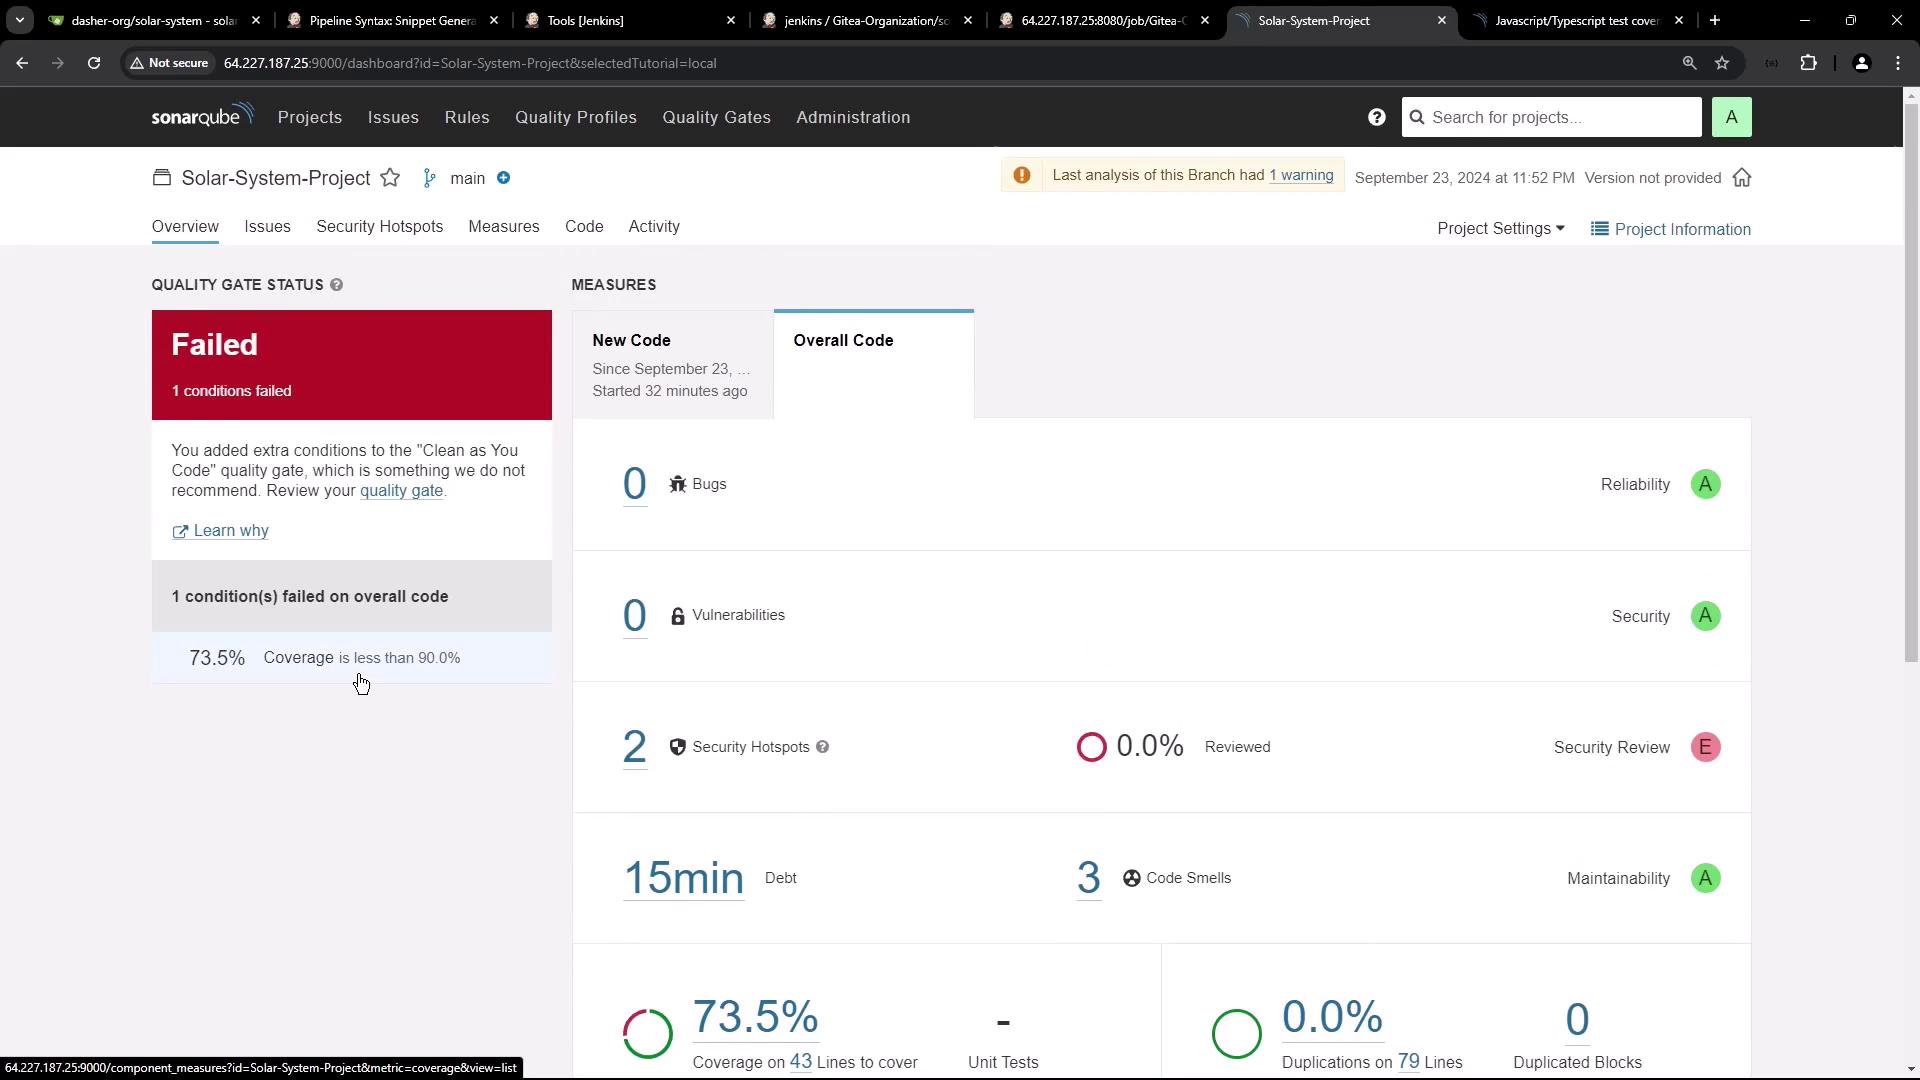
6. First SonarQube Analysis Result

Run your Jenkins pipeline. After it completes, refresh SonarQube:

ANALYSIS SUCCESSFUL, you can find the results at: http://<host>:9000/dashboard?id=Solar-System-Project

The image shows a SonarQube dashboard for a project named "Solar-System-Project," indicating a failed quality gate due to insufficient code coverage. It displays metrics such as bugs, vulnerabilities, security hotspots, and code smells.

Coverage is reported as 0%, so the Quality Gate fails (coverage < 90%).

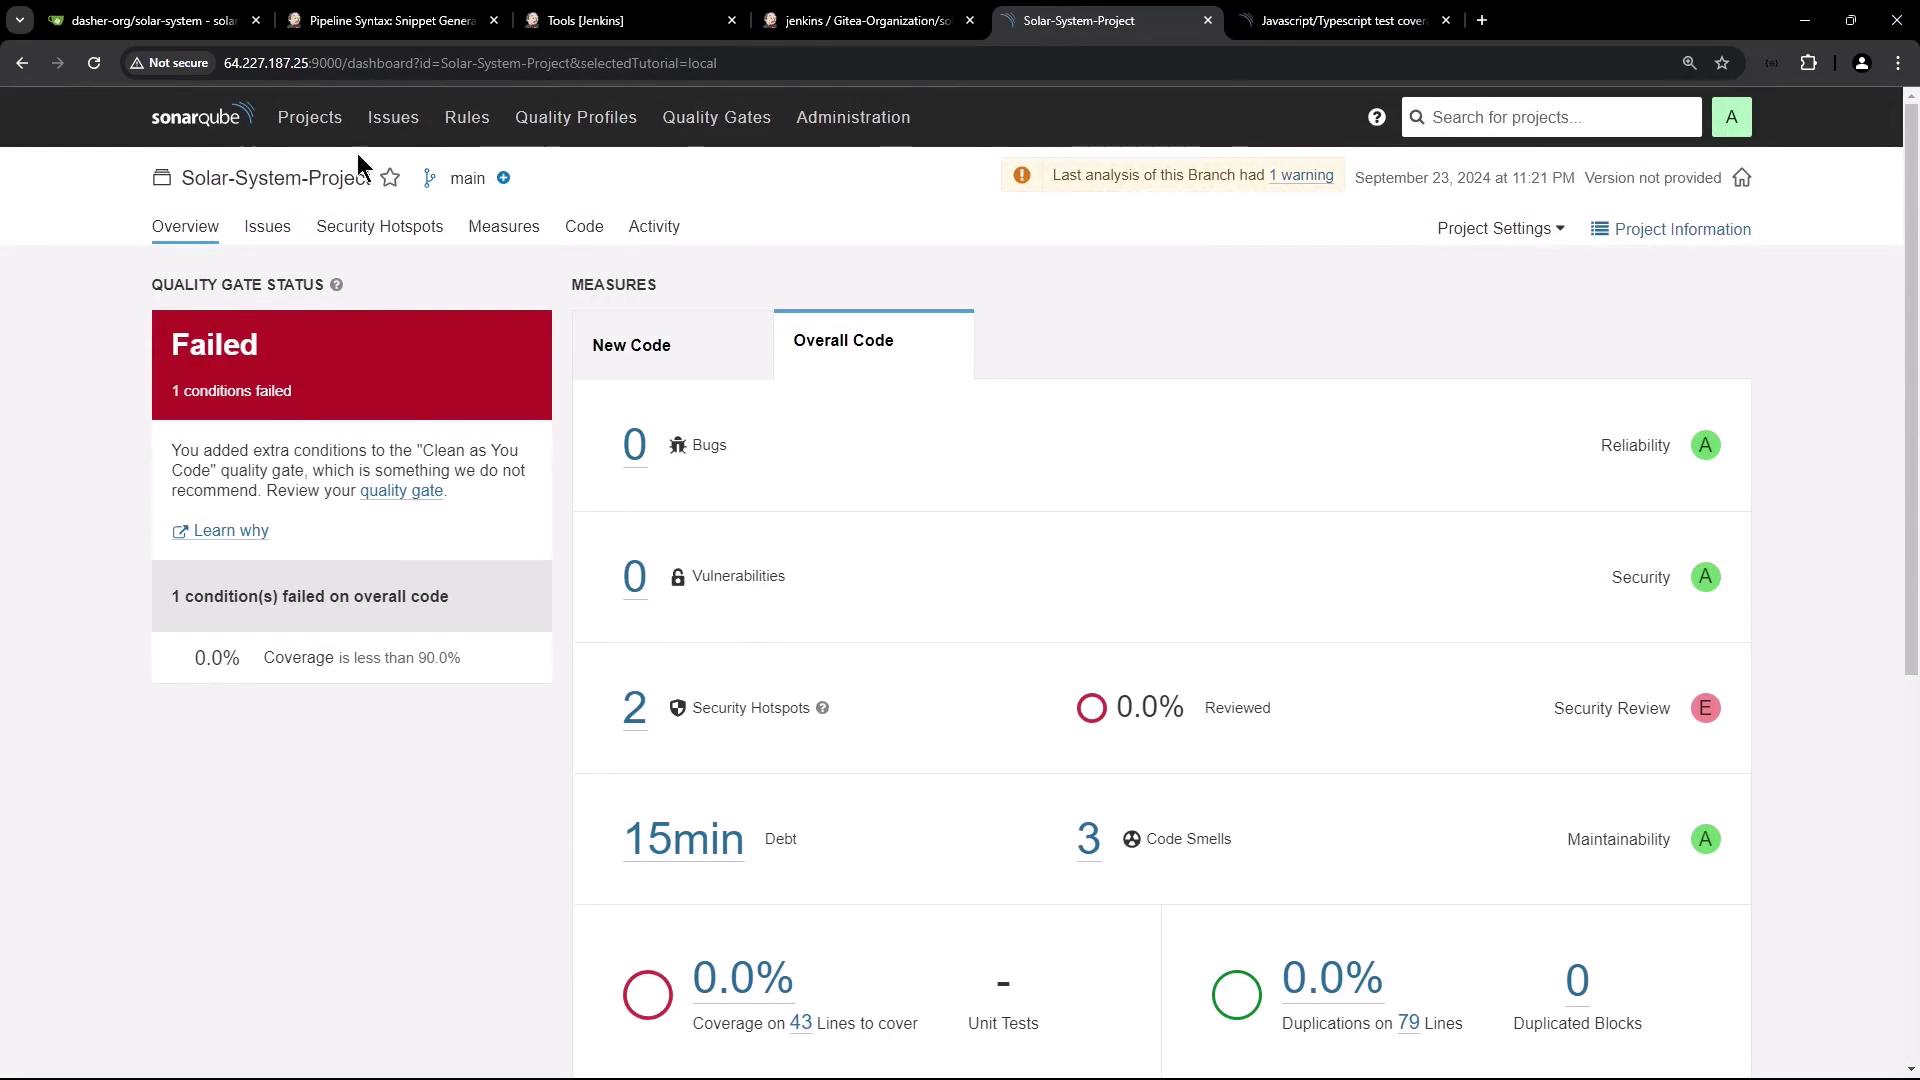
7. Adding Code Coverage Reports

  1. Generate coverage before the SonarQube stage:

    npm run coverage
    

    This creates ./coverage/lcov.info.

  2. Import the report by updating the scanner command:

    stage('SAST - SonarQube') {
      steps {
        sh 'echo $SONAR_SCANNER_HOME'
        sh """
          $SONAR_SCANNER_HOME/bin/sonar-scanner \
            -Dsonar.projectKey=Solar-System-Project \
            -Dsonar.sources=app.js \
            -Dsonar.host.url=http://<host>:9000 \
            -Dsonar.javascript.lcov.reportPaths=./coverage/lcov.info \
            -Dsonar.login=<YOUR_TOKEN>
        """
      }
    }
    

After rerunning the pipeline, your coverage will appear (e.g., 73%) but still below 90%.

The image shows a SonarQube dashboard for a project named "Solar-System-Project," indicating a failed quality gate due to code coverage being less than 90%. It displays metrics such as bugs, vulnerabilities, security hotspots, and code smells.

Note

Since SonarQube doesn’t return the Quality Gate status to Jenkins by default, your pipeline may remain green. In the next tutorial, we’ll configure the SonarQube Quality Gate plugin to fail builds when the gate fails.


Watch Video

Watch video content

Previous
SonarQube Intro