Prerequisites
Ensure you have administrative access to your Jenkins controller. Install the Build Monitor View Plugin via Manage Plugins and restart Jenkins if prompted.
1. Creating a Build Monitor View
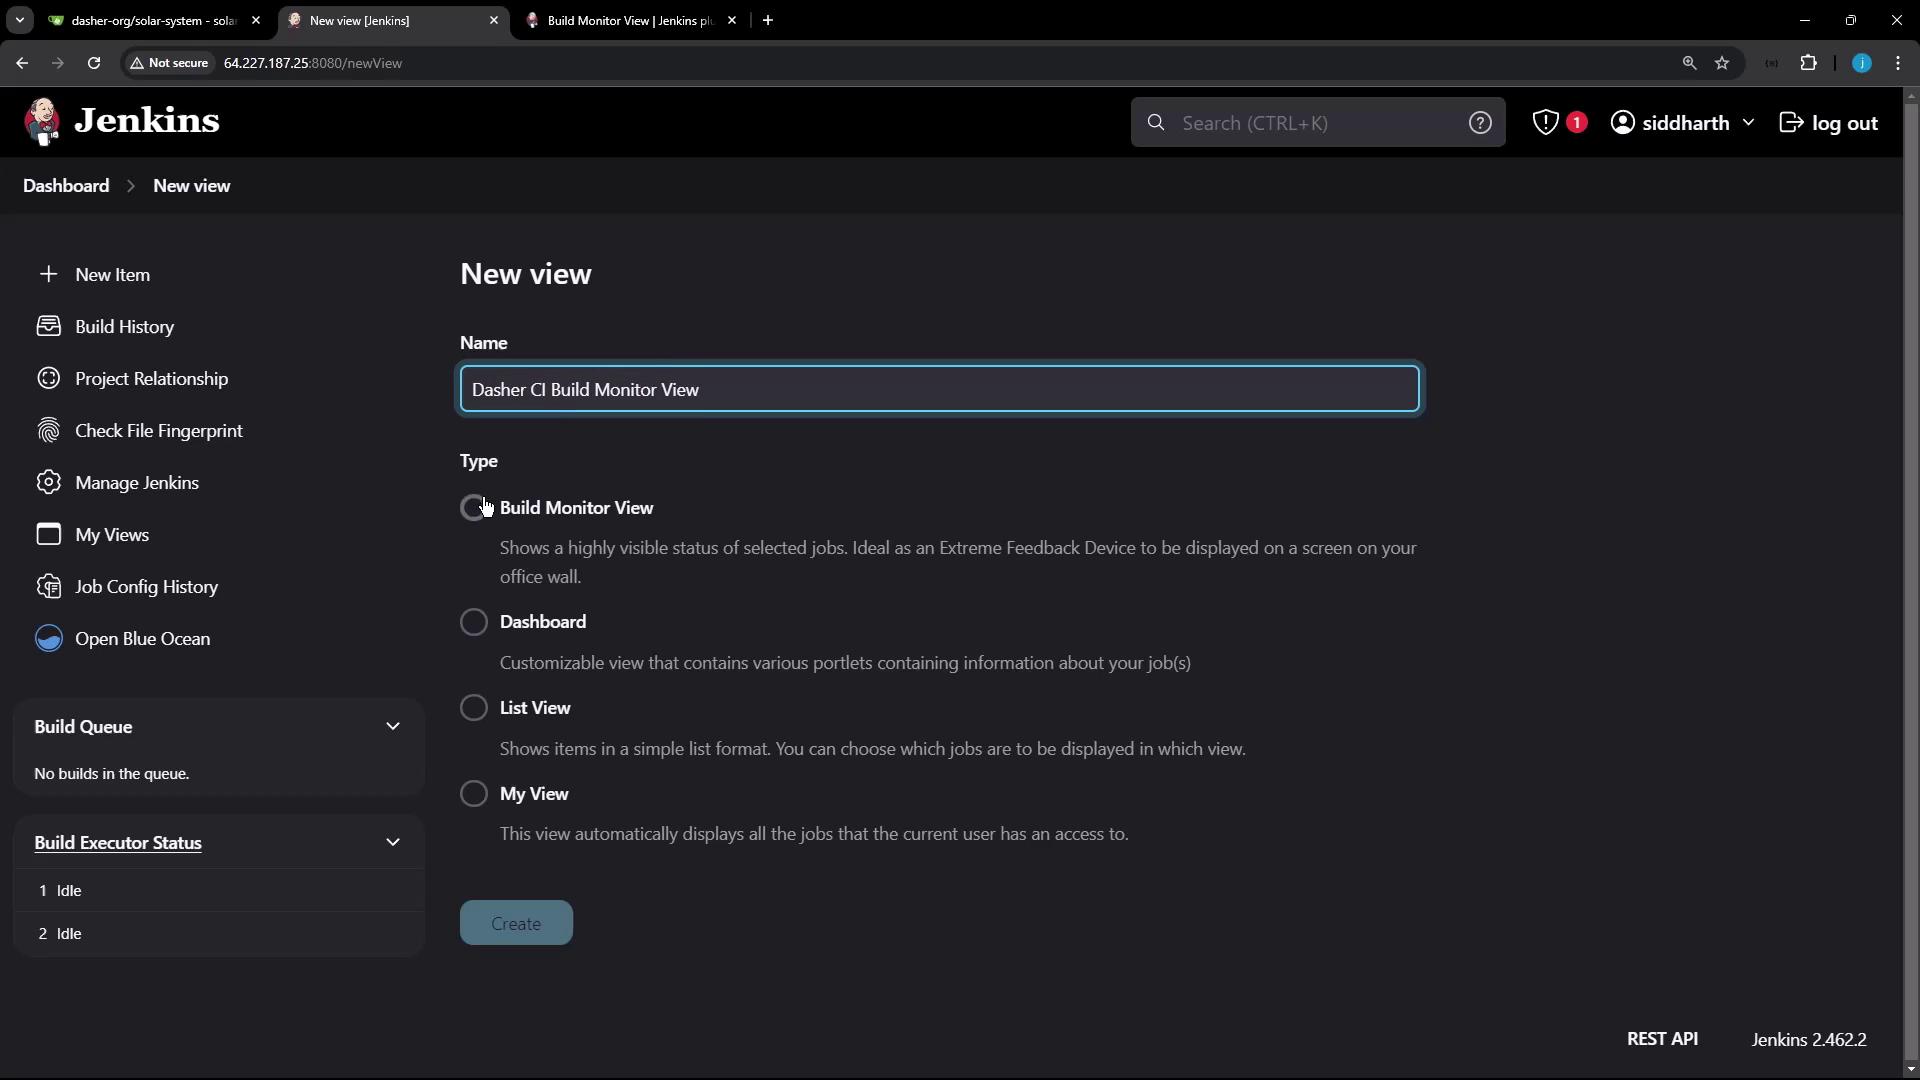
- From the Jenkins dashboard, click New View.
- Enter a name (e.g., Dasher CI Build Monitor View), select Build Monitor View, and click OK.
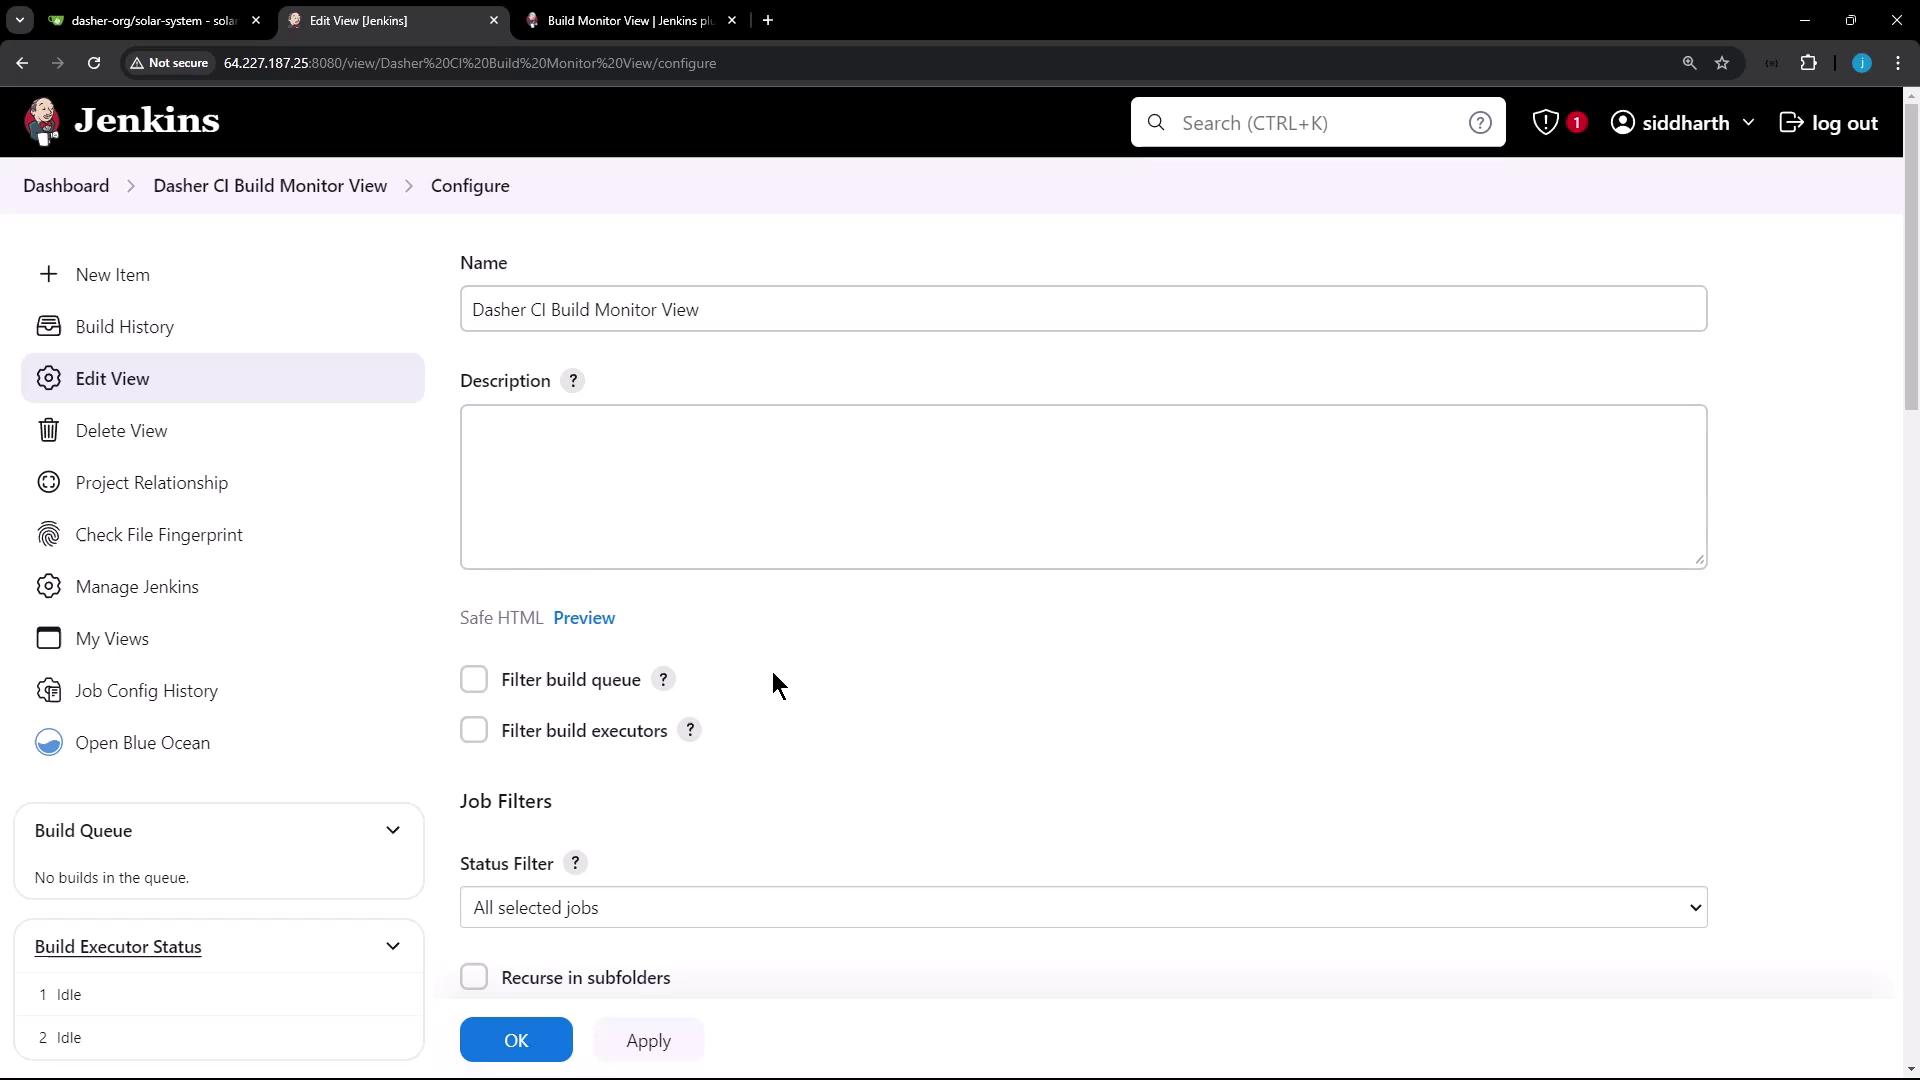
- On the configuration page, optionally add a description and set up your job filters:
- Select individual jobs
- Use a regular expression for dynamic inclusion
- Choose all available jobs
- Click Apply and then Save.
2. Configuring Display Options
Once saved, the Build Monitor View presents tiles for each job. You can customize the dashboard using these settings:| Option | Description |
|---|---|
| Text scale | Adjust the font size of job tiles |
| Number of columns | Define how many columns to display |
| Colorblind mode | Enable high-contrast color palette |
| Reduce motion | Disable CSS animations |
| Show badges | Display build badges (e.g., PR #) |
| Reset to defaults | Restore original settings |
- Green: Success
- Red: Failure
- Orange: Unstable

3. Adding a Test Pipeline
To observe live updates in your monitor view, create a simple Pipeline job:- Click New Item, enter
Testing_Build_Monitor_plugin, choose Pipeline, and click OK. - Under Pipeline > Definition, paste the following script:
- Click Apply and Save.
- Trigger a build via Build Now and watch the console:
4. Adding the Job to the Monitor View
If your new Pipeline doesn’t appear automatically, update the view filters:- Navigate to your Build Monitor View and click Configure.
- In Job Filters, select or add a regex matching
Testing_Build_Monitor_plugin. - Click Apply and Save.
