Certified Jenkins Engineer
Jenkins Administration and Monitoring Part 1
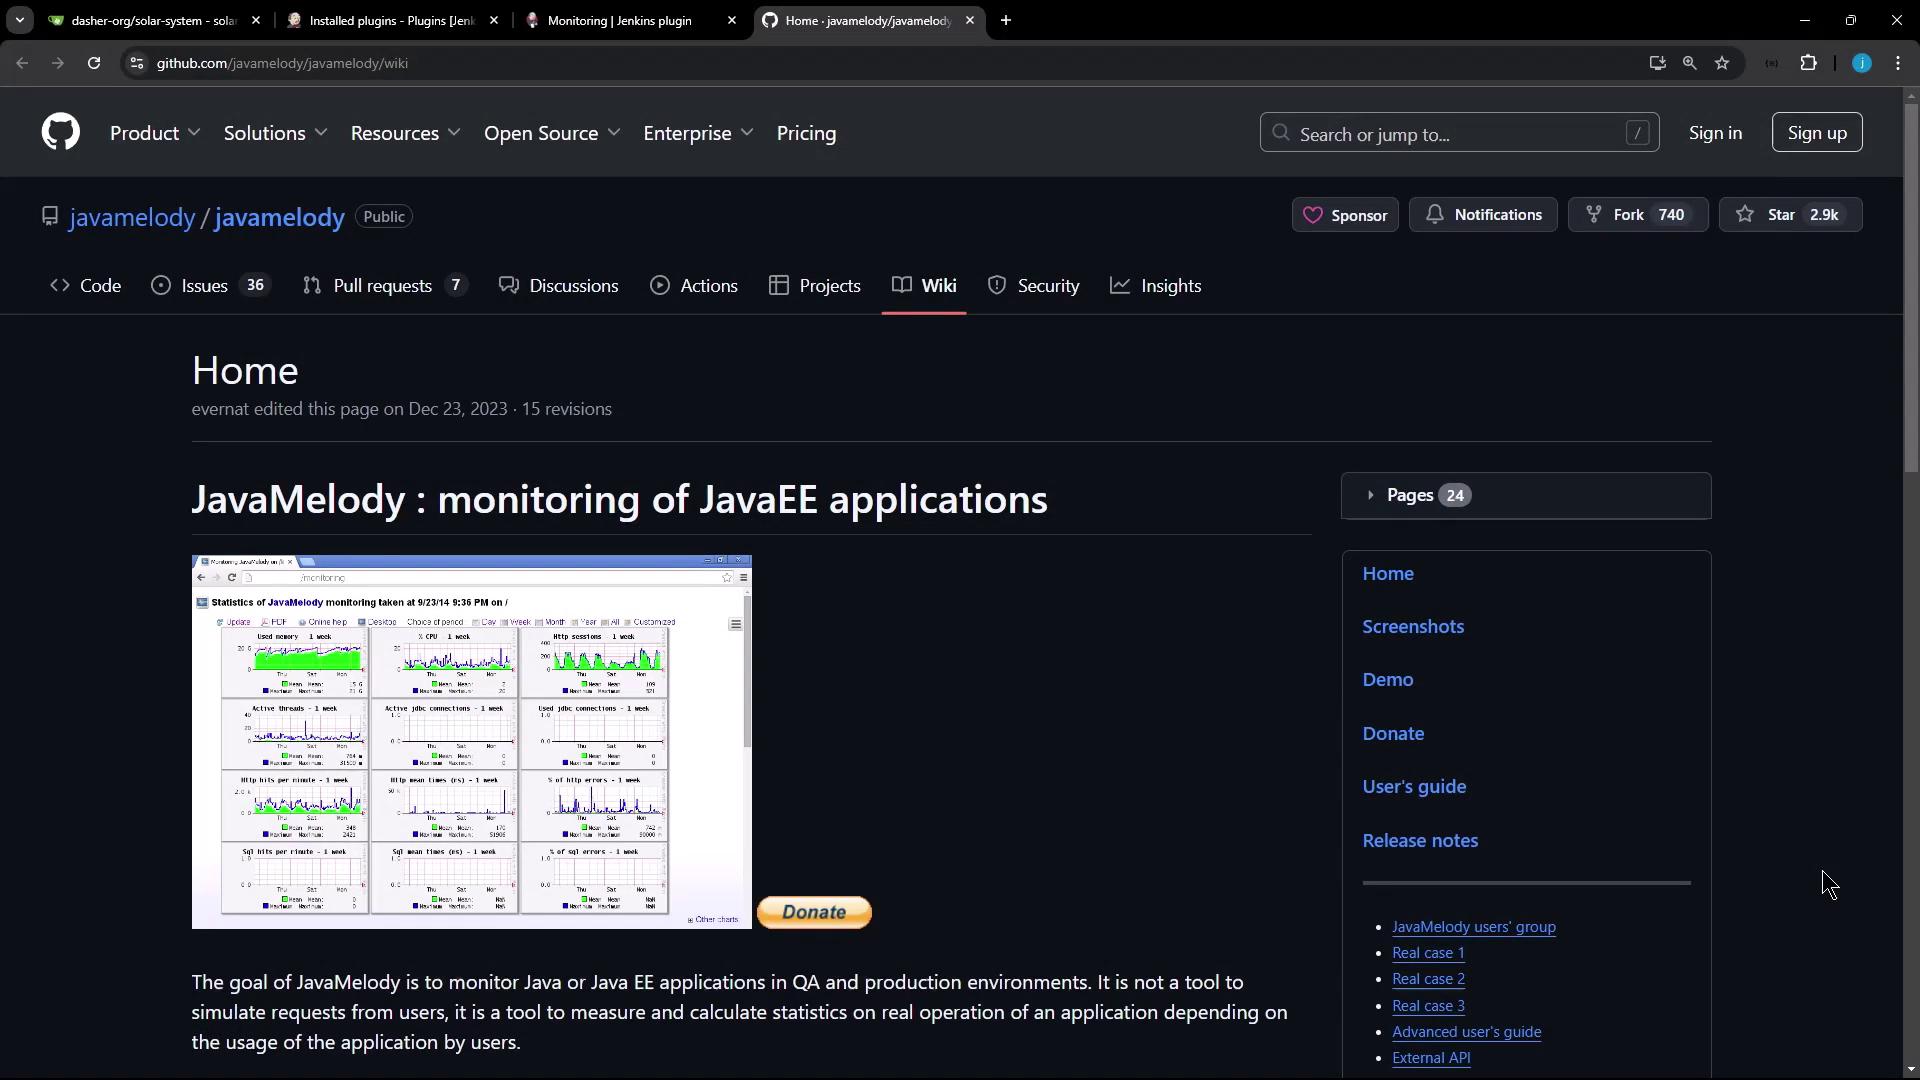
Demo Monitoring using Java Melody
In this guide, you will learn how to monitor your Jenkins controller and agents using JavaMelody, an open-source performance monitoring tool for Java applications. By the end, you’ll be able to track real-time metrics such as memory usage, CPU load, HTTP requests, and thread activity directly within your Jenkins UI.
What Is JavaMelody?
JavaMelody provides in-depth dashboards for JavaEE applications, capturing critical performance data:

Key metrics tracked by JavaMelody:
- Memory usage (heap & non-heap)
- CPU load and system load averages
- HTTP request counts, mean/max durations
- Thread states and peak thread counts
- Error rates and log analysis
Note
JavaMelody supports HTML and PDF report generation, multi-language UI, and integrates seamlessly into any Java web application.
Integrating JavaMelody with Jenkins
Jenkins is Java-based, so you can leverage the Monitoring plugin to embed JavaMelody into your controller and agents.
- Go to Manage Jenkins > Manage Plugins.
- Search for Monitoring and install the plugin.
- Restart your Jenkins controller to activate JavaMelody.
Warning
Installing monitoring plugins may introduce additional JVM overhead. Monitor resource usage on production systems before rolling out cluster-wide.
For full documentation, visit the Monitoring Plugin page.

Plugin Features
| Metric Category | Details |
|---|---|
| Memory & CPU | Heap/non-heap usage, system CPU, process CPU, load averages |
| HTTP Requests | Request counts, cumulative times, mean/max durations |
| Thread Monitoring | Active vs. idle threads, creation rate, peak usage |
| Errors & Logs | Exception counts, log severity breakdown |
| Reporting | Export HTML or PDF reports |
| Localization | English, German, French, and more |
Accessing the Monitoring Dashboard
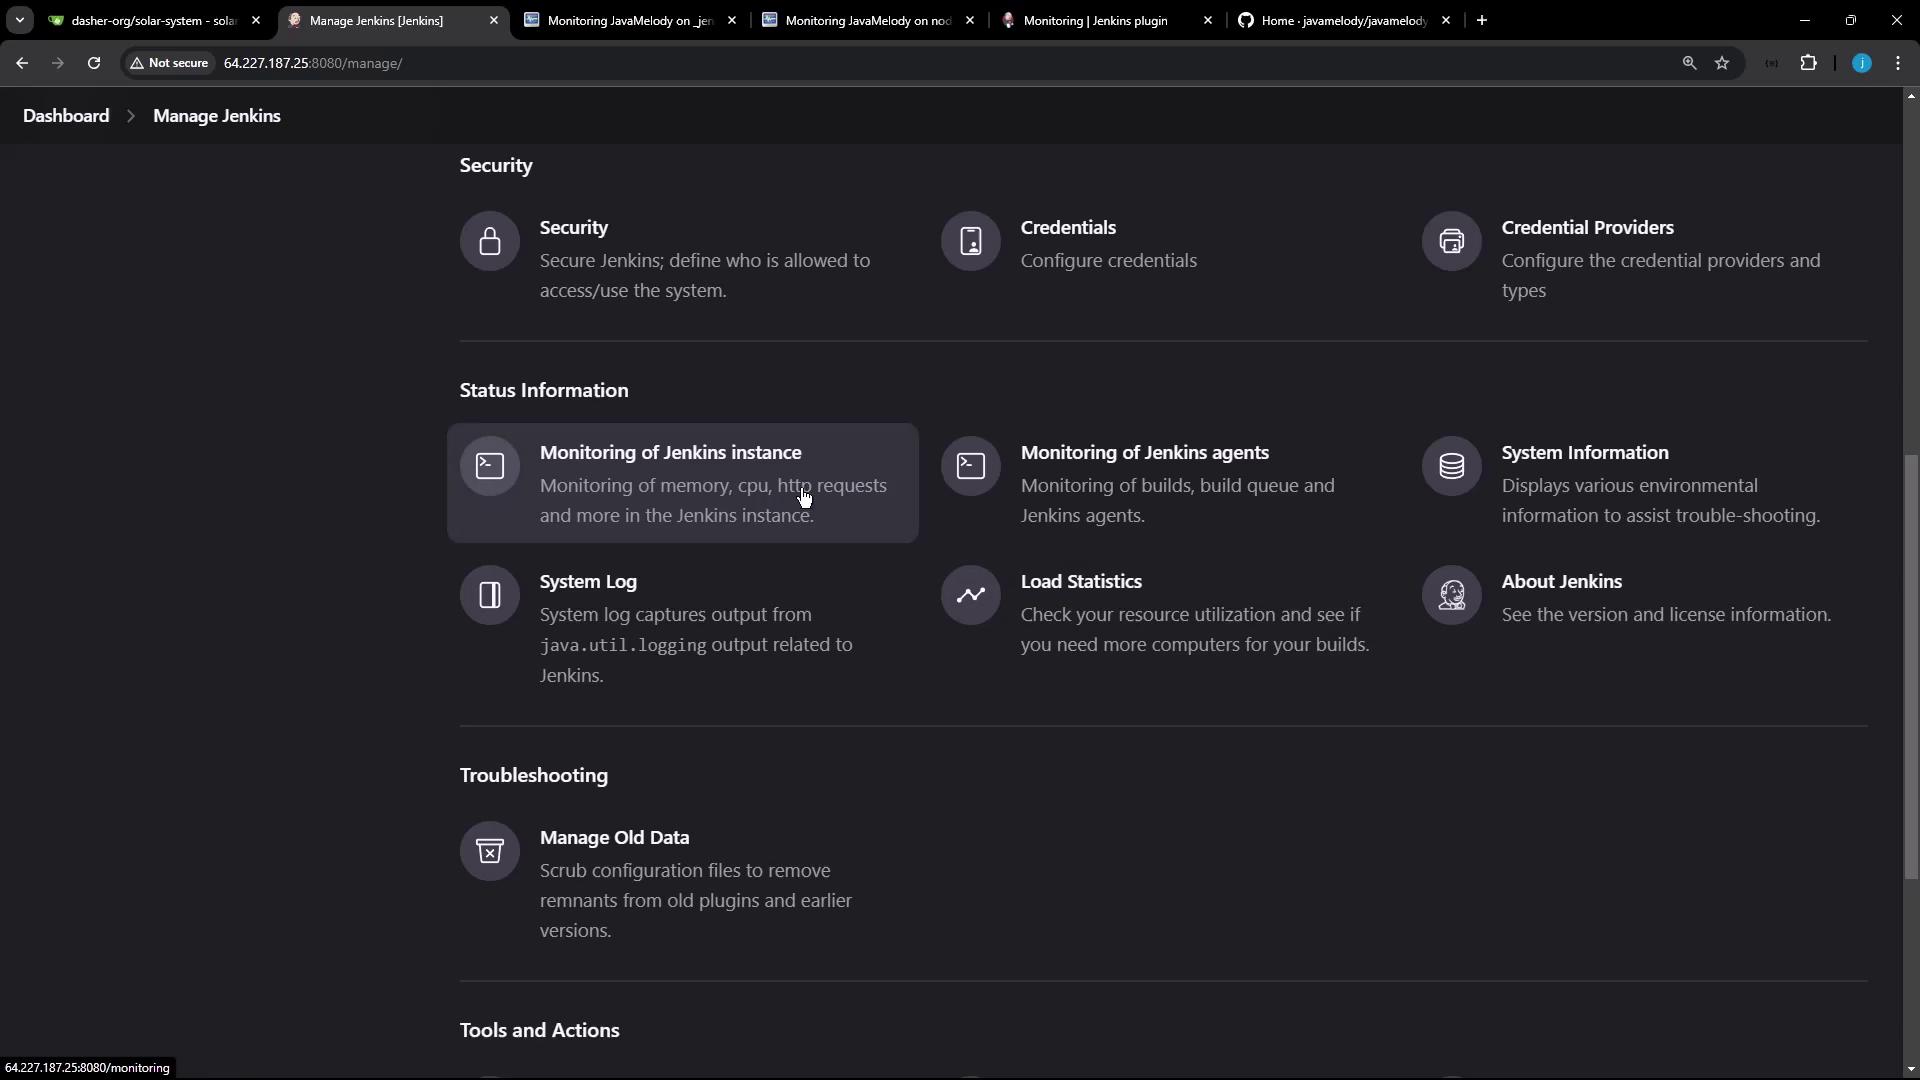
After restarting Jenkins, navigate to Manage Jenkins and scroll down to the Monitoring of Jenkins Instance and Monitoring of Jenkins Agents sections:

Controller (Jenkins Instance) Monitoring
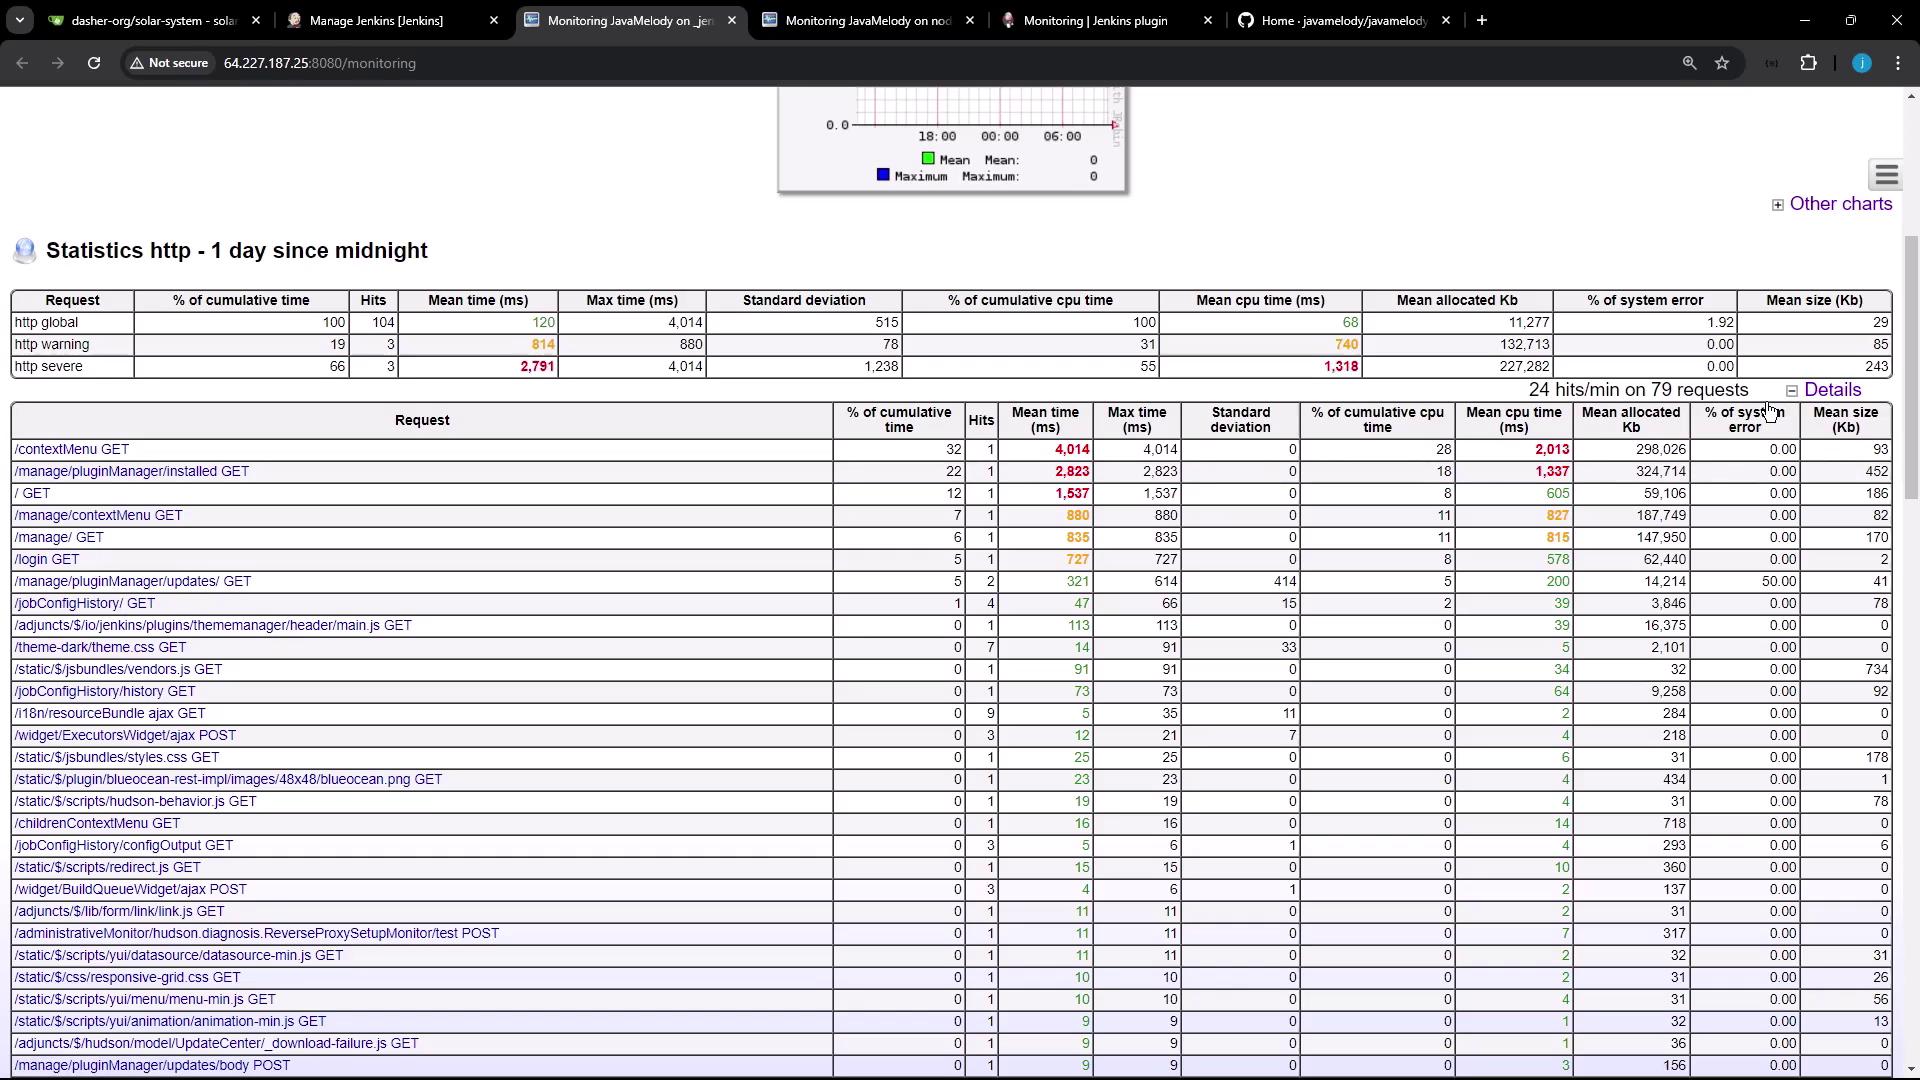
Click Monitoring of Jenkins Instance to open the JavaMelody dashboard for your controller. You’ll find:
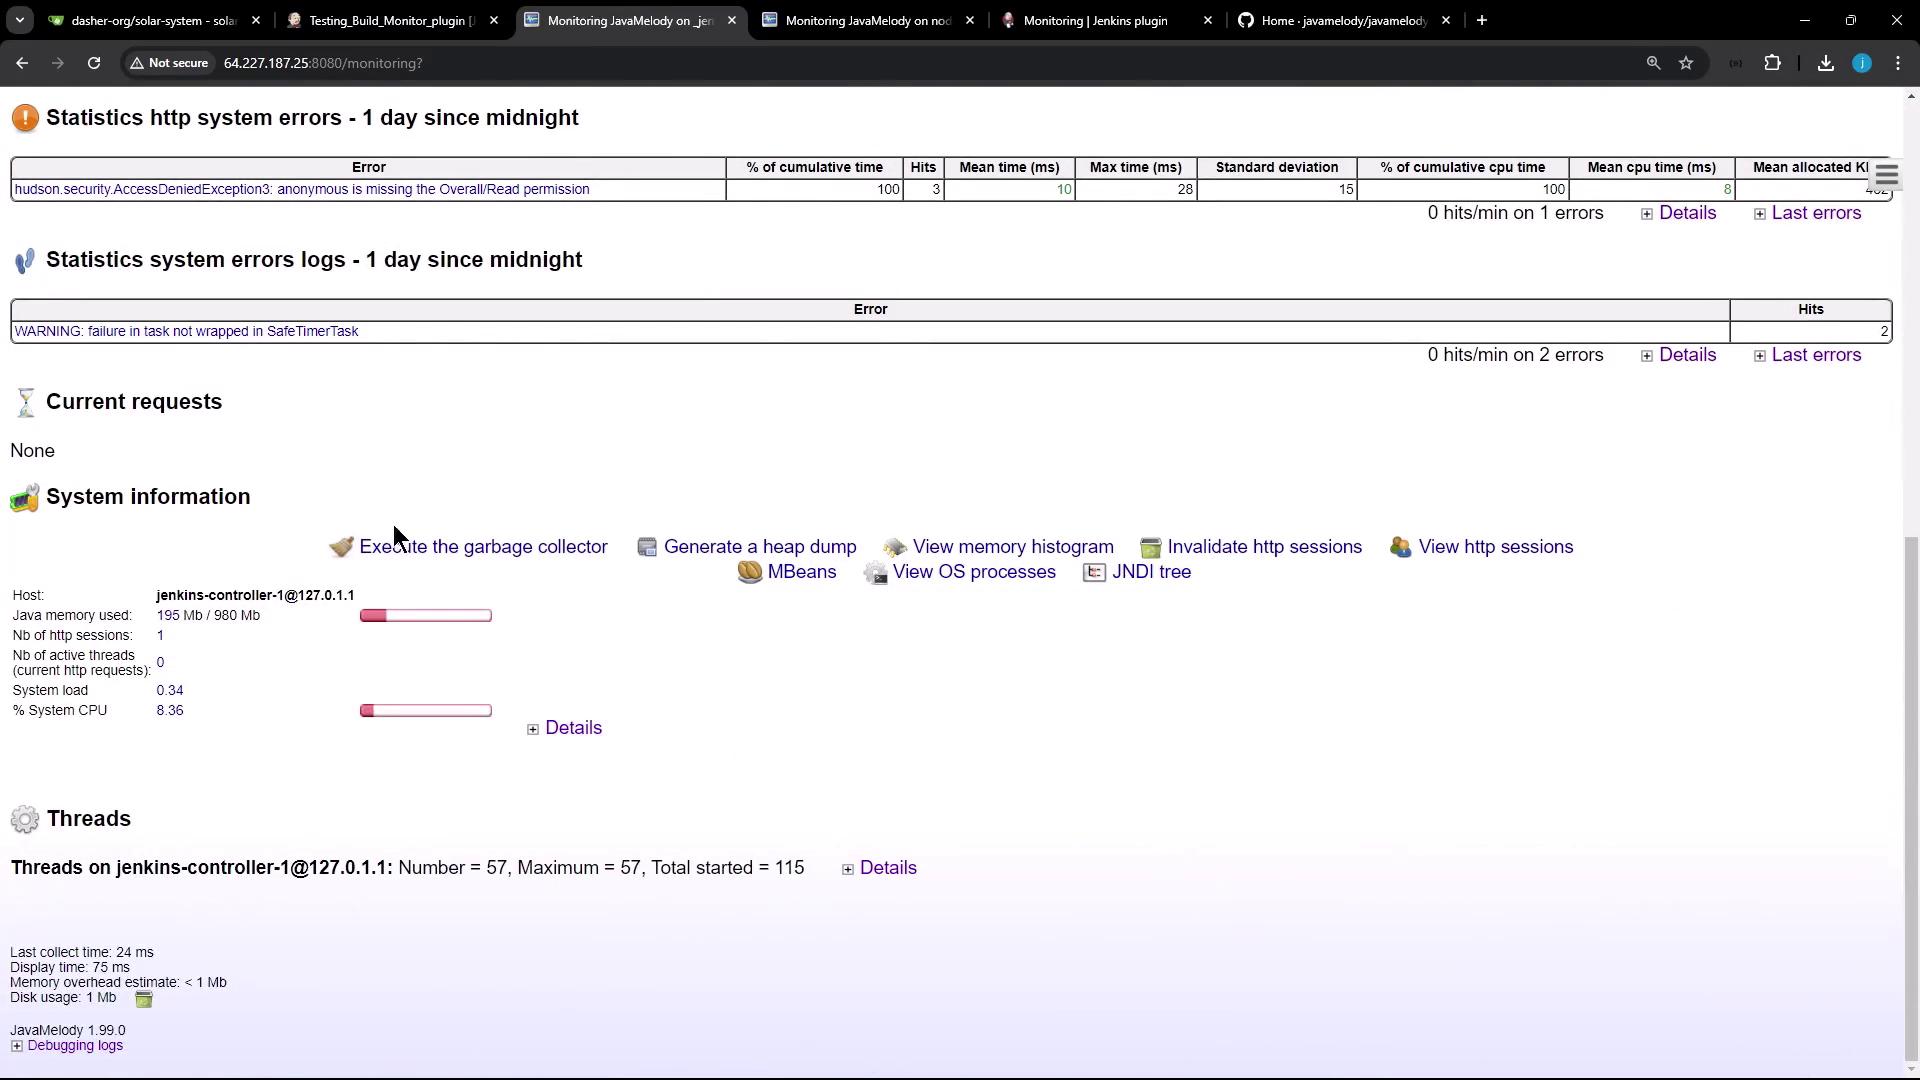
- System Information
- JVM vendor/version, OS name, uptime
- Memory & CPU Charts
- Real-time graphs for heap/non-heap and CPU usage
- HTTP Request Statistics
- Table of endpoints with hits, cumulative time, mean/max durations
- Thread States
- Active vs. idle threads, thread creation rate

At the top, adjust the time window for all charts or click PDF report to export metrics for sharing.
Agent (Node) Monitoring
Under Monitoring of Jenkins Agents, select any connected node to view:
- Garbage collection triggers
- Heap dump generation
- Memory histogram visualizations
- Active HTTP session details (client country, browser, user)
If only one agent is online, data will be limited, but additional nodes will appear as they connect.
Observing Live Build Metrics
To see JavaMelody update in real time:
- Create a Jenkins pipeline with a sleep/pause stage (e.g.,
sleep 60). - Trigger the job and keep the monitoring dashboard open.
- Refresh periodically to watch thread counts rise, HTTP sessions form, and CPU usage spike.

In the Threads section, you’ll observe:
- Total vs. active threads
- Thread creation rate spikes during builds
- Peak usage metrics
Real-time insights help you identify bottlenecks and optimize Jenkins performance.
Links and References
Watch Video
Watch video content