Certified Jenkins Engineer

Jenkins Administration and Monitoring Part 2

Demo Log Recorder

In this guide, we’ll show you how to create and manage loggers in Jenkins for effective troubleshooting and debugging. Jenkins offers multiple methods to adjust logging levels—ideal for diagnosing issues in plugins, pipelines, and integrations.

Warning

Increasing verbosity generates more log output and can impact controller performance due to higher disk and I/O usage. Only raise logging levels during active troubleshooting, and revert to defaults afterward.

Logging Configuration Options

You can configure custom logging in Jenkins using one of these five approaches:

MethodPersistenceDescription
1. UI LoggerDynamic (runtime)Add or adjust loggers on the fly via the Jenkins interface.
2. Groovy Init ScriptPersistentInclude a Groovy script in init.groovy.d to set levels at startup.
3. Java Util Logging PropertiesPersistentProvide a logging.properties file under $JENKINS_HOME.
4. File System Custom Log RecorderPersistentDefine XML recorder files in $JENKINS_HOME/log/ and view in UI.
5. XML Configuration via UIEphemeralPaste an XML snippet in the UI; resets after restart.
  1. Add a Logger via the Jenkins UI (recommended)
  2. Initialize via a Groovy Script
  3. Use a Java Util Logging Properties File
  4. File System Custom Log Recorder
  5. XML Configuration via the UI (non-persistent)

1. Add a Logger via the Jenkins UI

For dynamic control over logging, the Jenkins UI is the easiest option. For example, to troubleshoot the Kubernetes cloud plugin:

  1. Go to Manage JenkinsSystem Log.
  2. Click Add new log recorder, provide a name, then add the package or logger and select the desired level.

The image is a screenshot of a webpage providing instructions on adding a logger from the UI in Jenkins, with a step-by-step guide and a partial view of the Jenkins interface.

Note

Using the UI allows you to switch log levels at runtime without restarting Jenkins.

2. Initialize via a Groovy Script

Place a Groovy file under JENKINS_HOME/init.groovy.d/ to set log levels at startup:

import java.util.logging.Level
import java.util.logging.Logger

Logger.getLogger("hudson.plugins.git.GitStatus").setLevel(Level.SEVERE)
Logger.getLogger("hudson.security.csrf.CrumbFilter").setLevel(Level.SEVERE)

3. Java Util Logging Properties File

Drop a logging.properties file into $JENKINS_HOME:

.level = INFO
handlers = java.util.logging.ConsoleHandler

java.util.logging.ConsoleHandler.level = INFO
java.util.logging.ConsoleHandler.formatter = java.util.logging.SimpleFormatter

4. File System Custom Log Recorder

Create XML definitions under the Jenkins home directory:

$JENKINS_HOME/
  log/
    kb-article.xml   # Custom log recorder definition
  logs/
    custom/
      kb-article.log # Recorder output file

5. XML Configuration via the UI (Non-Persistent)

You can also paste default logger settings directly in the UI (resets on restart):

<?xml version="1.1" encoding="UTF-8"?>
<log>
  <name>kb-article</name>
  <targets>
    <target>
      <name>org.jenkinsci.plugins.saml</name>
      <level>300</level>
    </target>
    <target>
      <name>org.pac4j</name>
    </target>
  </targets>
</log>

Example: Debugging Kubernetes Cloud Connection

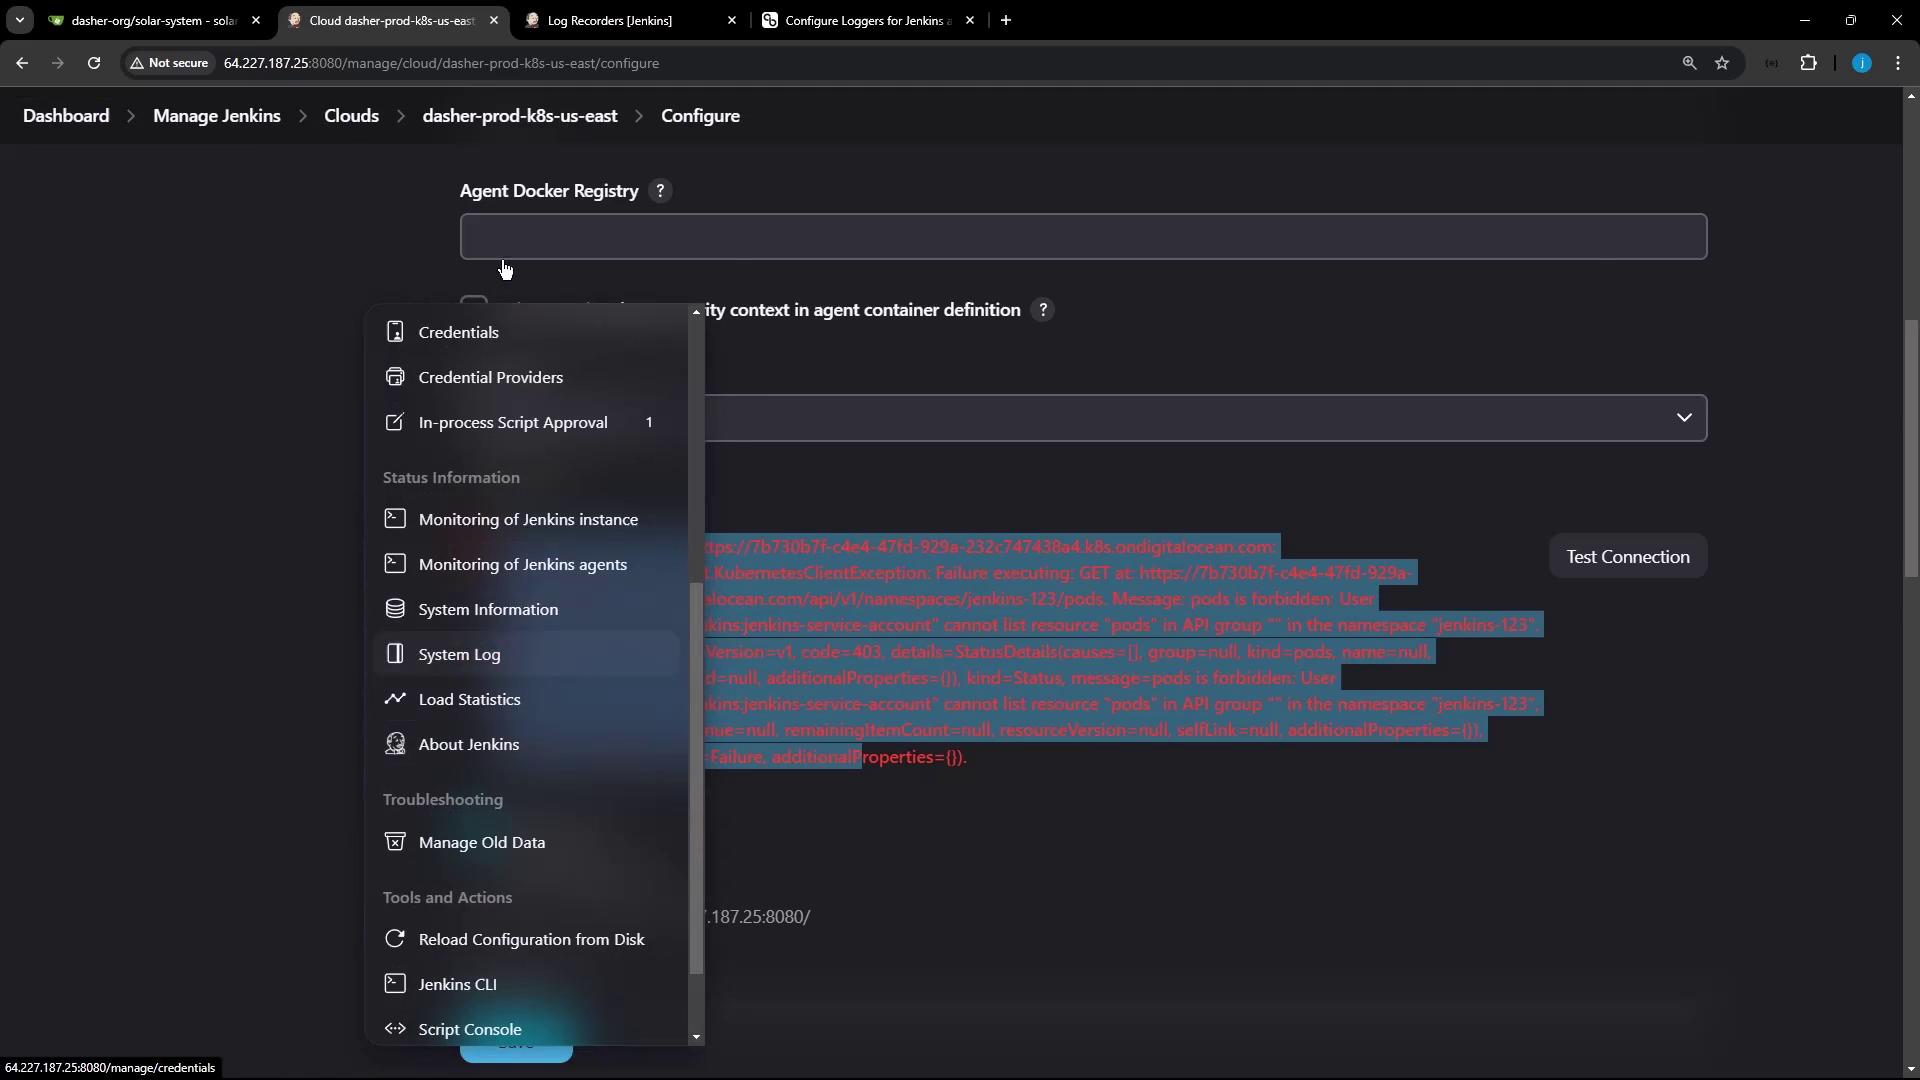
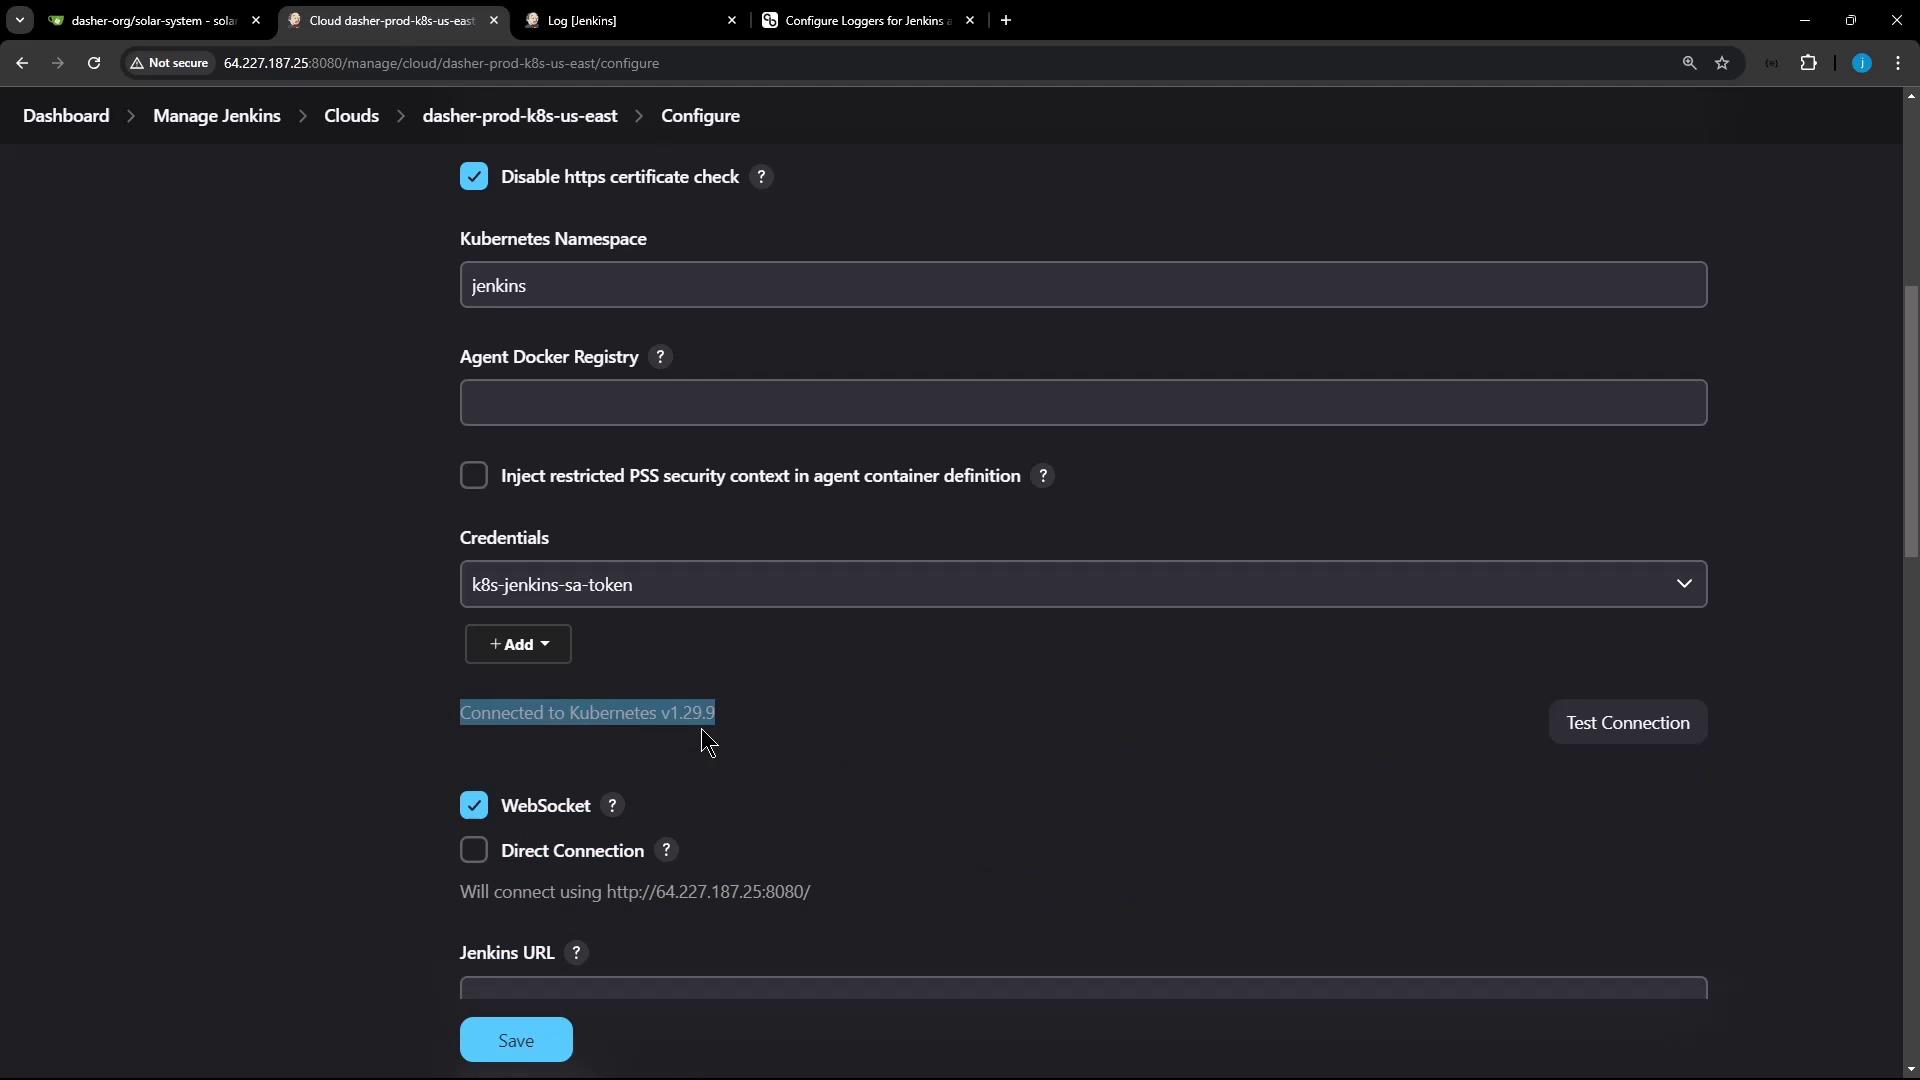
When testing your Kubernetes cloud in Jenkins, you might see a generic error:

Error testing connection https://7b730b7f-4e4e-471d-929a-23267474384a.k8s.onddi...
io.fabric8.kubernetes.client.KubernetesClientException: Failure executing: GET at: https://7b7.../pods. 
Message: pods is forbidden: User "system:serviceaccount:jenkins:jenkins-service-account" 
cannot list resource "pods" ... Received status: Status(apiVersion=v1, code=403...))

Note

A 403 Forbidden often indicates missing RBAC permissions for the Jenkins service account.

To capture HTTP-level details:
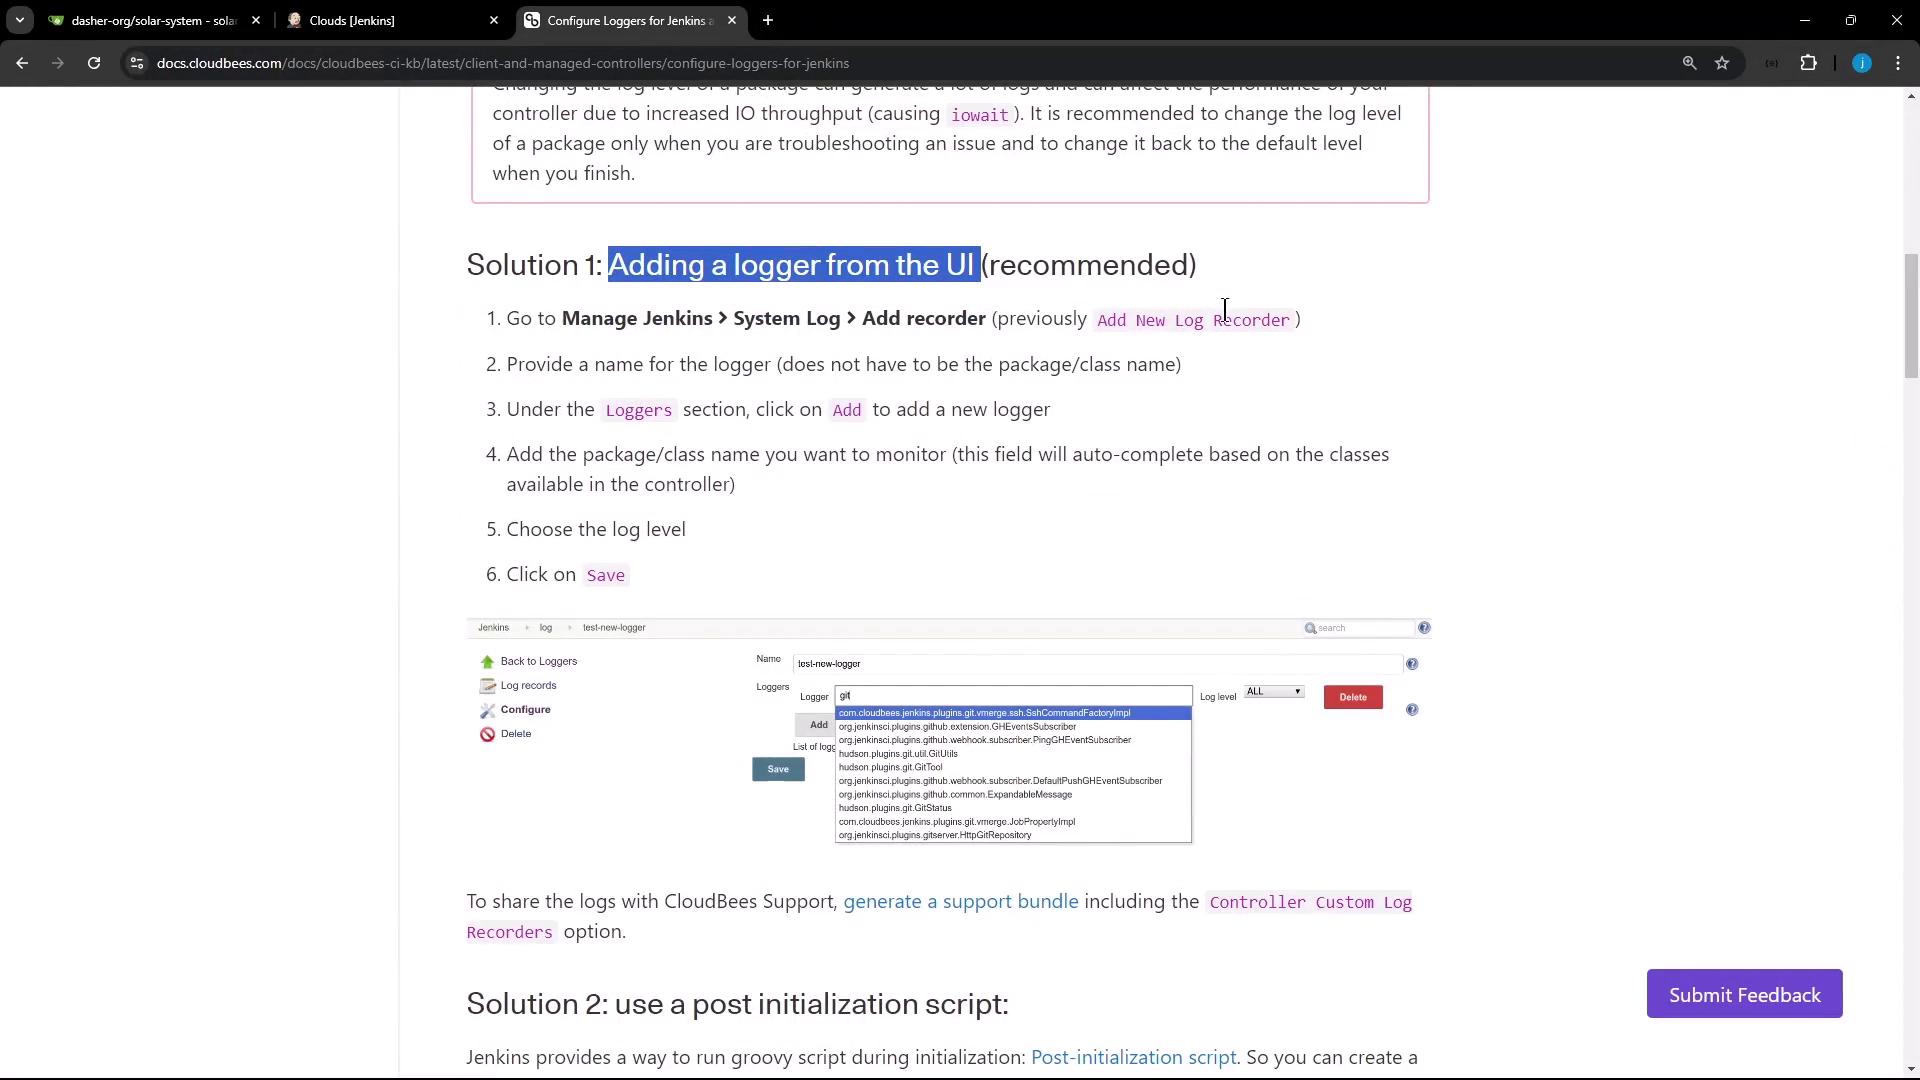
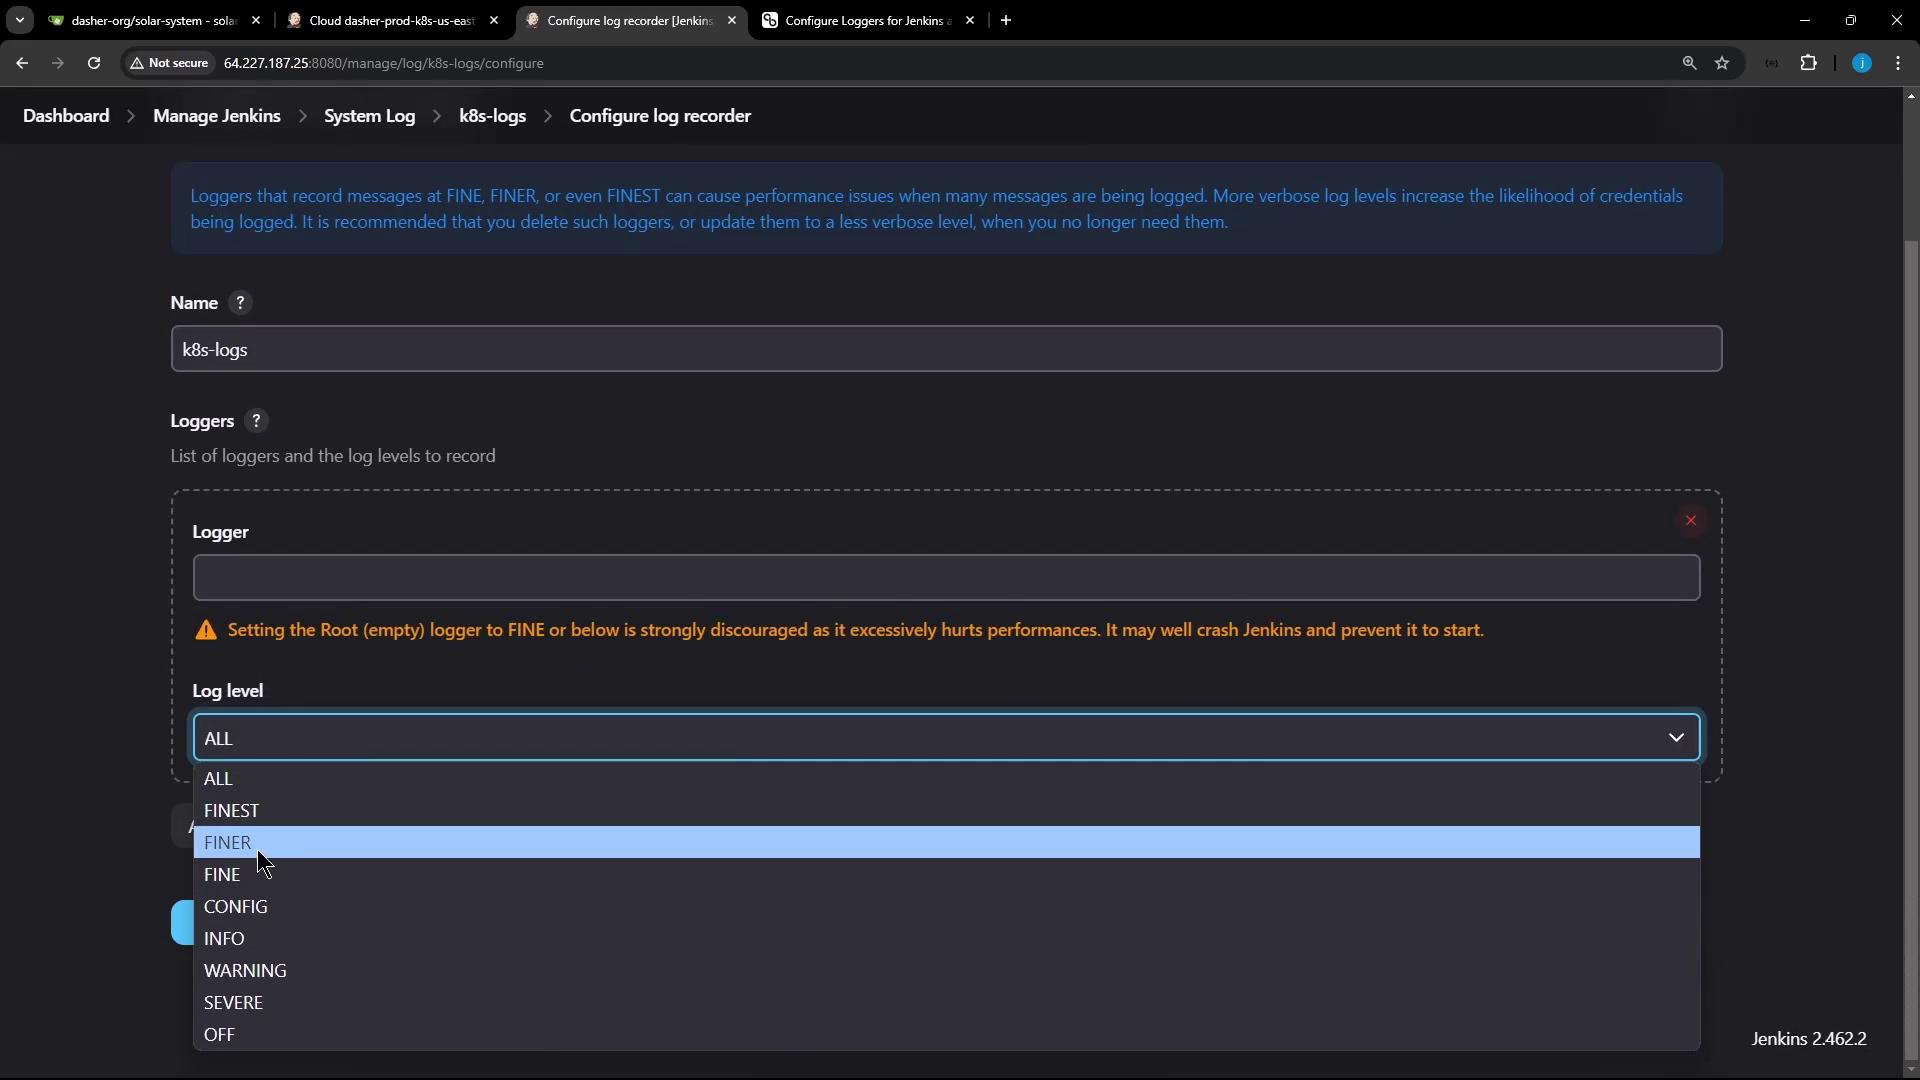
  1. Go to Manage JenkinsSystem Log.
  2. Click Add new log recorder, name it (e.g., k8s-logs), and set level to All.
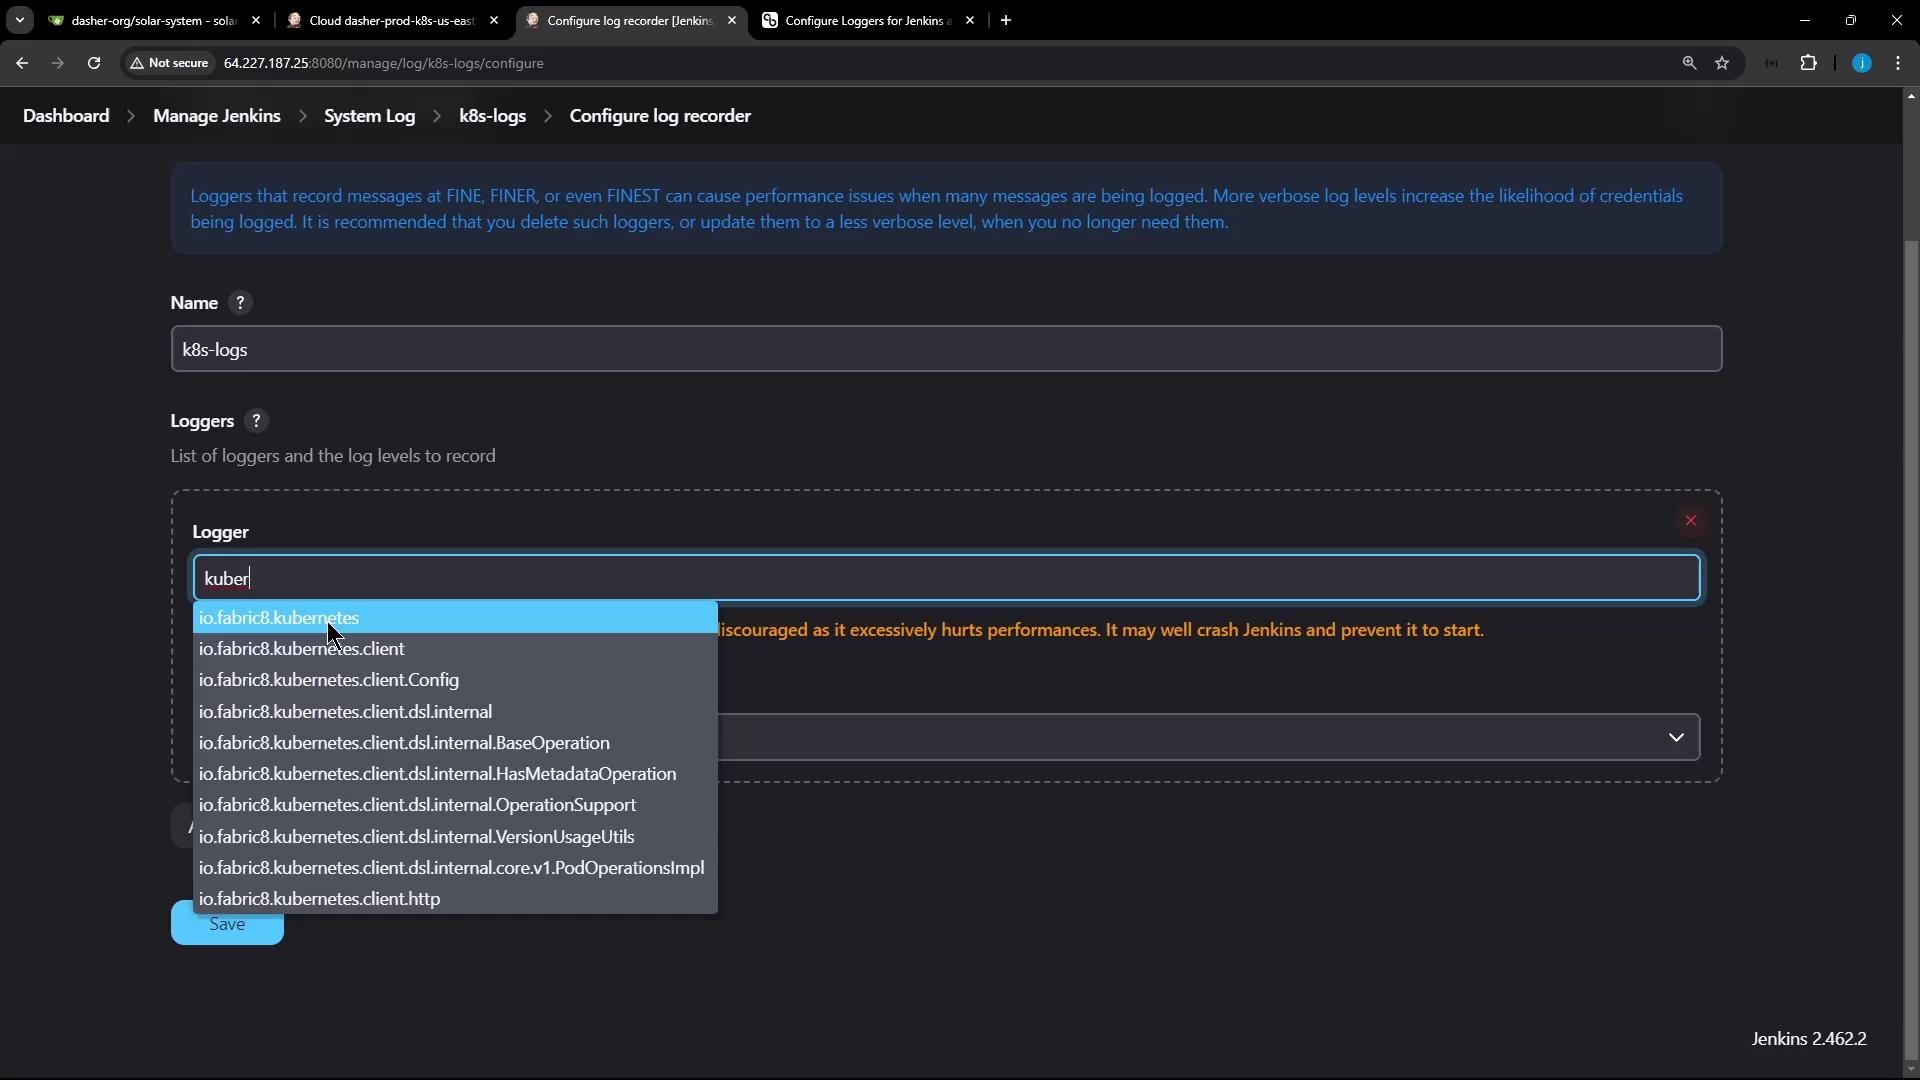
  3. Search for Kubernetes and select io.fabric8.kubernetes.client or the specific subpackage.

The image shows a Jenkins configuration interface with a dropdown menu open, displaying various options like "Credentials" and "System Log." There is also an error message related to Kubernetes client execution visible in red text.

The image shows a Jenkins configuration screen for setting up a log recorder named "k8s-logs," with a dropdown menu for selecting log levels. A warning advises against setting the Root logger to "FINE" or below due to performance issues.

The image shows a Jenkins configuration screen for setting up a log recorder, with a dropdown menu displaying Kubernetes-related logger options.

After saving, retry the connection and then refresh the log recorder view to see detailed HTTP exchanges:

Nov 10, 2024 5:34:35 PM FINE io.fabric8.kubernetes.client.utils.HttpClientUtils getHttpClientFactory
Using httpclient io.fabric8.kubernetes.client.okhttp.OkHttpClientFactory factory
Nov 10, 2024 5:34:35 PM FINEST io.fabric8.kubernetes.client.HttpLoggingInterceptor$HttpLogger logStart
-HTTP START-
Nov 10, 2024 5:34:35 PM FINEST io.fabric8.kubernetes.client.HttpLoggingInterceptor$HttpLogger logRequest
> GET https://7b7b35ef-.../namespaces/jenkins-123/pods
> Authorization: Bearer eyJh...
> User-Agent: fabric8-kubernetes-client/6.1.0
< 403 Forbidden
Nov 10, 2024 5:34:35 PM FINEST io.fabric8.kubernetes.client.HttpLoggingInterceptor$HttpLogger logResponse
< content-type: application/json
...
Nov 10, 2024 5:34:35 PM FINE io.fabric8.kubernetes.client.impl.BaseClient close
The client and associated httpclient ... have been closed...

These entries reveal the full request headers, status codes, and JSON payload.

Example: Successful Connection

With correct RBAC and service account settings, the UI will show a one-line success. Jenkins will still record the detailed HTTP lifecycle if debug logging is enabled:

The image shows a configuration screen for Jenkins, specifically for setting up a Kubernetes cloud. It includes options for Kubernetes Namespace, Agent Docker Registry, and connection settings.

-HTTP START-
> GET https://bhb3f7f-4e4d-99a2-237c7438a.k8s.digitalocean.com/api/v1/namespaces/jenkins/pods
... (headers)
-HTTP END-
Nov 10, 2024 5:34:35 PM FINE io.fabric8.kubernetes.client.impl.BaseClient close

You can also log the Kubernetes version:

{
  "major": "1",
  "minor": "29",
  "gitVersion": "v1.29.9",
  "gitCommit": "114a1f58037bd7f90d9e630e591c5e52dd9b298",
  "gitTreeState": "clean",
  "buildDate": "2020-09-11T20:19:54Z",
  "goVersion": "go1.22.6",
  "compiler": "gc",
  "platform": "linux/amd64"
}

Cleanup

After you've resolved the issue, delete any custom log recorders or reset log levels to restore Jenkins’s default performance.

Watch Video

Watch video content

Previous
Demo Monitoring with Prometheus Grafana