DevSecOps - Kubernetes DevOps & Security
DevSecOps Pipeline
Demo SonarQube
In this guide, you’ll learn how to integrate SonarQube static analysis into a Jenkins pipeline for a Spring Boot application. We’ll cover:
- Starting SonarQube in Docker
- Creating and configuring a SonarQube project
- Running analysis locally with Maven
- Embedding SonarQube in your Jenkinsfile
- Enforcing custom quality gates
Prerequisites
- Docker installed and running
- Jenkins server with Docker and Pipeline plugins
- Maven project for your Spring Boot application
Note
Ensure your SonarQube Docker container always listens on port 9000 after VM restarts.
1. Start and Verify SonarQube Container
Run SonarQube in Docker:
docker run -d --name sonarqube -p 9000:9000 sonarqube:latest
Confirm the container is up:
docker ps -a | grep -i sonar
# Expected:
# 5b47910fdc73 sonarqube:latest "bin/run.sh bin/sona…" Up 13 minutes 0.0.0.0:9000->9000/tcp sonarqube
2. Log In and Create a New Project
Open your browser at http://<VM_IP>:9000. Log in with the default admin credentials:
- Username: admin
- Password: admin
Warning
Change the default password immediately to secure your SonarQube instance.
Once logged in, click Create new project:
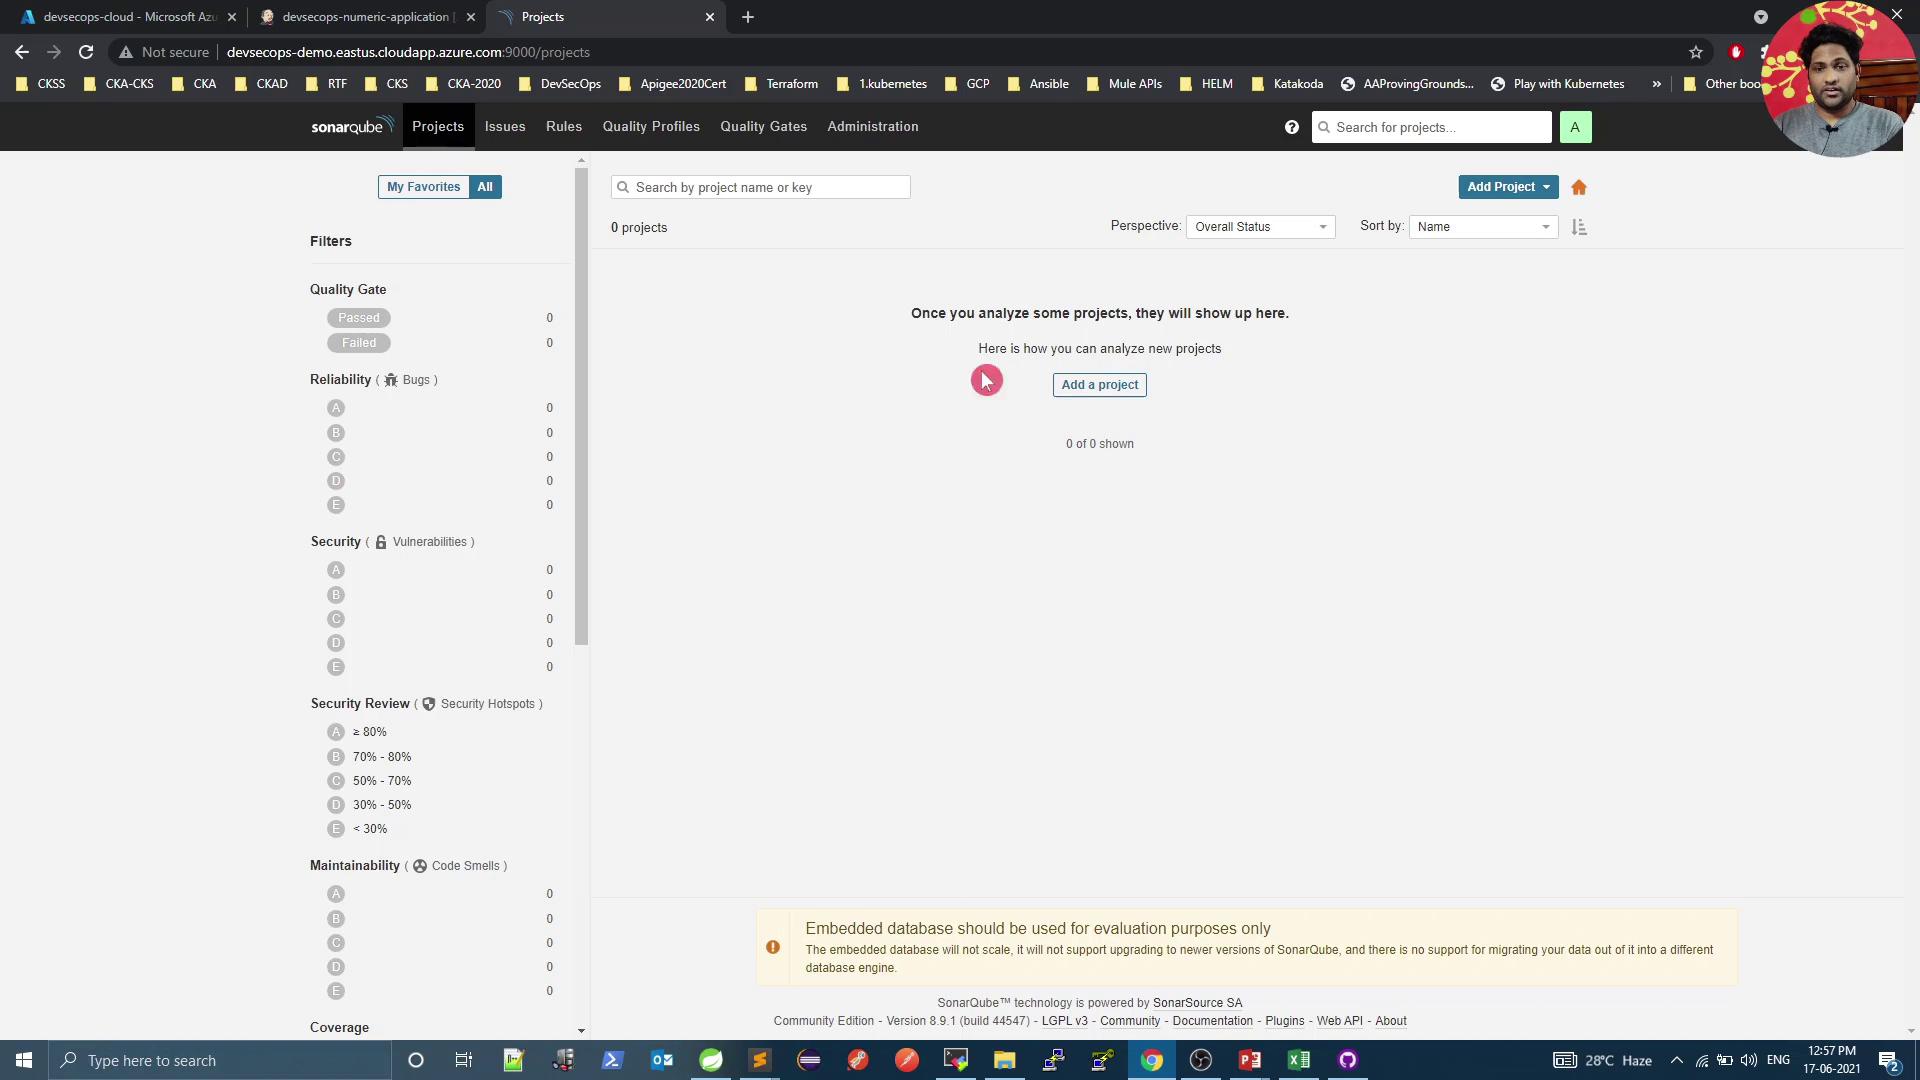
Fill in the Project key and Display name (e.g., numeric-application), then generate a token (e.g., Jenkins Pipeline):

3. Run Local Analysis with Maven
Select Maven as your build tool. Copy and customize the displayed command:

mvn sonar:sonar \
  -Dsonar.projectKey=numeric-application \
  -Dsonar.host.url=http://devsecops-demo.eastus.cloudapp.azure.com:9000 \
  -Dsonar.login=YOUR_SONAR_TOKEN
You can run this locally to verify successful analysis before Jenkins integration.
4. Integrate SonarQube into Jenkins Pipeline
Add a SonarQube stage in your Jenkinsfile after unit and mutation test stages.
| Stage | Purpose |
|---|---|
| Unit Tests | Execute JUnit tests and collect coverage |
| Mutation Tests | Run PIT mutation testing |
| SonarQube – SAST | Perform static code analysis with SonarQube |
| Docker Build and Push | Build Docker image and push to registry |
pipeline {
  agent any
  environment {
    SONAR_TOKEN = credentials('sonar-token')
  }
  stages {
    stage('Unit Tests - JUnit and JaCoCo') {
      steps {
        sh 'mvn test'
      }
      post {
        always {
          junit 'target/surefire-reports/*.xml'
          jacoco execPattern: 'target/jacoco.exec'
        }
      }
    }
    stage('Mutation Tests - PIT') {
      steps {
        sh 'mvn org.pitest:pitest-maven:mutationCoverage'
      }
      post {
        always {
          pitmutation mutationStatsFile: '**/target/pit-reports/**/mutations.xml'
        }
      }
    }
    stage('SonarQube - SAST') {
      steps {
        sh 'mvn clean package -DskipTests=true'
        archiveArtifacts artifacts: 'target/*.jar', fingerprint: true
        sh """
          mvn sonar:sonar \
            -Dsonar.projectKey=numeric-application \
            -Dsonar.host.url=http://devsecops-demo.eastus.cloudapp.azure.com:9000 \
            -Dsonar.login=${SONAR_TOKEN}
        """
      }
    }
    stage('Docker Build and Push') {
      steps {
        withDockerRegistry([credentialsId: 'docker-hub', url: '']) {
          sh 'docker build -t siddharth67/numeric-app:${GIT_COMMIT} .'
          sh 'docker push siddharth67/numeric-app:${GIT_COMMIT}'
        }
      }
    }
    // Add deployment stages below
  }
}
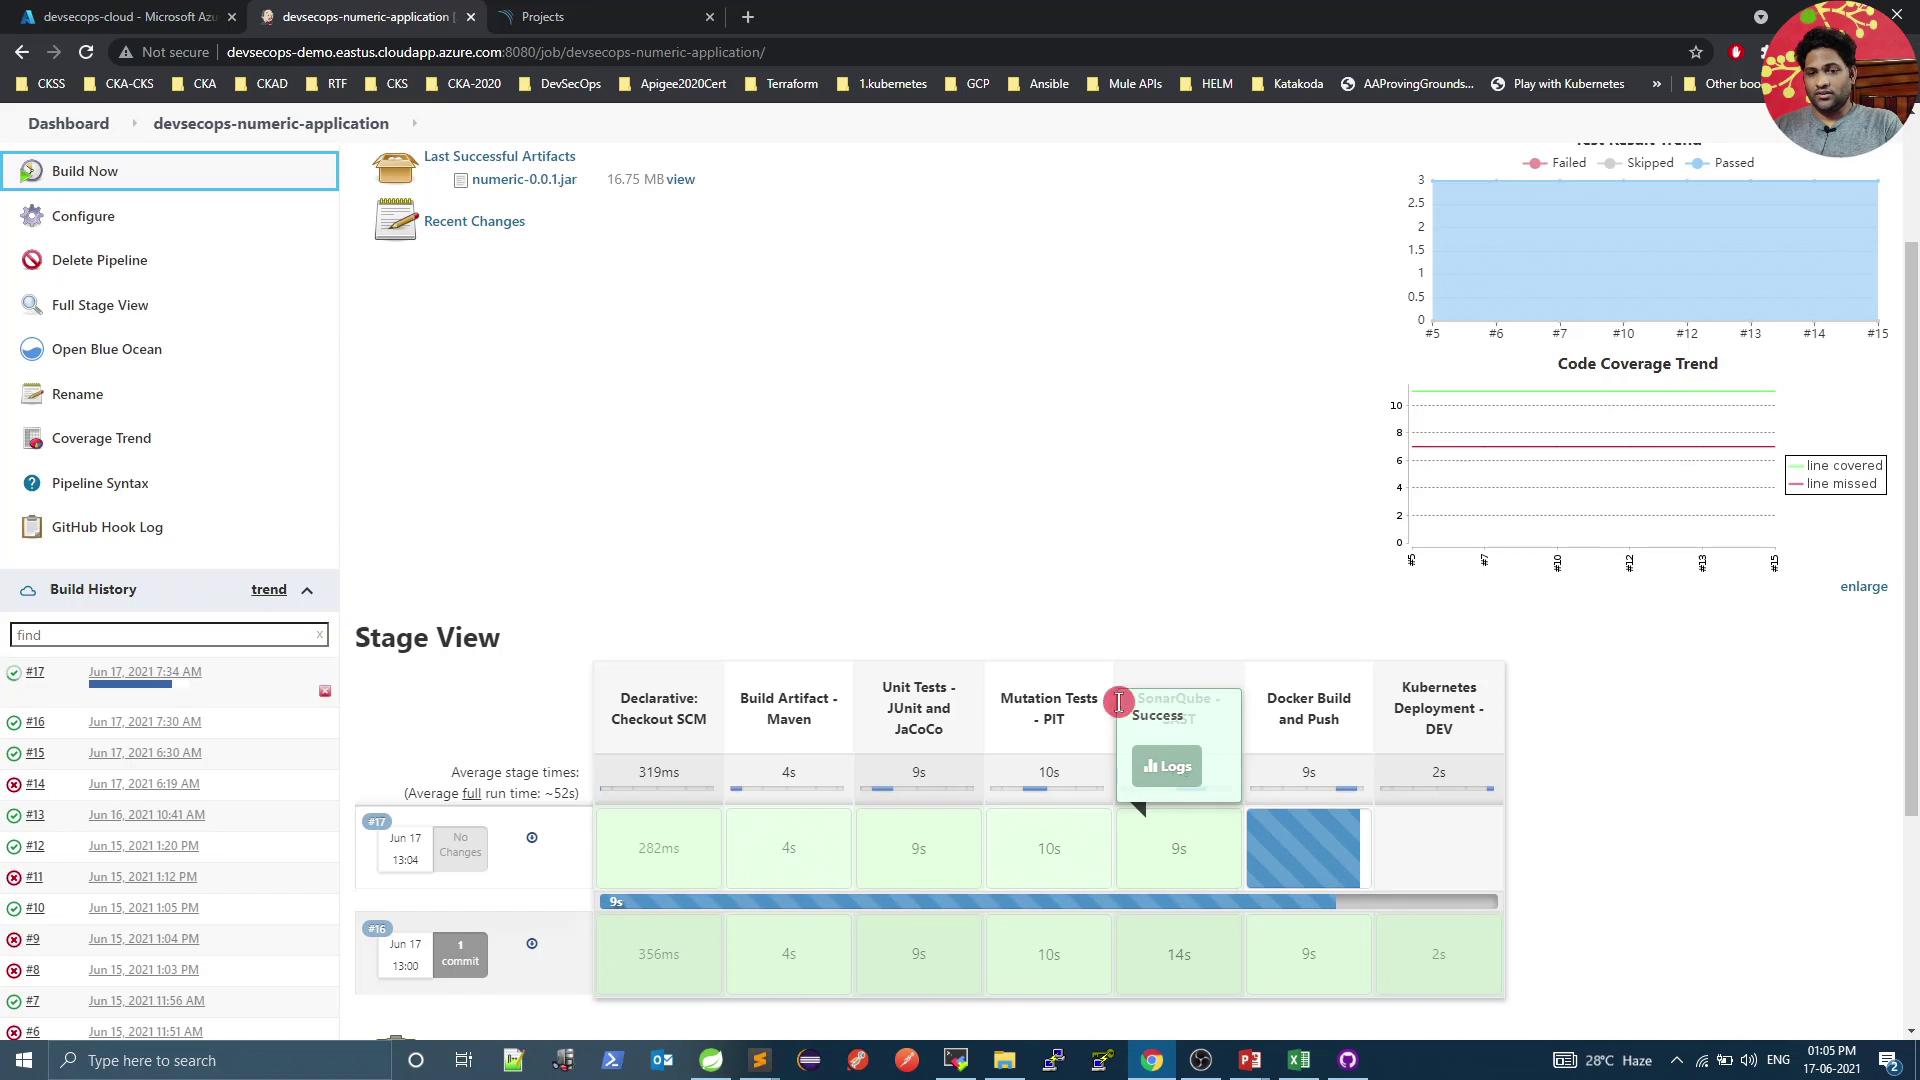
Commit and push your Jenkinsfile. Jenkins will trigger a build and execute the new SonarQube stage:
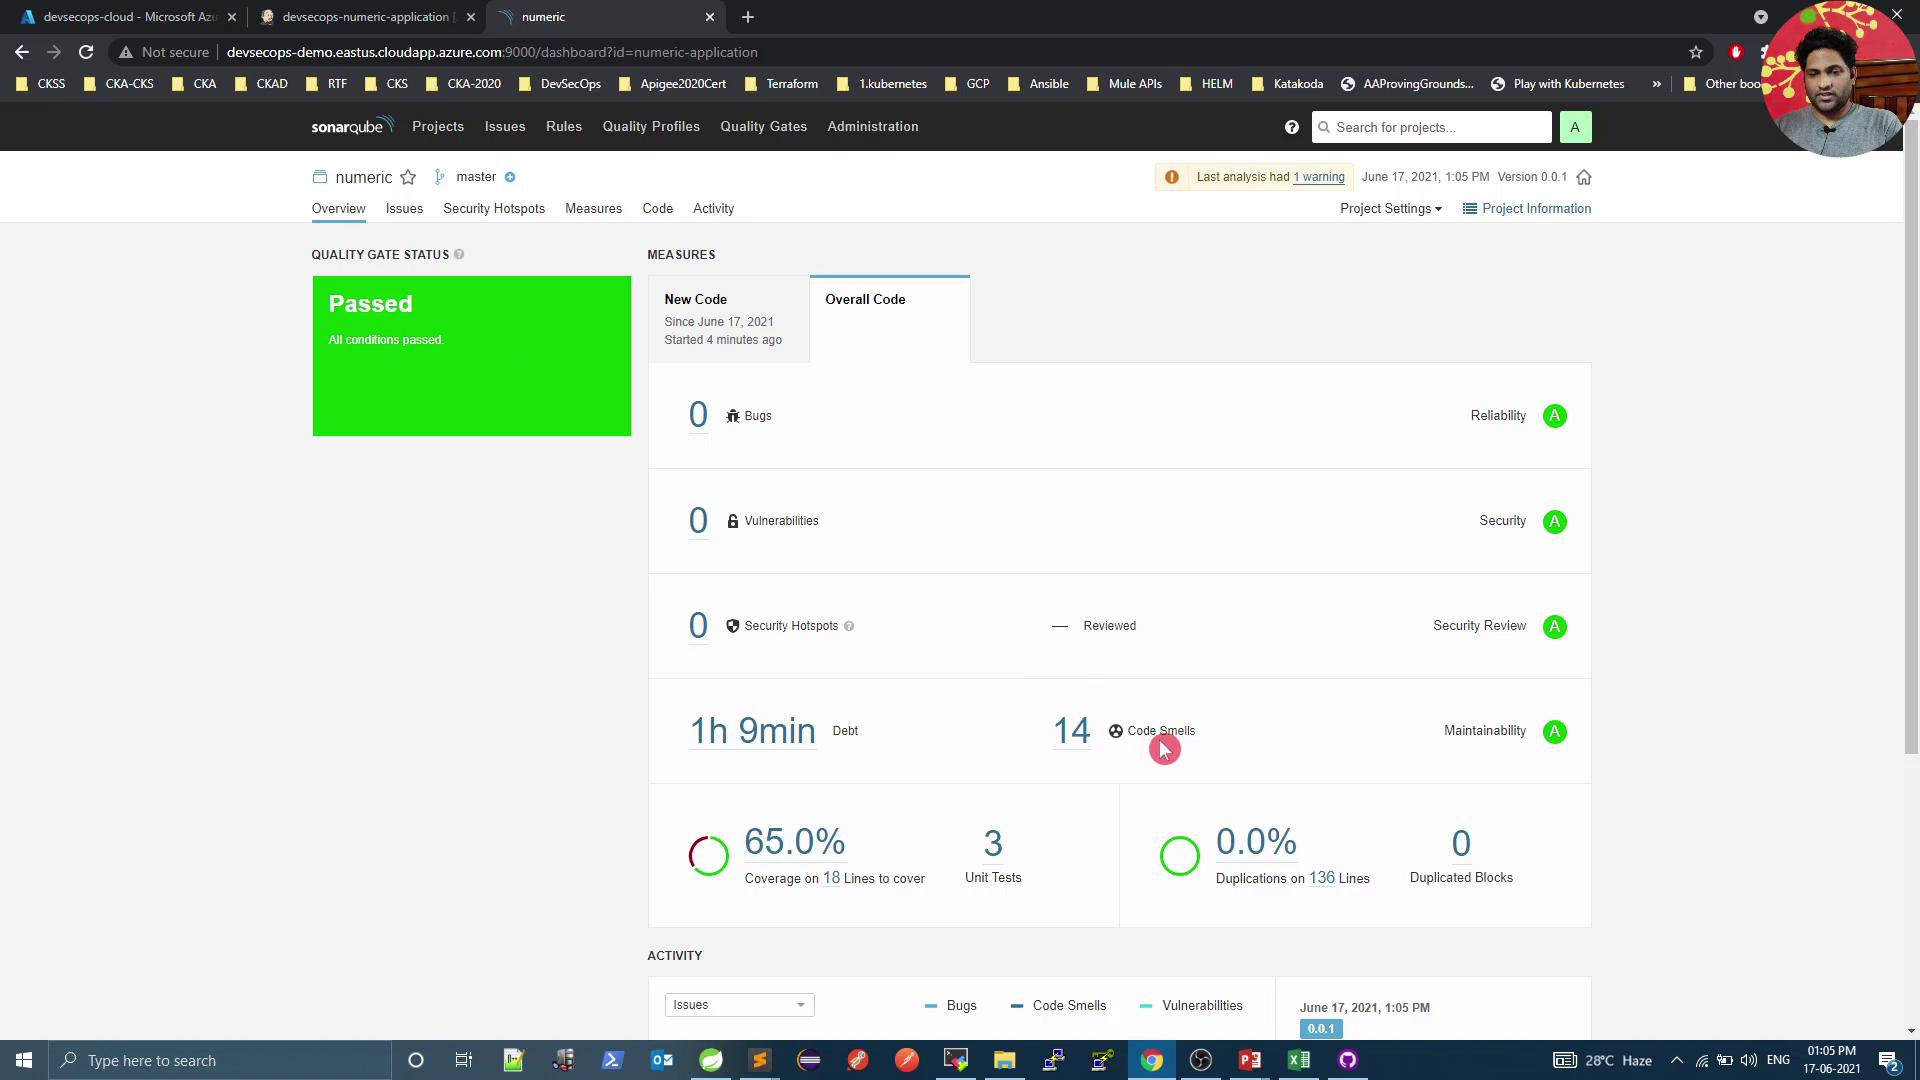
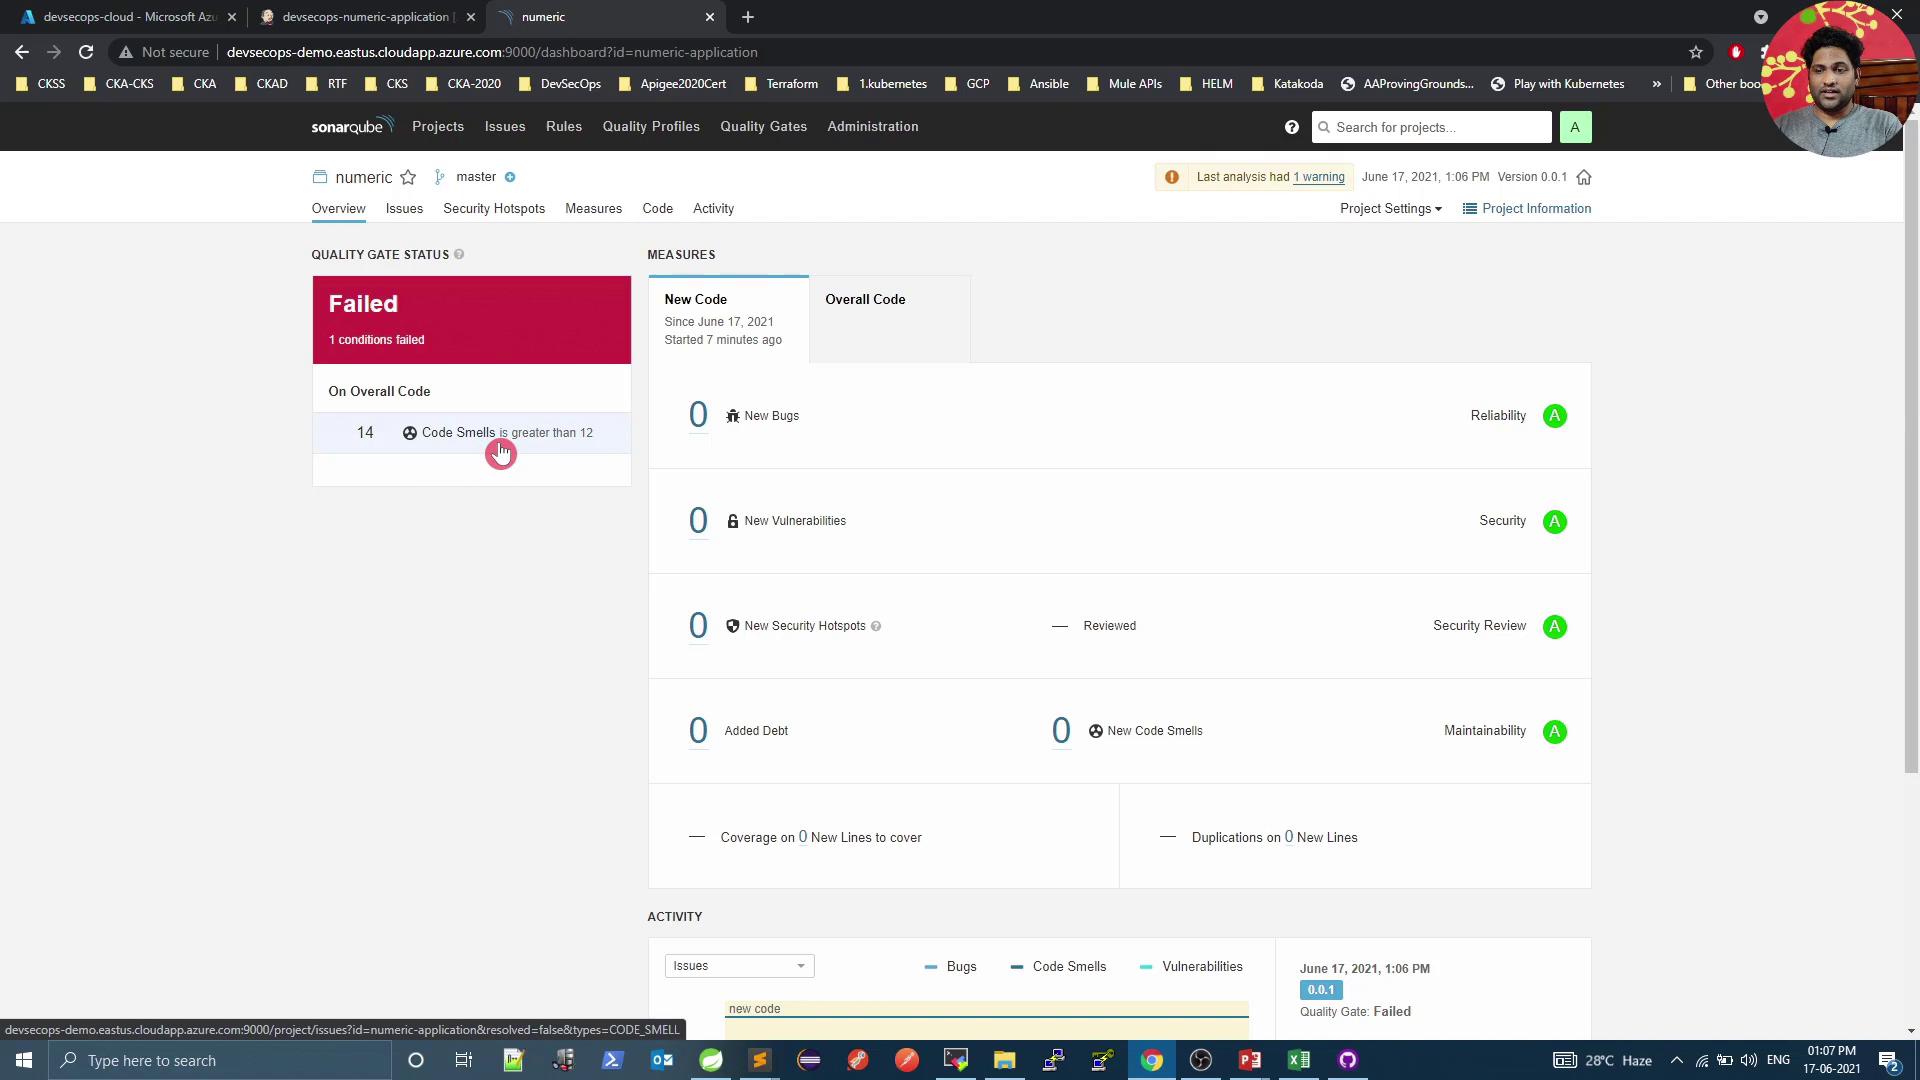
5. Review Analysis Results in SonarQube
After pipeline completion, go back to SonarQube to inspect metrics and quality gate status:
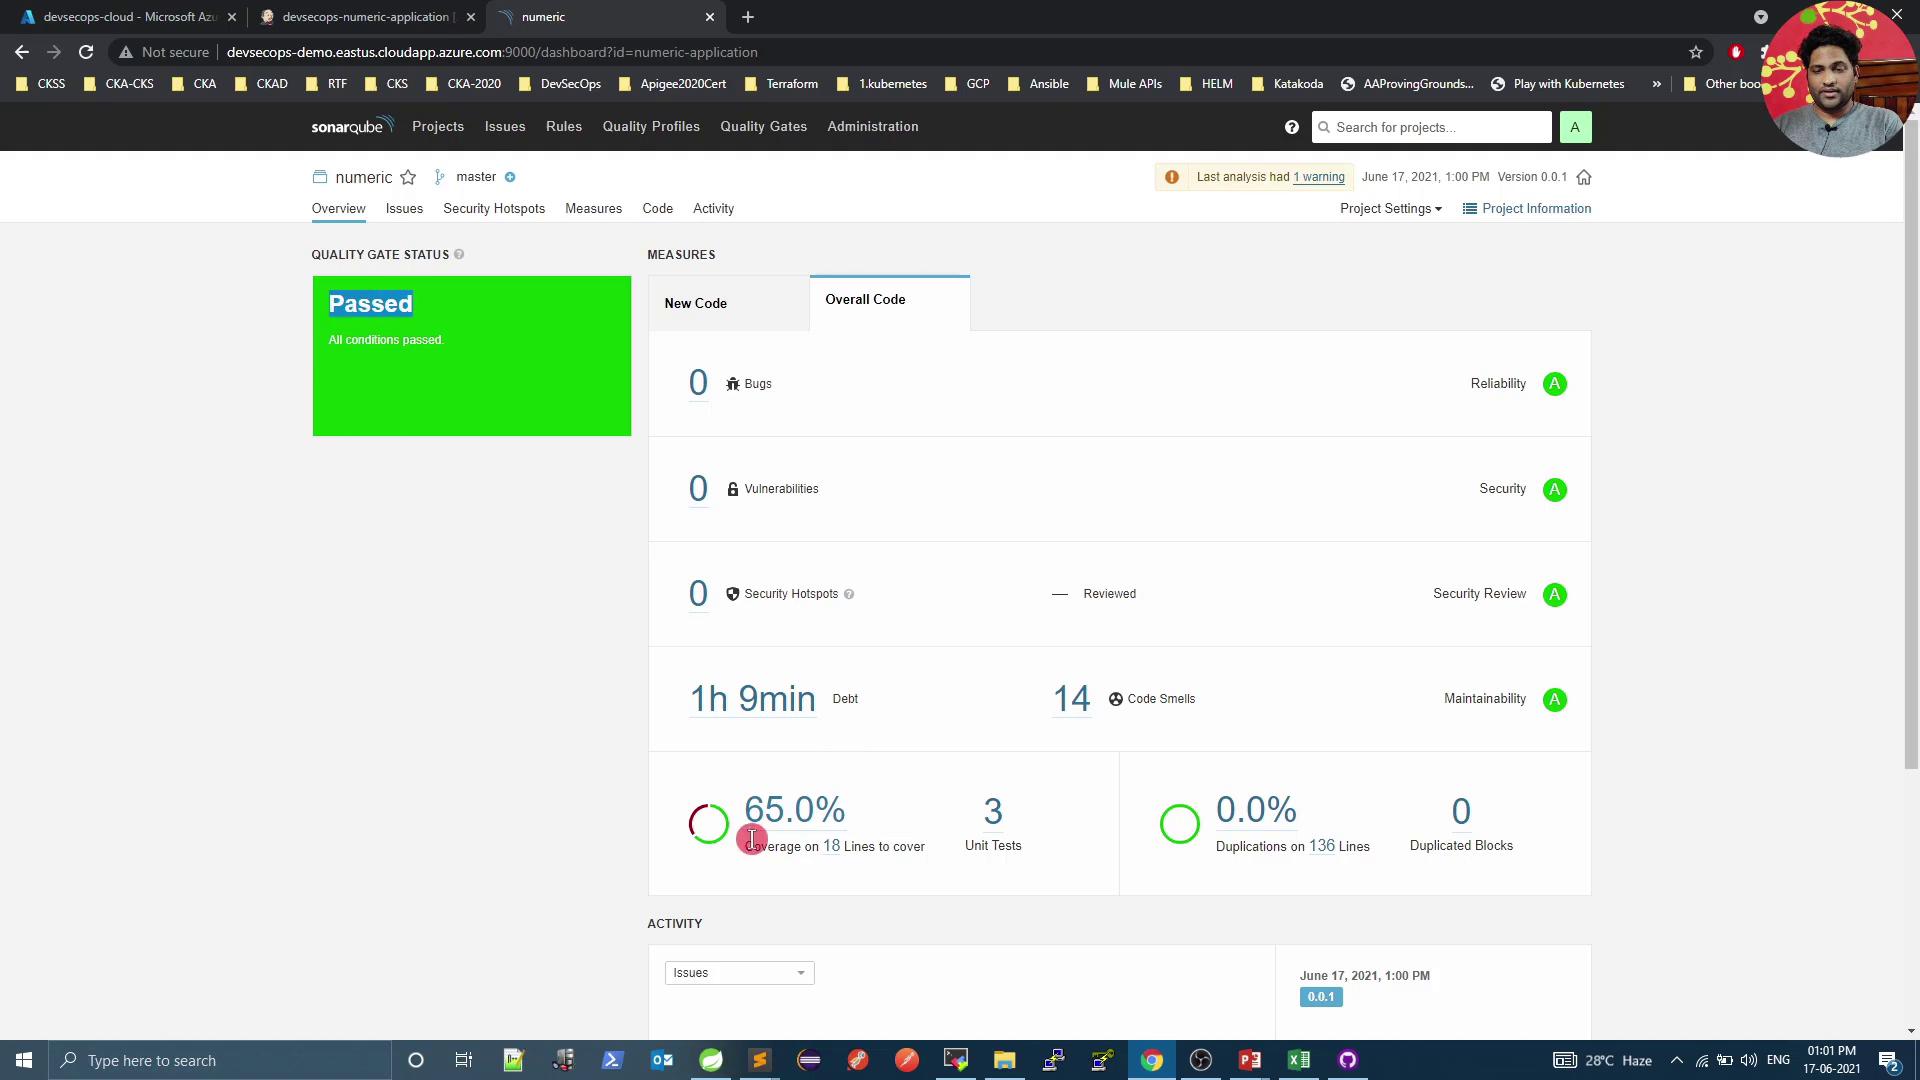
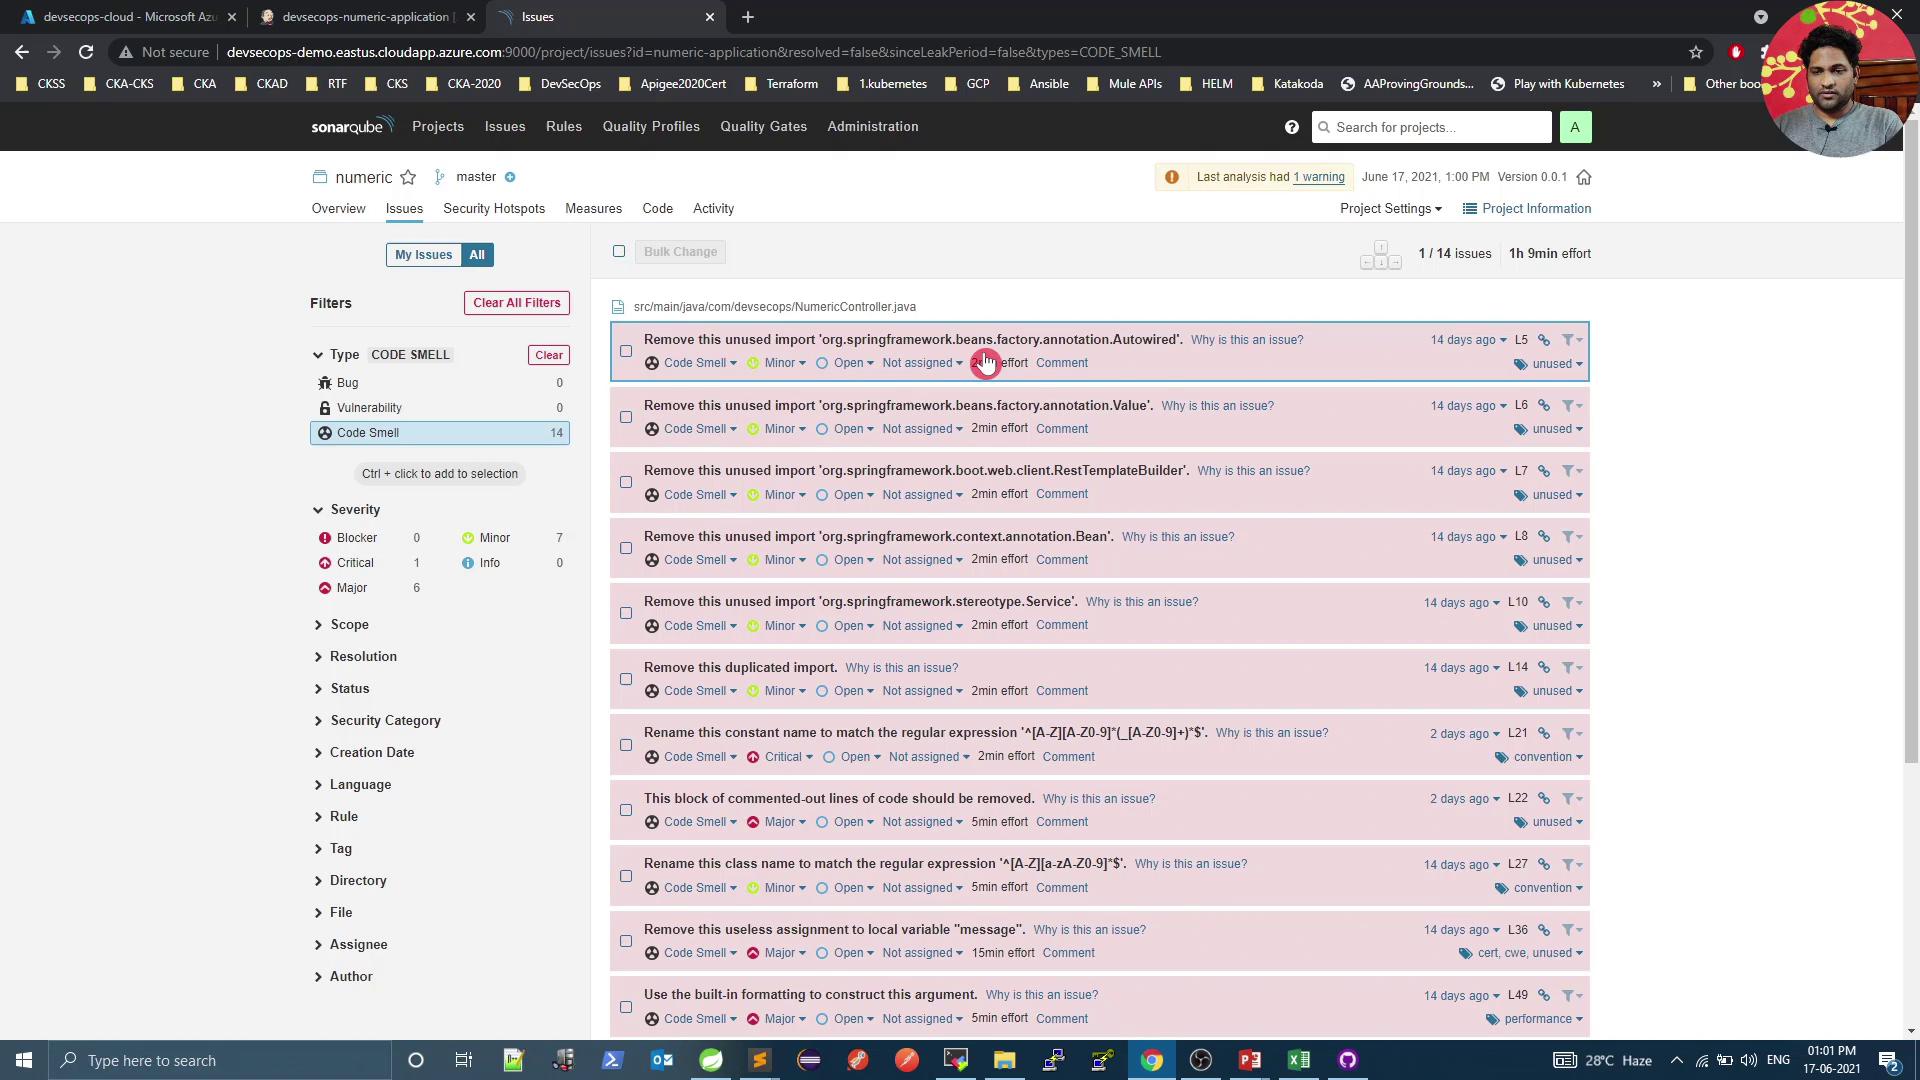
Click Code Smells to explore issues such as unused imports:
6. Enforce Custom Quality Gates
Navigate to Quality Gates to define or modify pass/fail criteria:
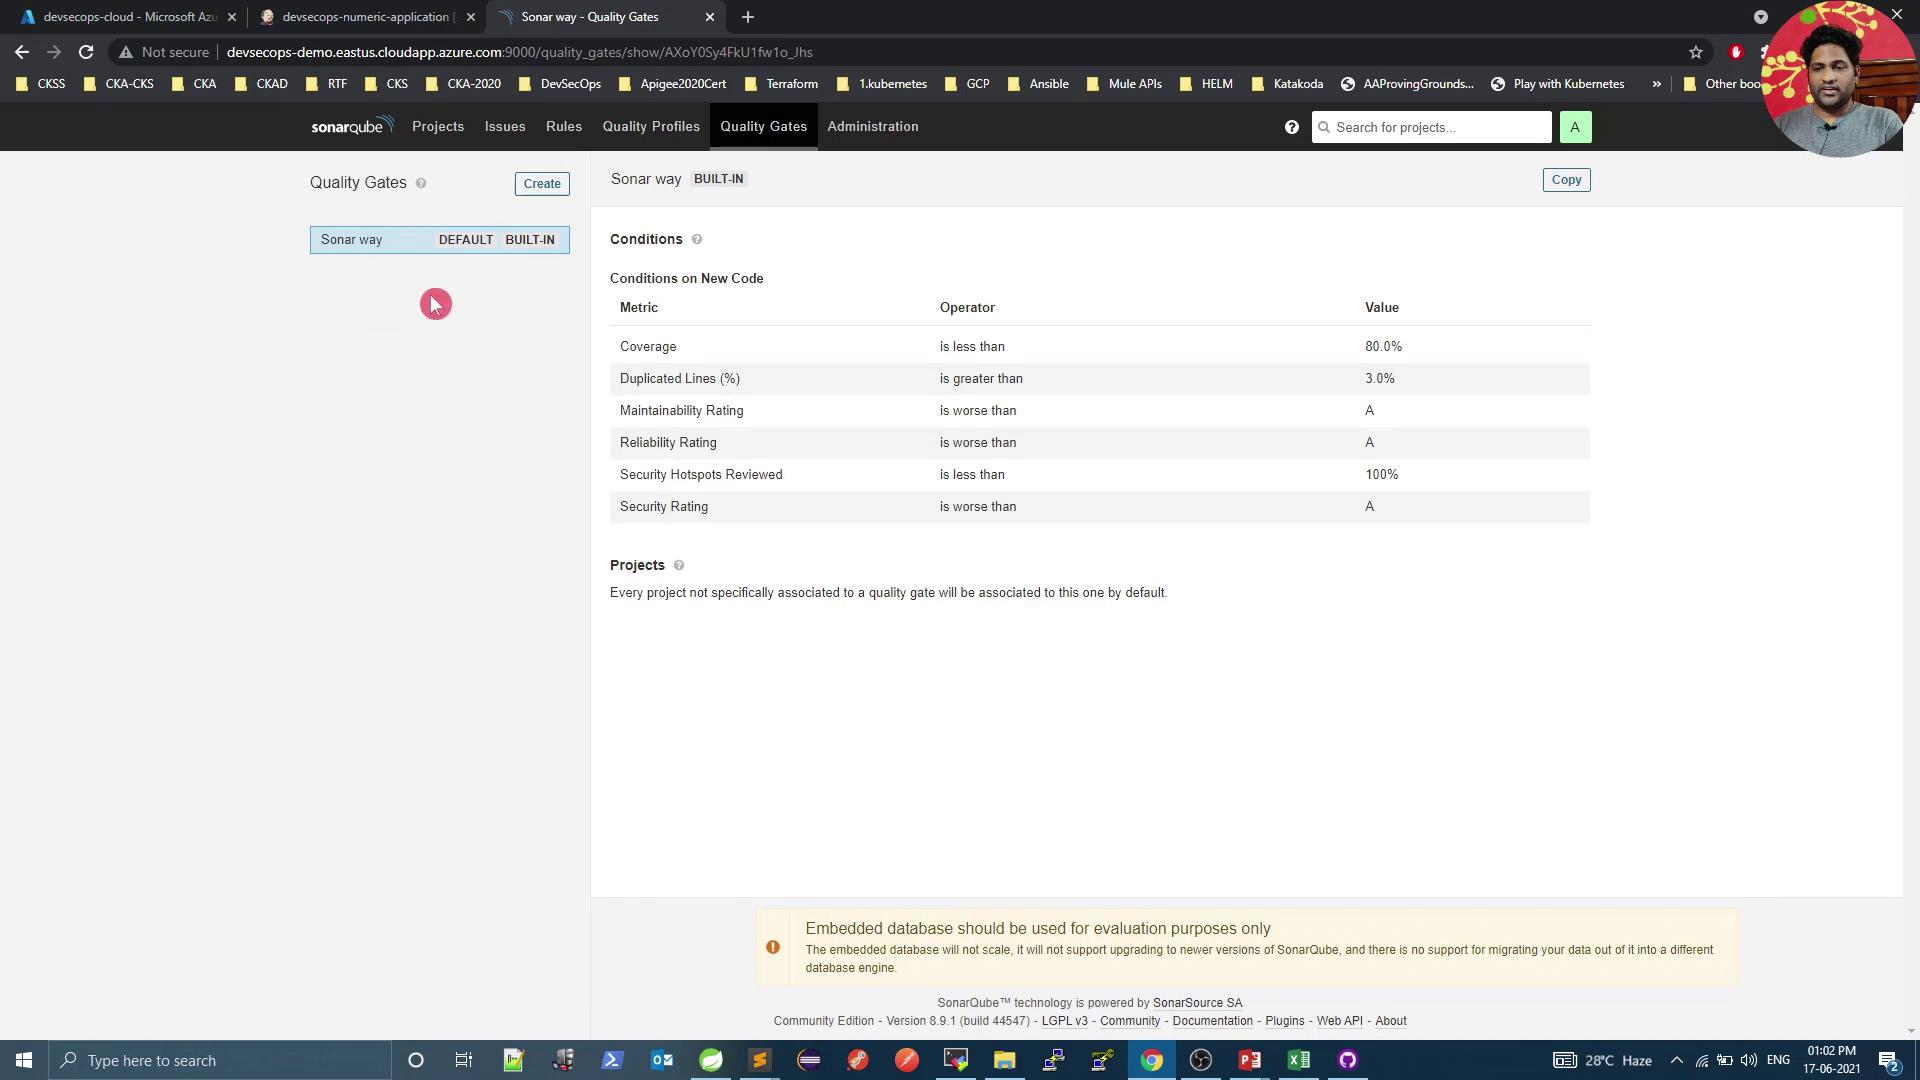
Create a new gate (e.g., Custom Quality Gate), set it as default, and add conditions:
- Overall code smells ≤ 12
- Overall coverage ≥ 60%
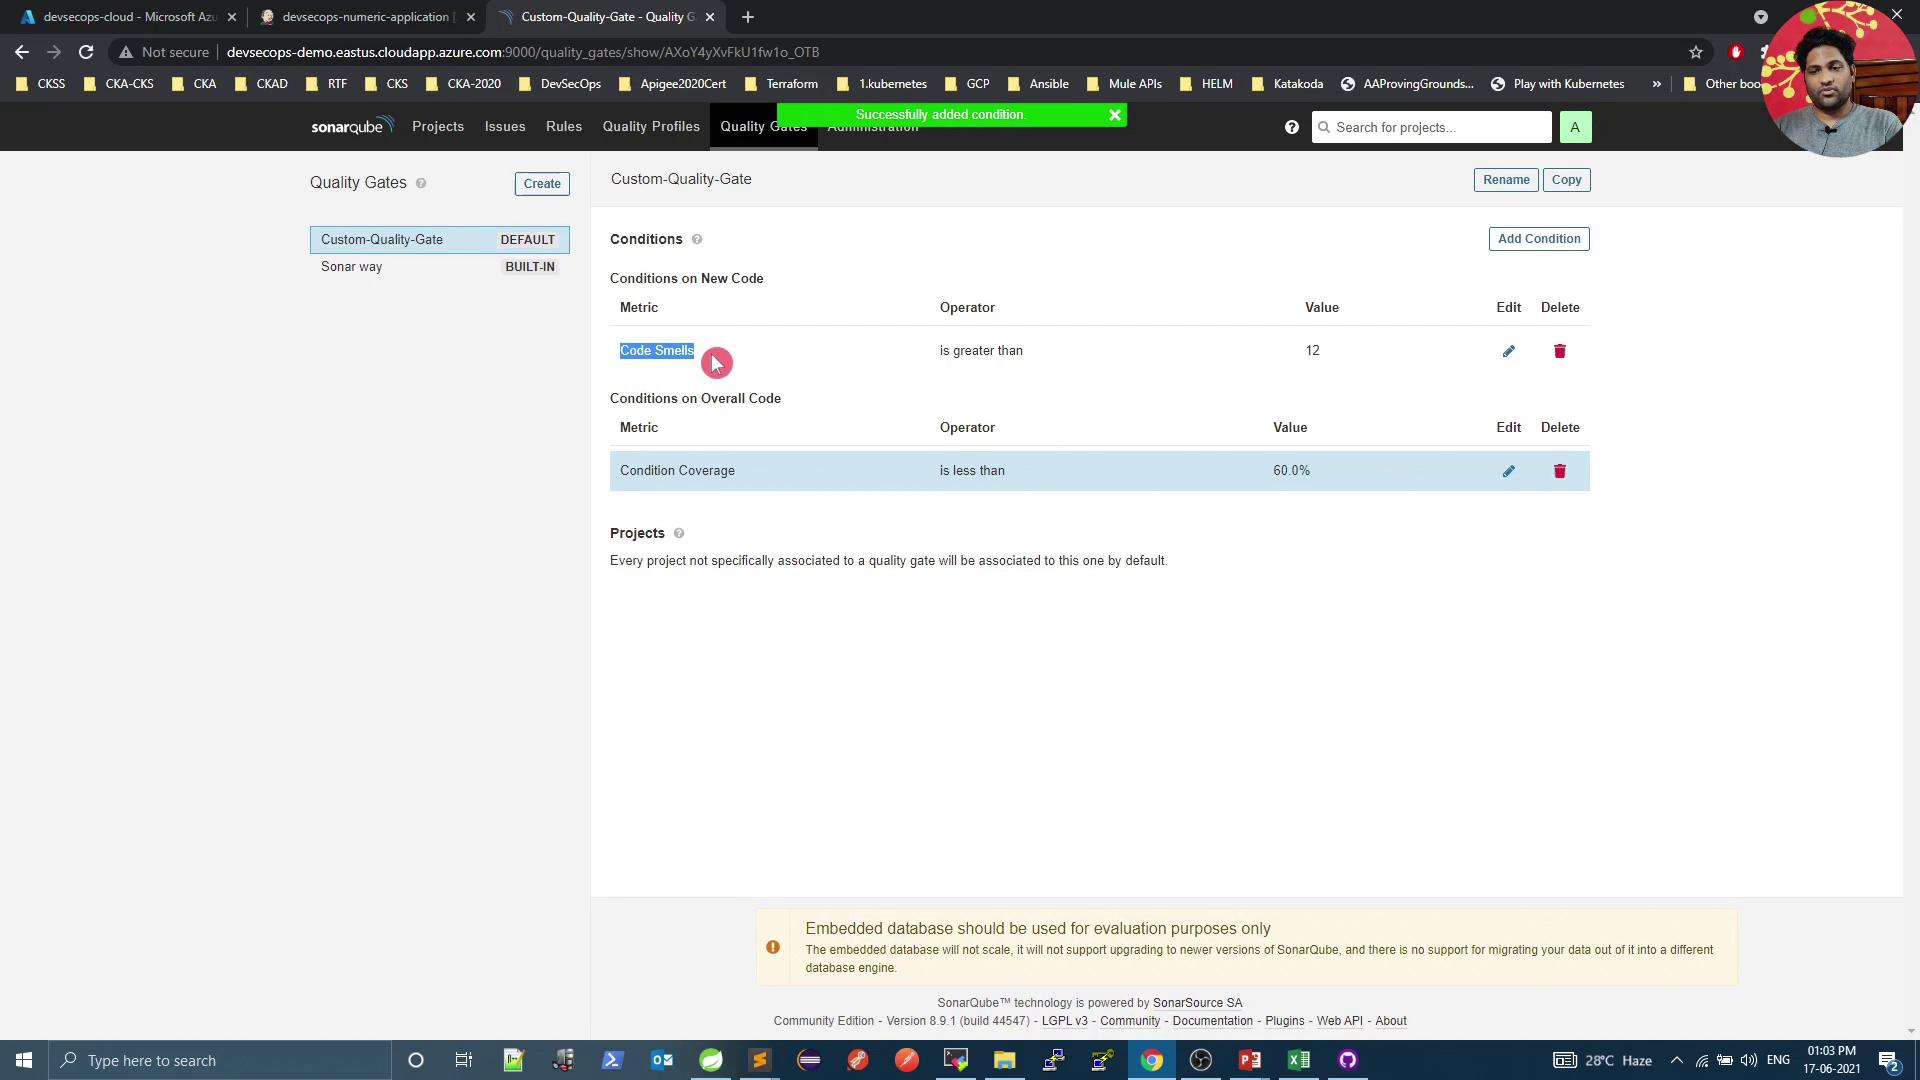
Rerun the pipeline. Initially, you may still see Passed—the first condition applies to new code only:
Adjust the code-smells condition to Overall code smells > 12:
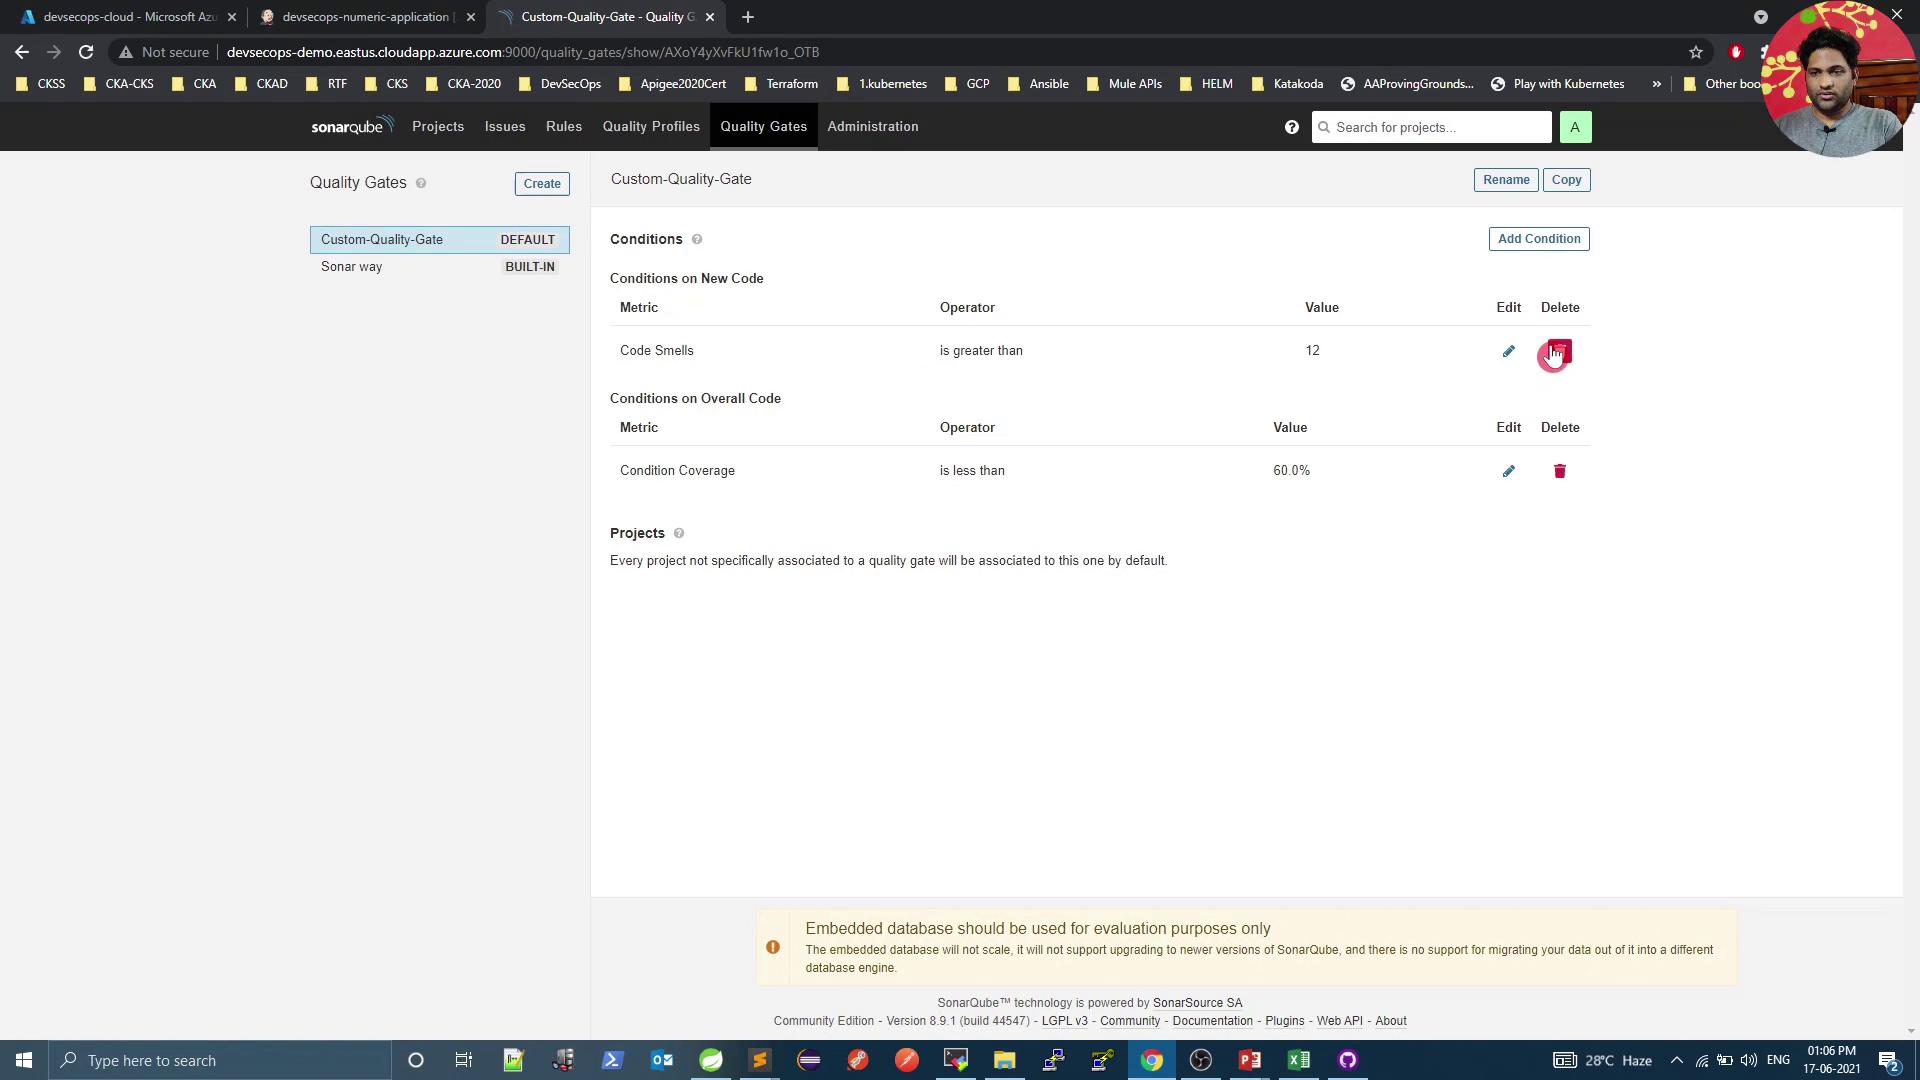
Run the pipeline again. Once SonarQube processes the report, the gate will Fail due to excessive code smells:
Note
By default, Jenkins does not fail the build on a failed quality gate. To enforce build failure, install the Quality Gate Plugin or poll the SonarQube REST API in your pipeline.
References
Watch Video
Watch video content