- Exposing Grafana & Prometheus via NodePort
- Querying metrics with Prometheus (PromQL)
- Visualizing Istio data in Grafana dashboards
- Configuring alerting channels in Grafana
- Defining Prometheus alert rules and using Alertmanager
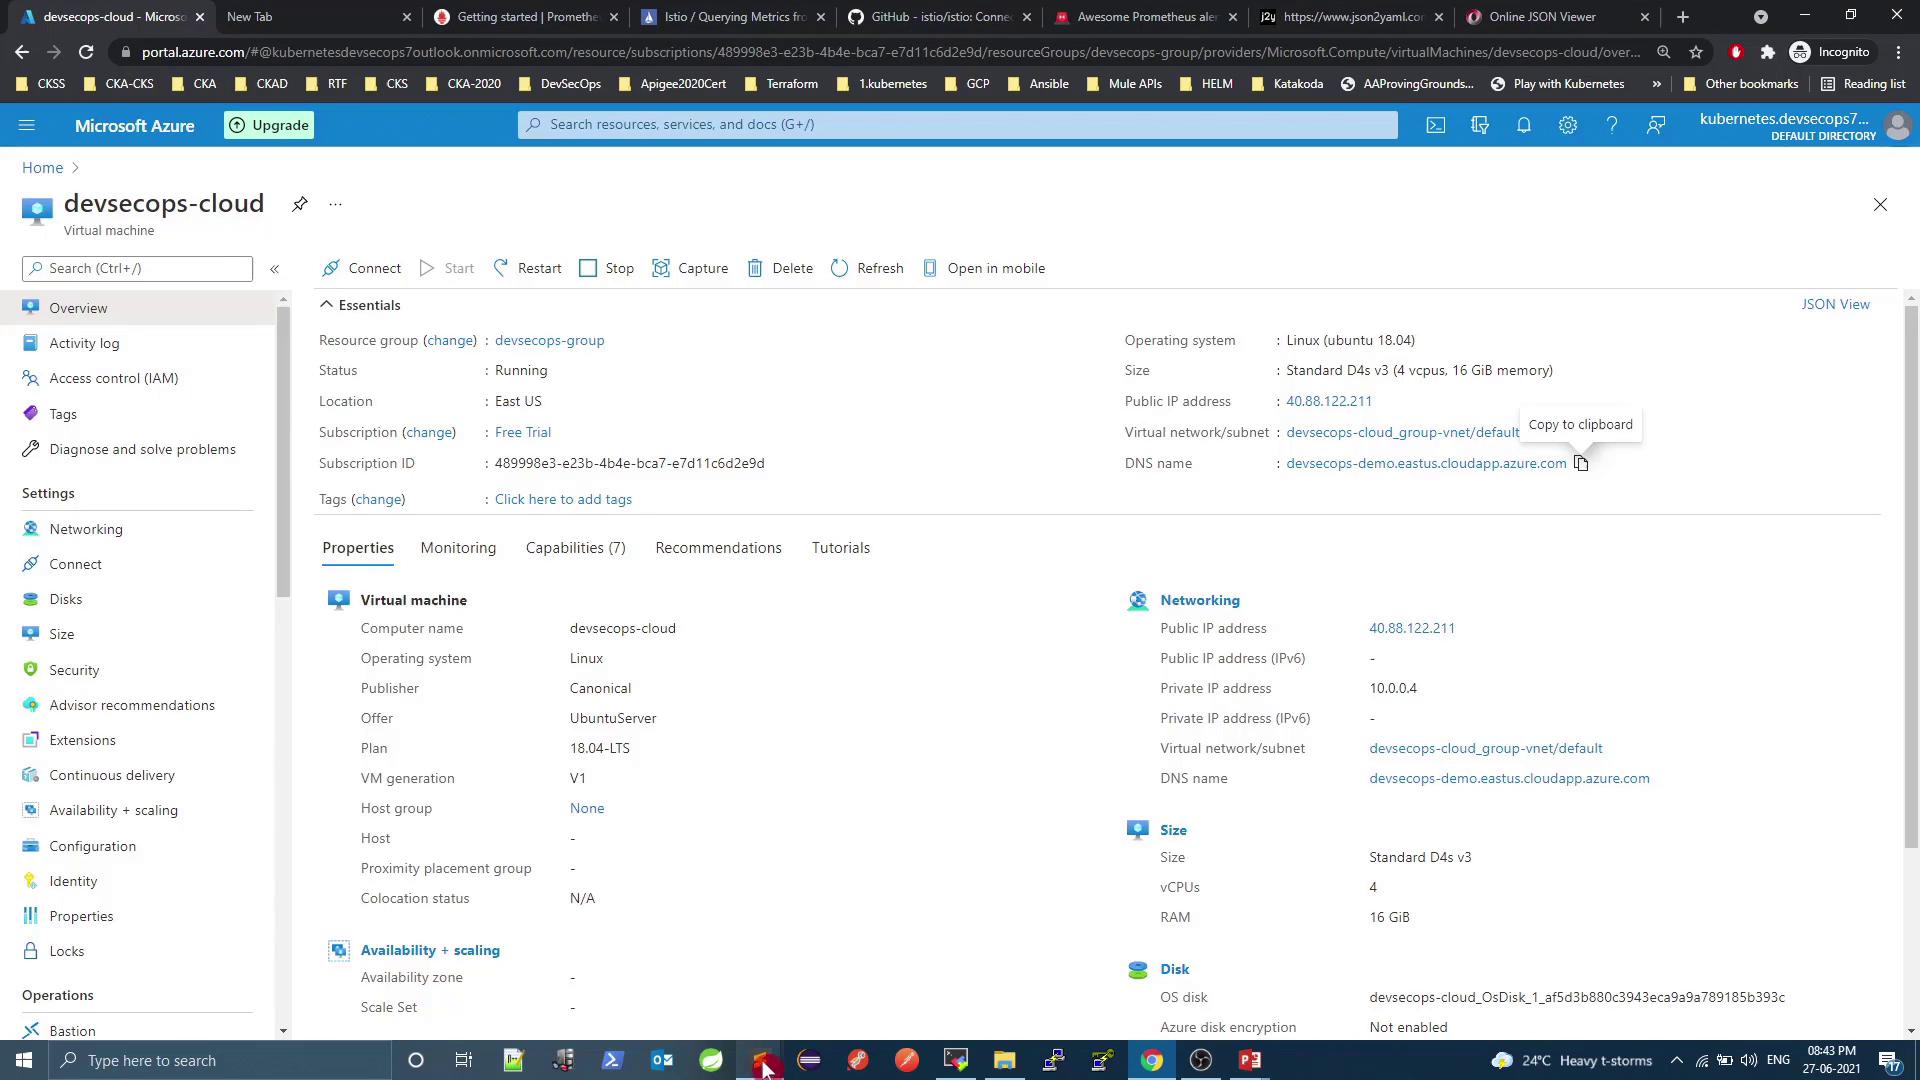
1. Exposing Grafana & Prometheus
By default, both services are deployed asClusterIP, which prevents external access. To view dashboards from outside the cluster, change the Service type to NodePort.
| Service | Default Type | NodePort Port | Access URL |
|---|---|---|---|
| Grafana | ClusterIP | 3000:32556 | http://<VM_PUBLIC_DNS>:32556 |
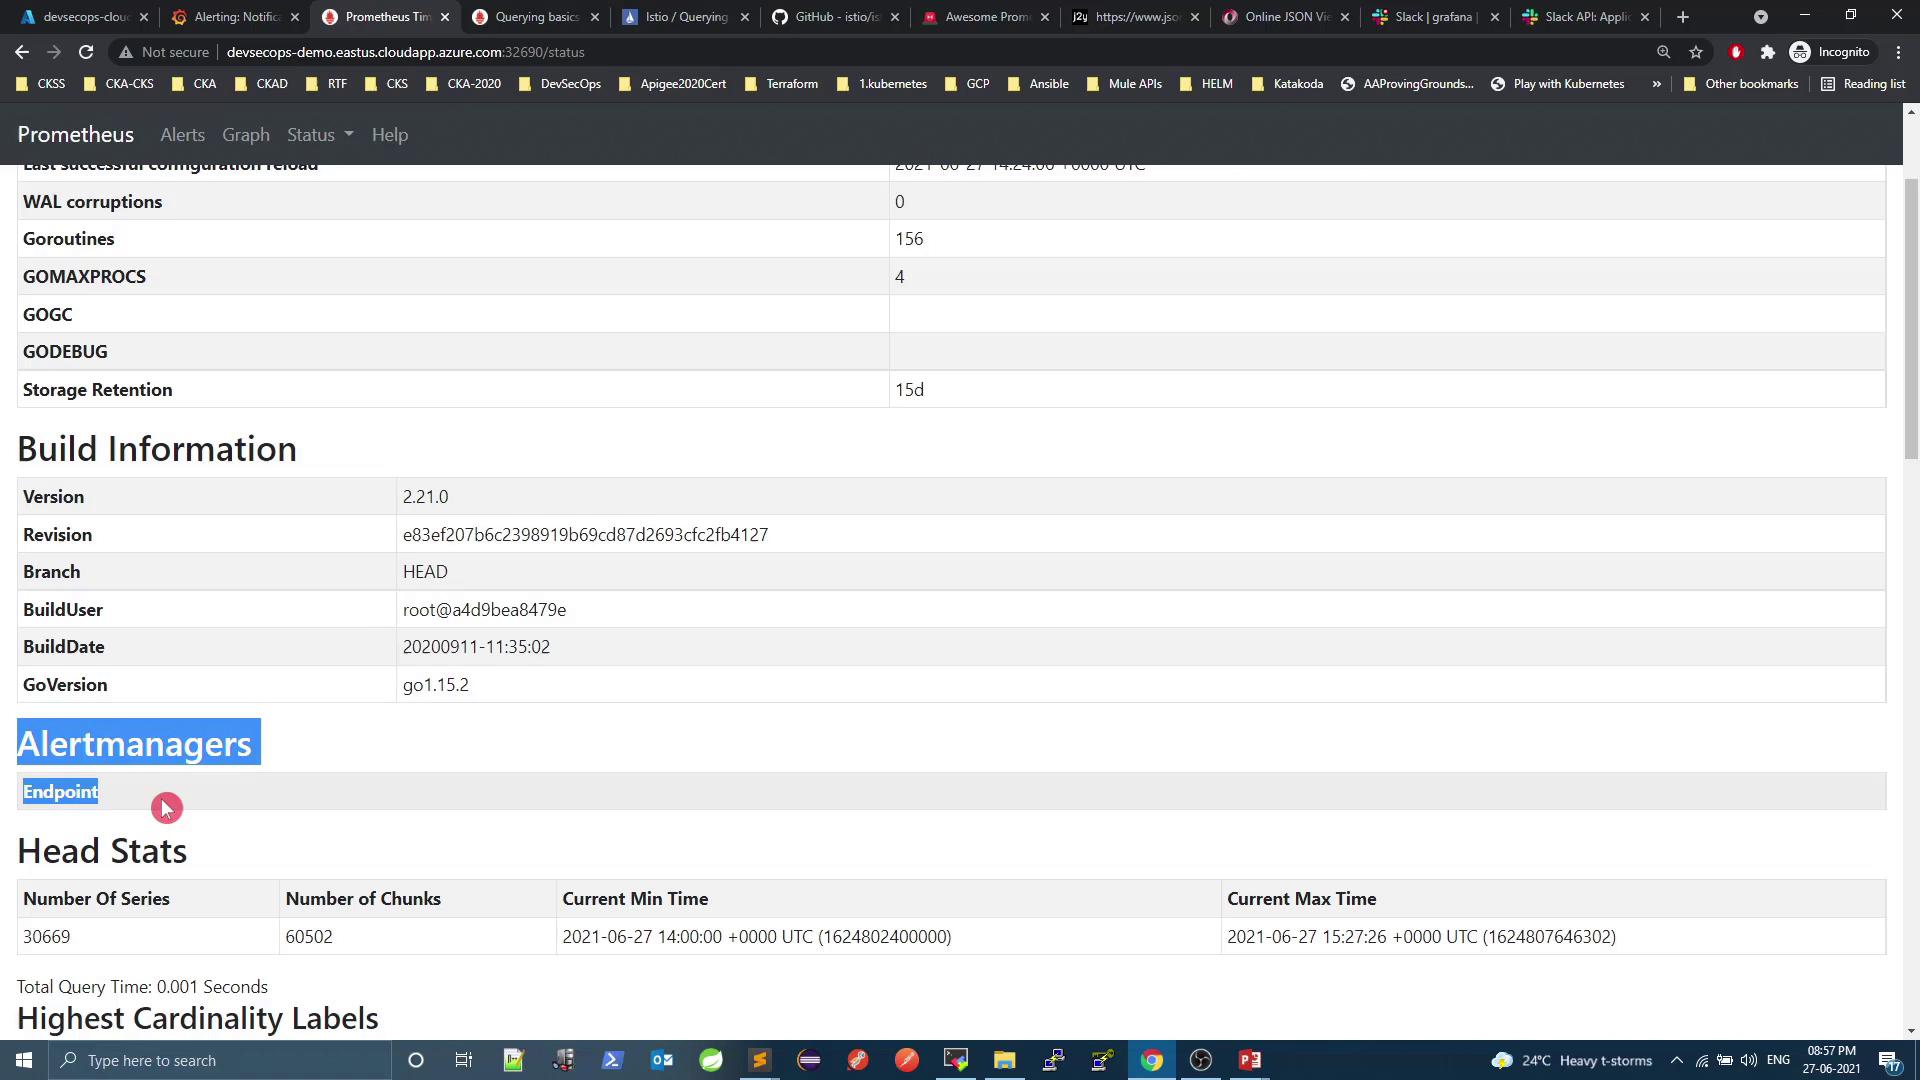
| Prometheus | NodePort | 9090:32690 | http://<VM_PUBLIC_DNS>:32690 |
A
NodePort service maps a port on each node’s IP to your service, allowing external HTTP/S access without an Ingress.1.1 Expose Grafana
Check current services:type: NodePort:
http://\<VM_PUBLIC_DNS>:32556.Prometheus is already listening on
http://\<VM_PUBLIC_DNS>:32690.
2. Exploring Metrics with Prometheus
Prometheus scrapes metrics at intervals defined inprometheus.yml:
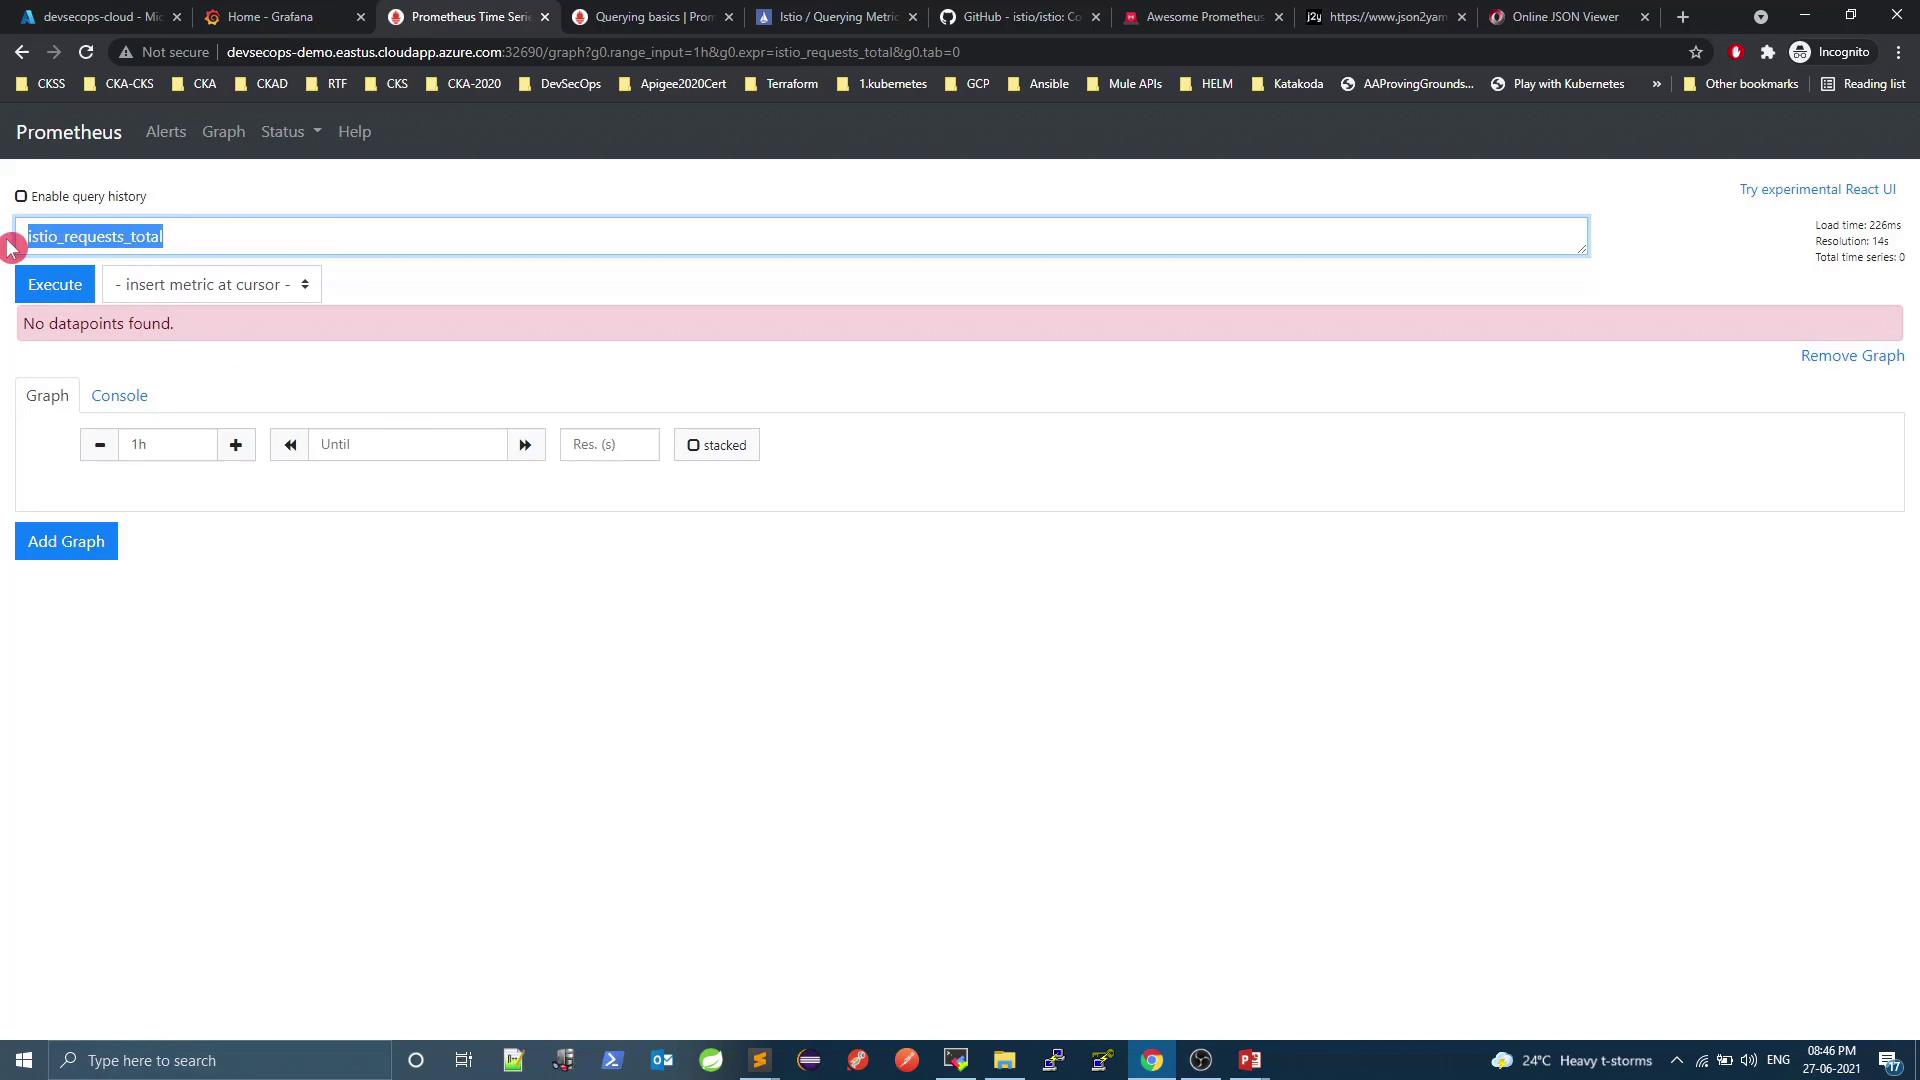
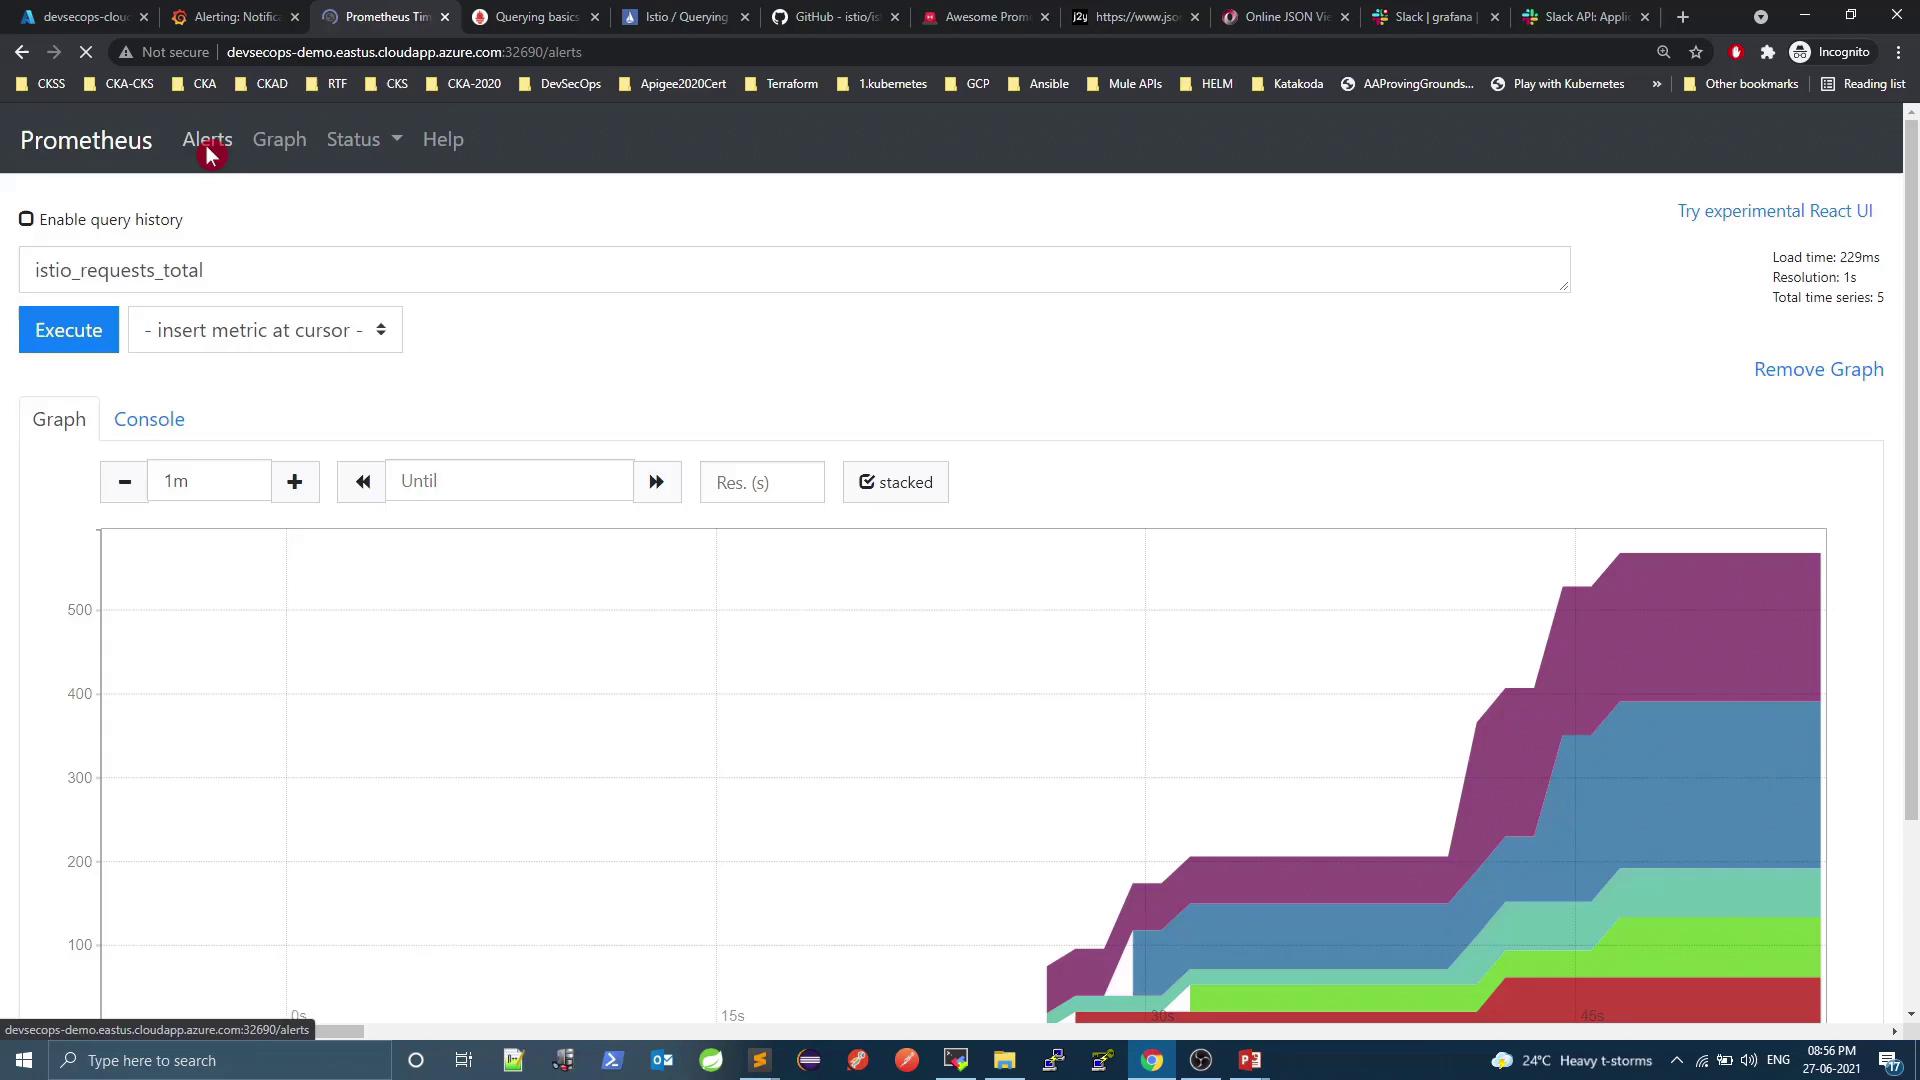
2.1 Generating Traffic
To populate metrics, send continuous HTTP requests via the Istio Ingress Gateway:This loop will run indefinitely until you stop it (
Ctrl+C). Ensure you target the correct host and port to avoid unintended load.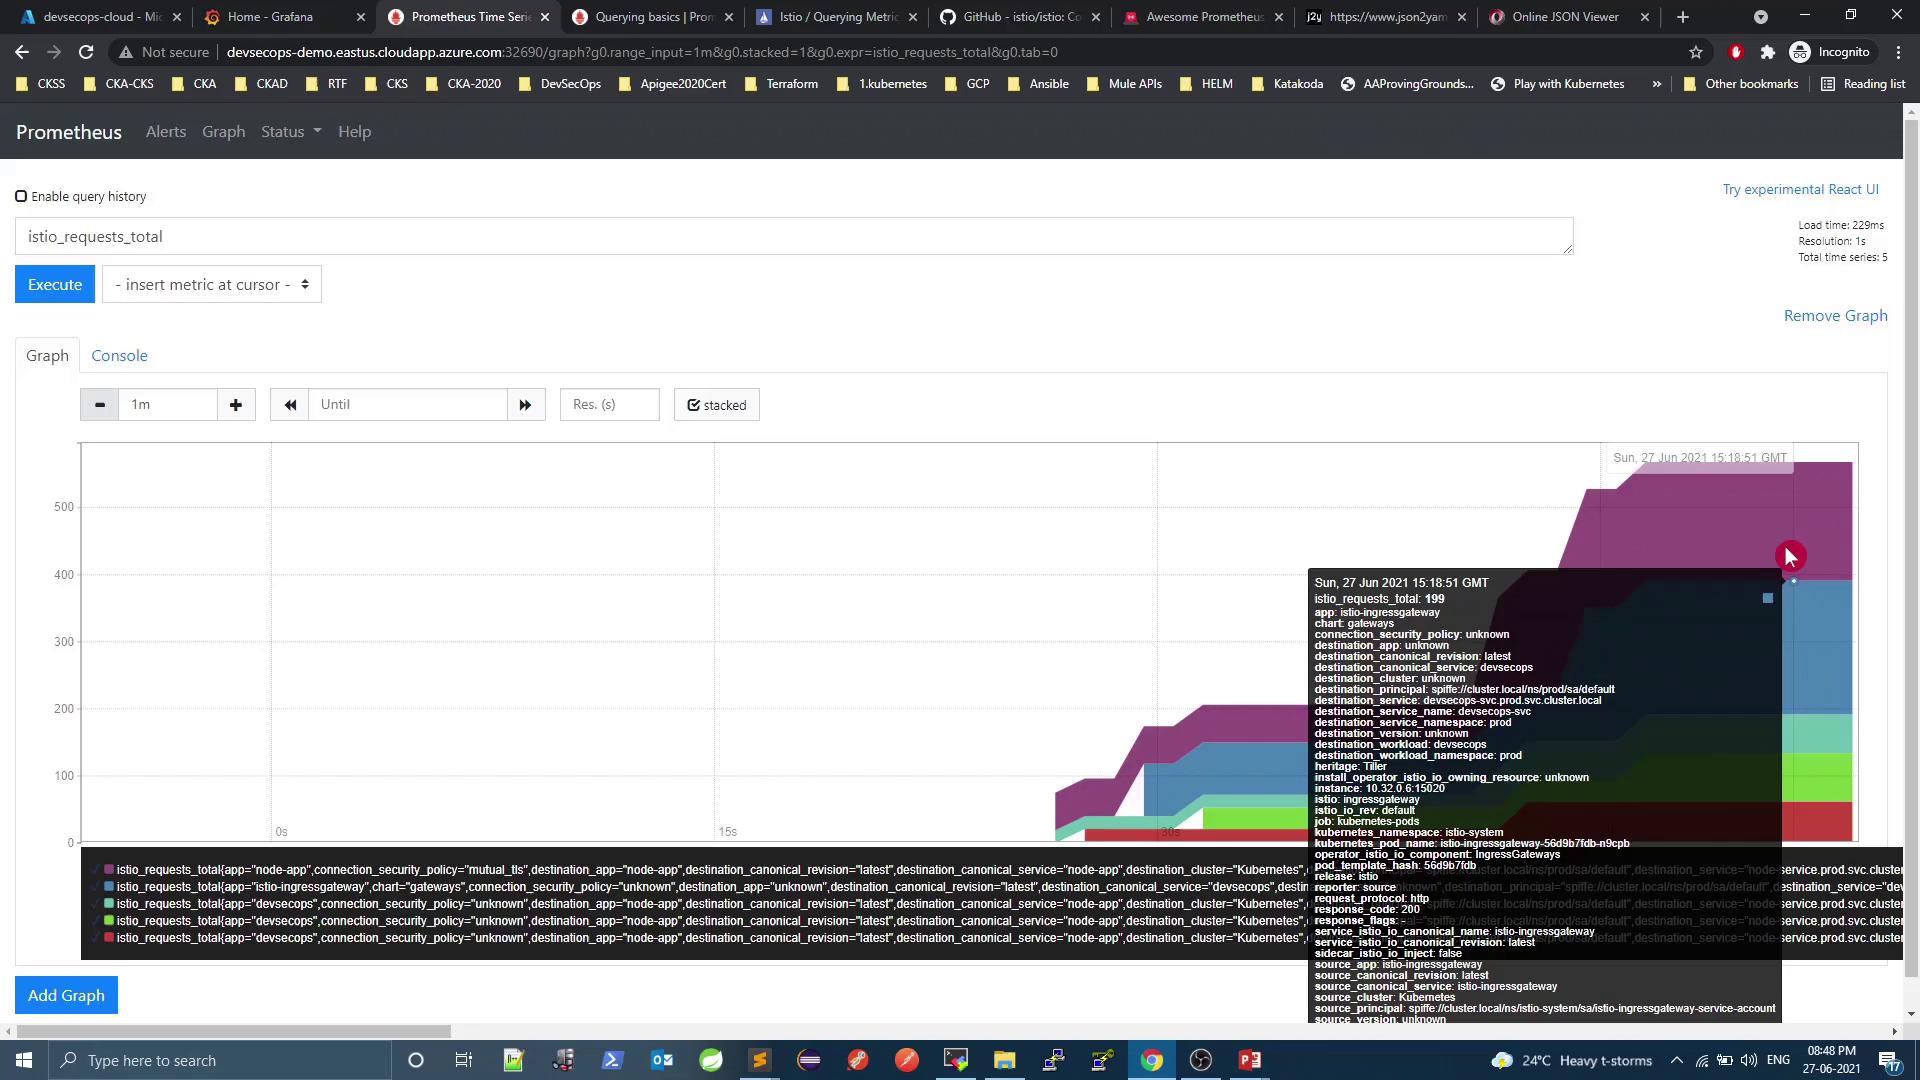
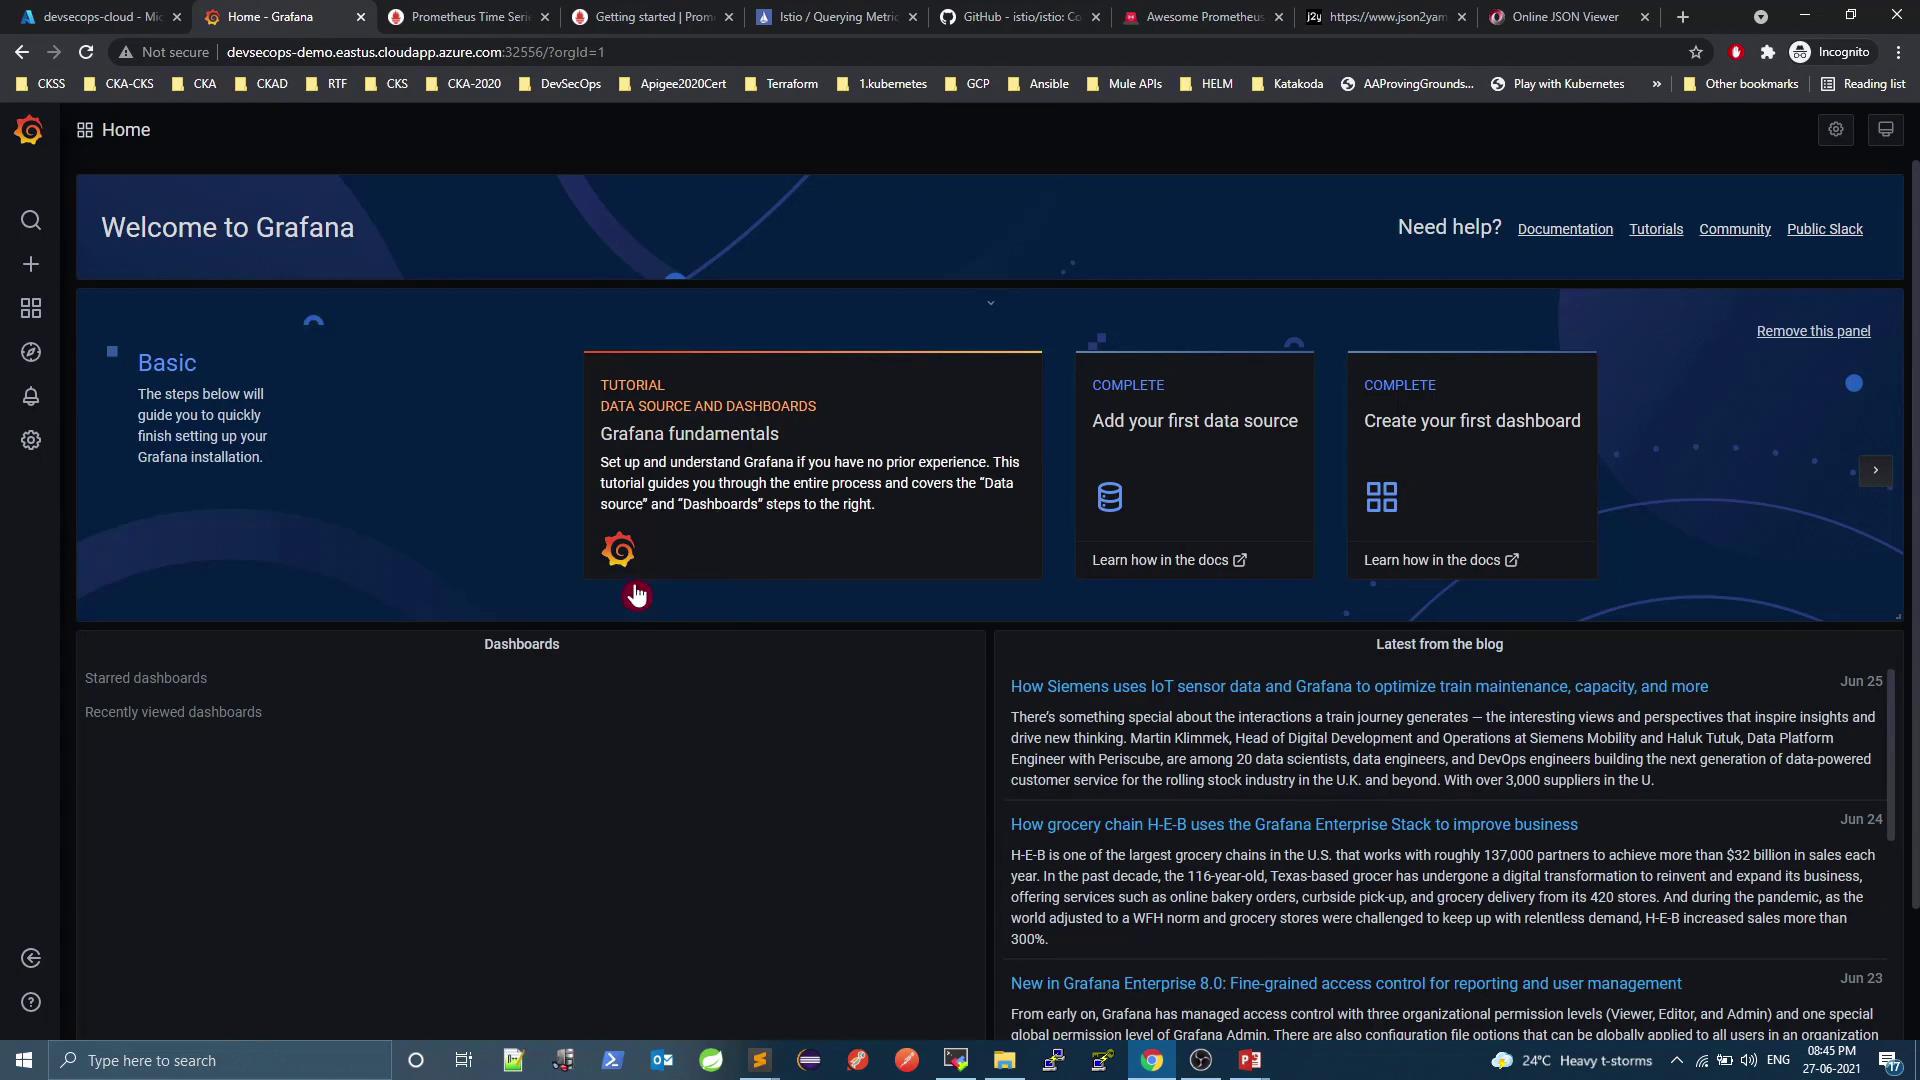
3. Visualizing Data in Grafana
Grafana provides prebuilt dashboards for Istio monitoring. Log in athttp://\<VM_PUBLIC_DNS>:32556, then configure your data source (Prometheus) and explore:
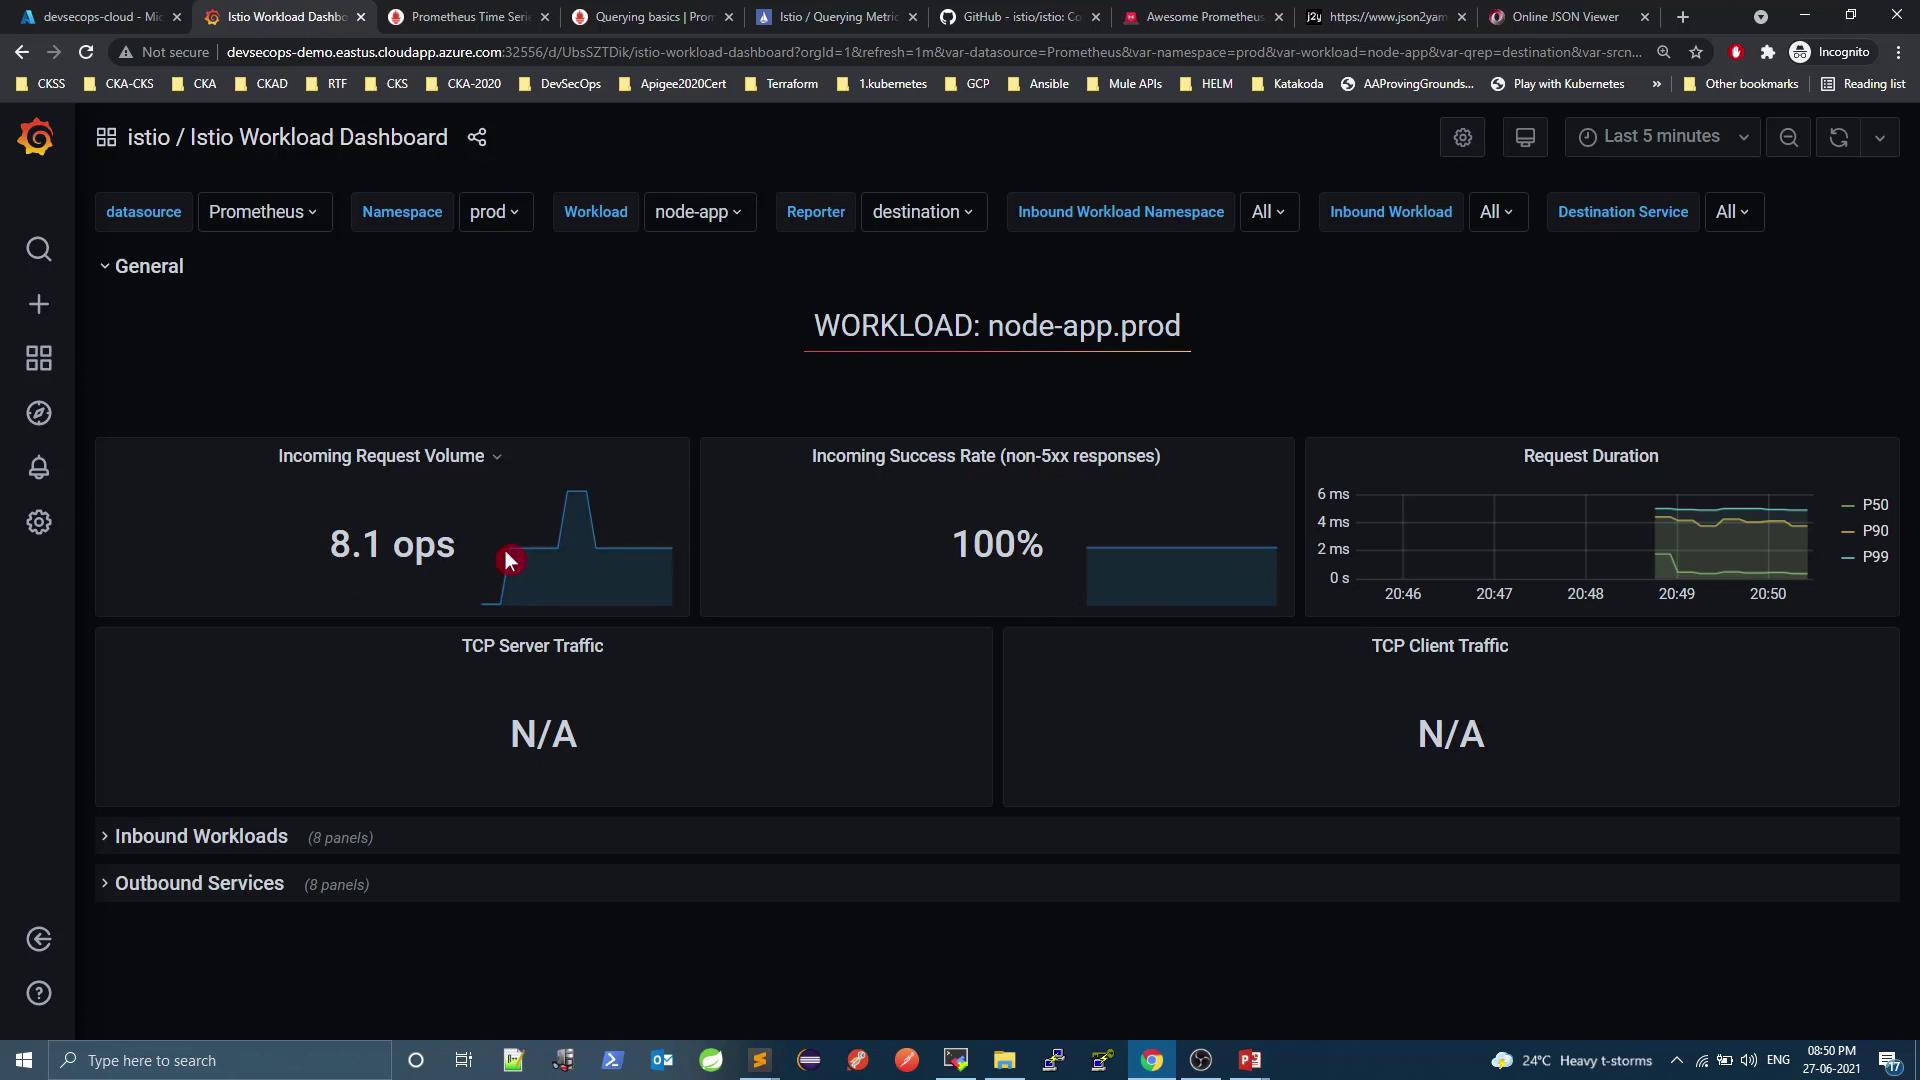
3.1 Istio Workload Dashboard
Shows per‐workload metrics (request rate, success rate, latency). Example fornode-app.prod:
3.2 Inbound Workloads
Detailed inbound metrics: request/response sizes, mTLS usage, error rates: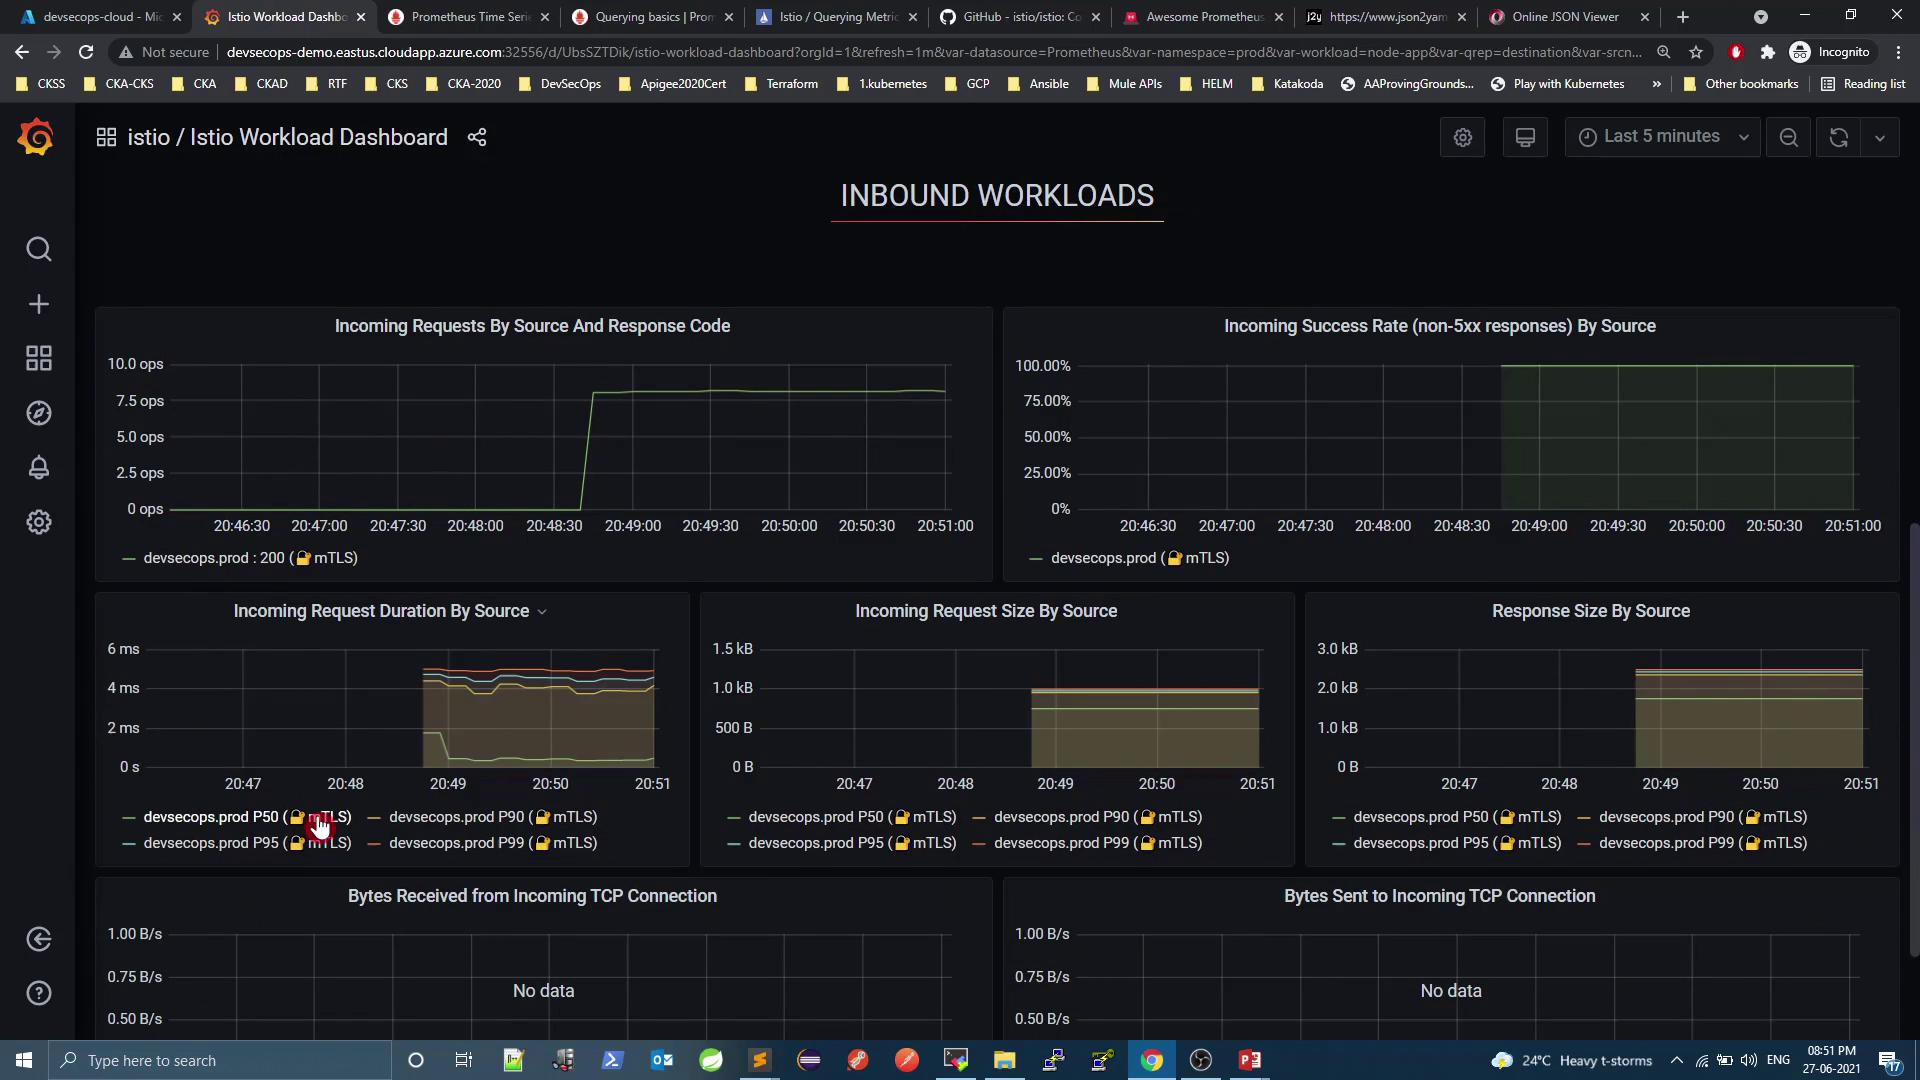
3.3 Mesh Dashboard
Get global insights: overall request volume, success rate, virtual services, gateways: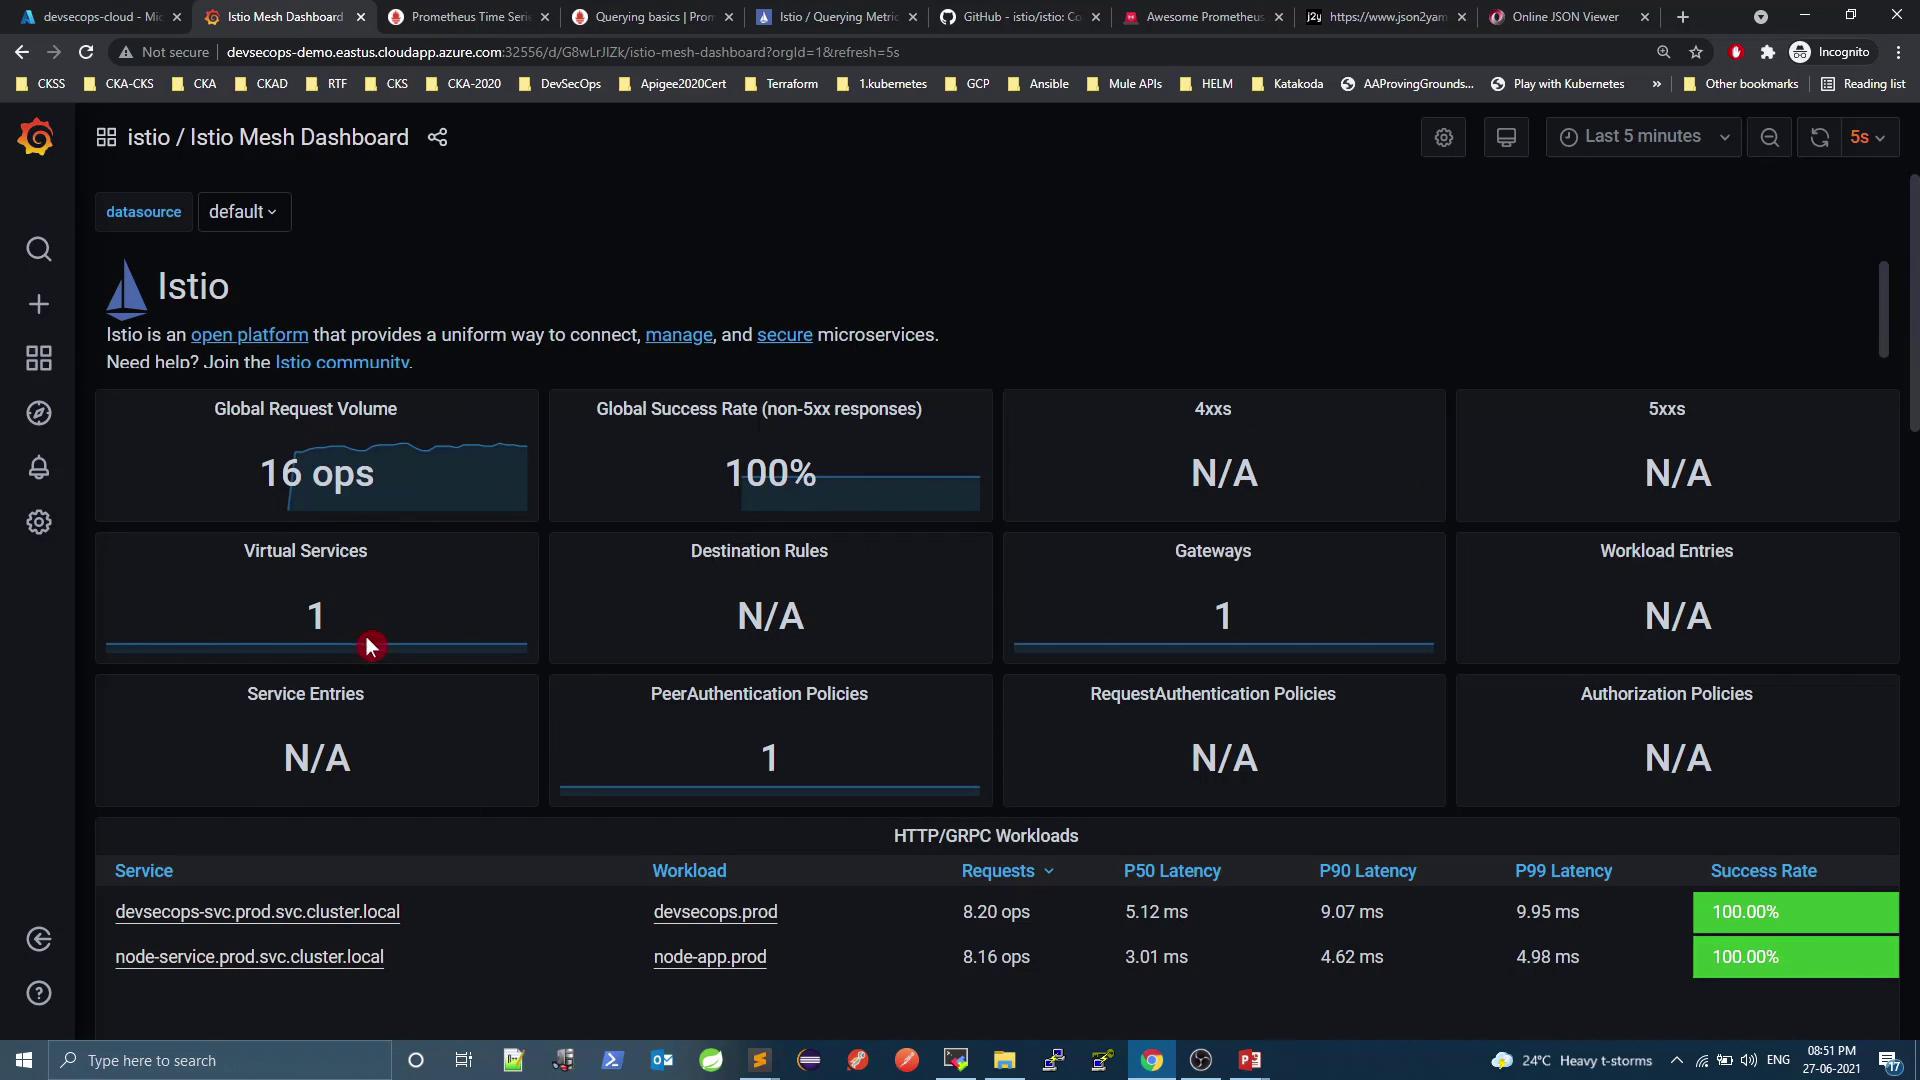
4. Alerting with Grafana
Grafana supports built-in alert rules and notification channels (Slack, email, PagerDuty, etc.). To create a Slack channel:- Notification channel → New channel
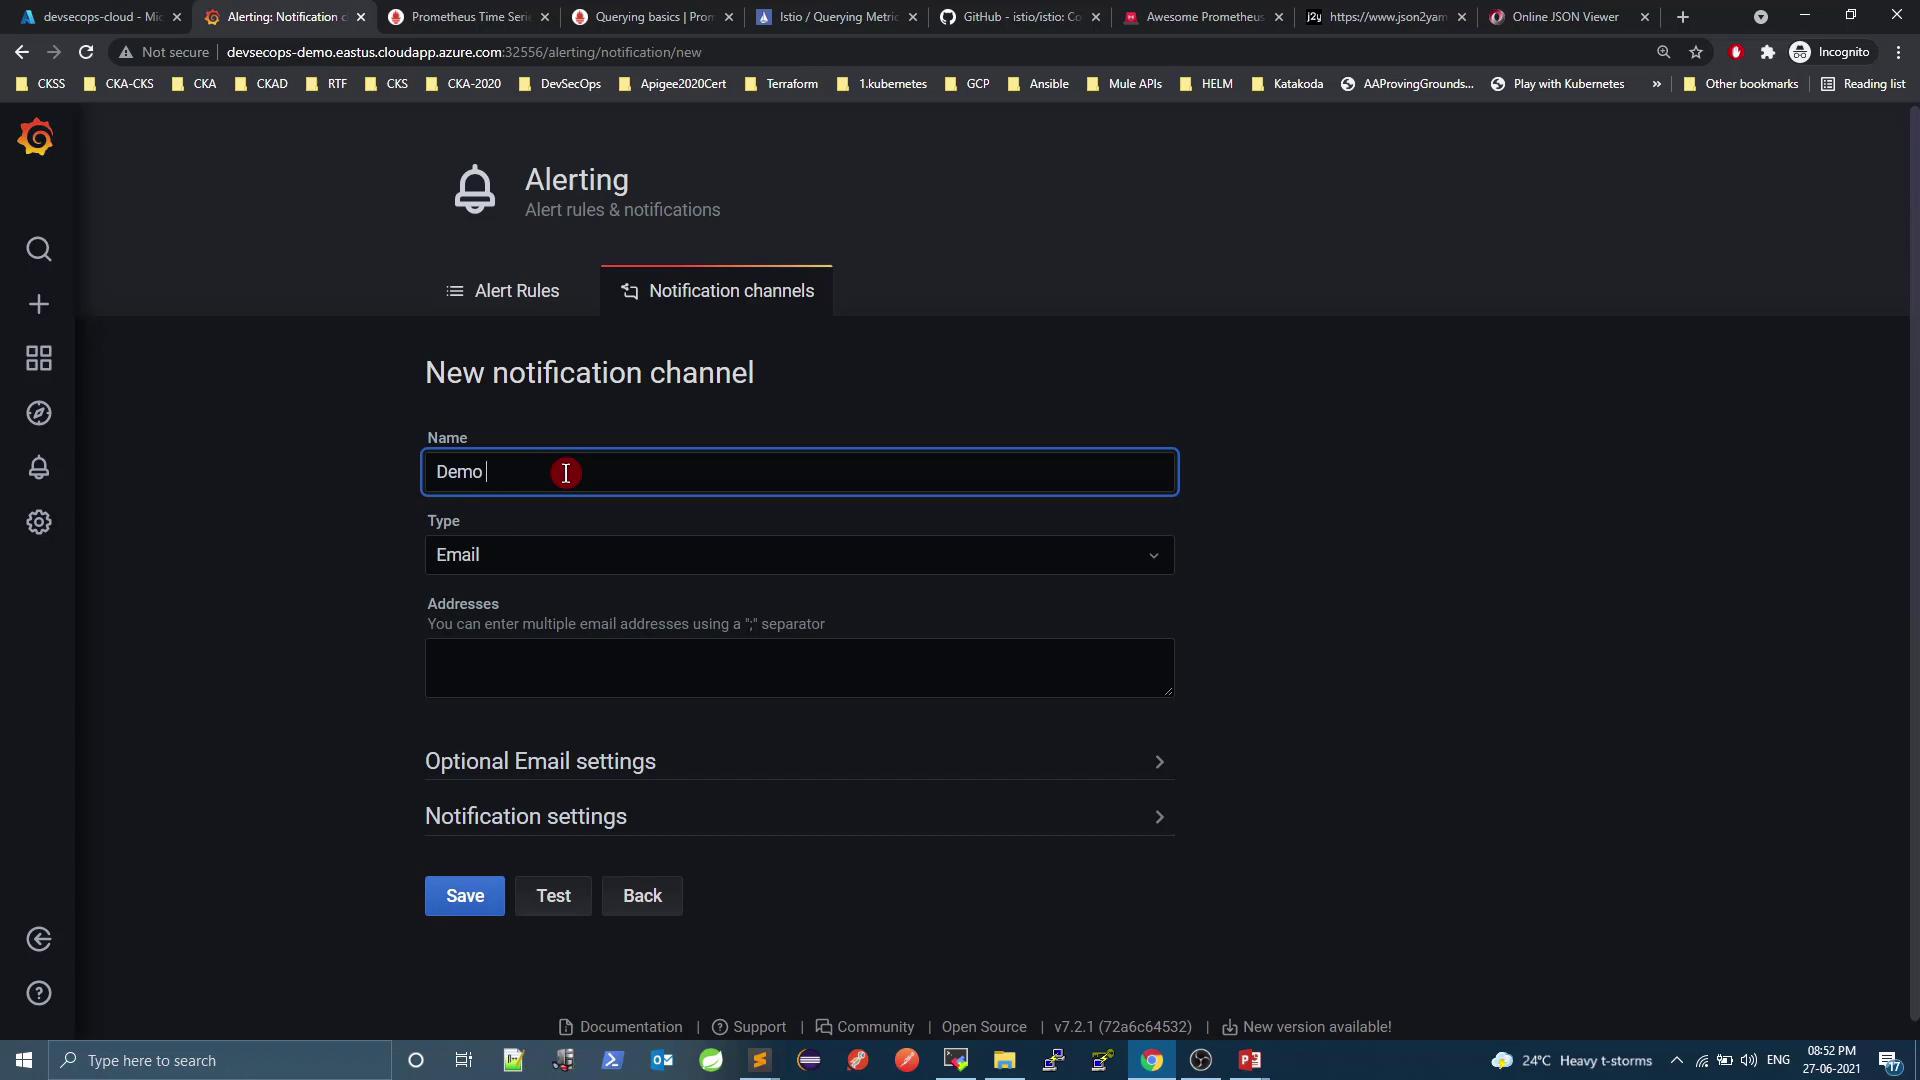
- Select Slack and add your webhook URL.
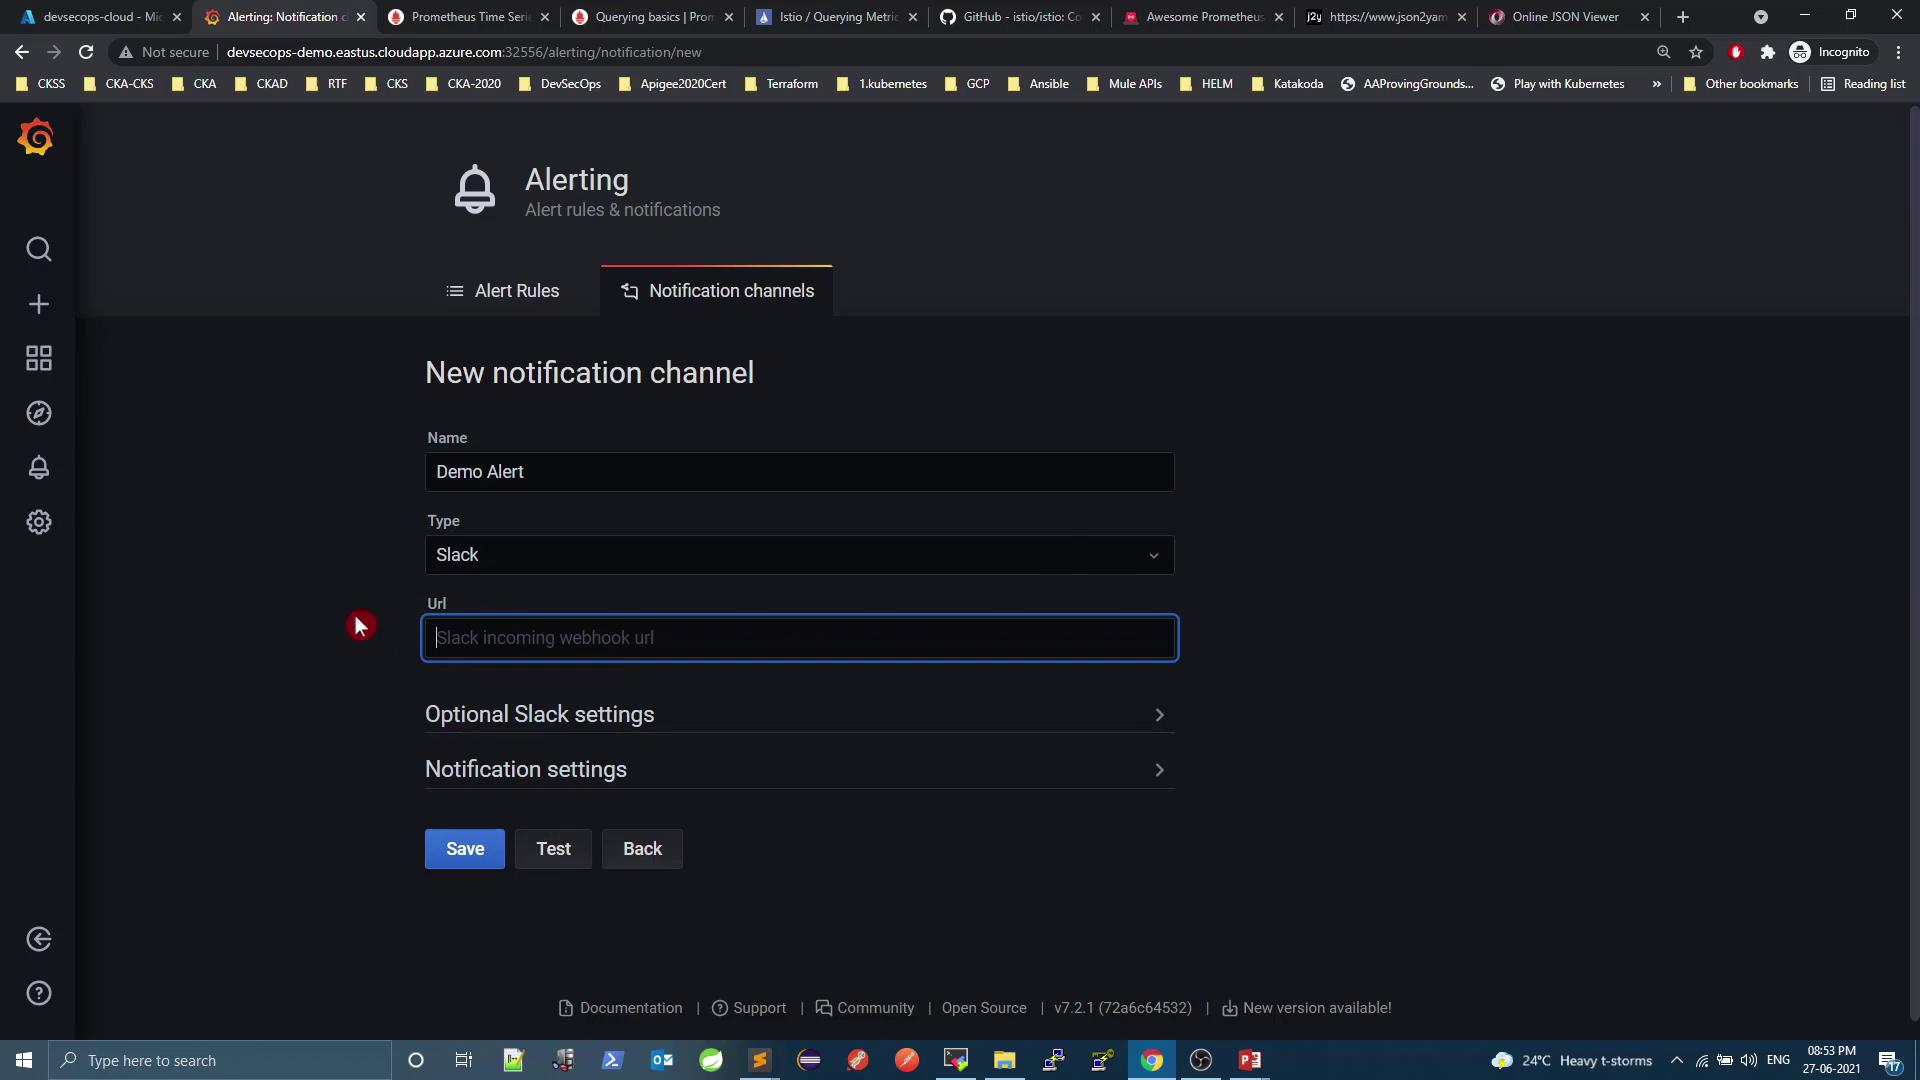
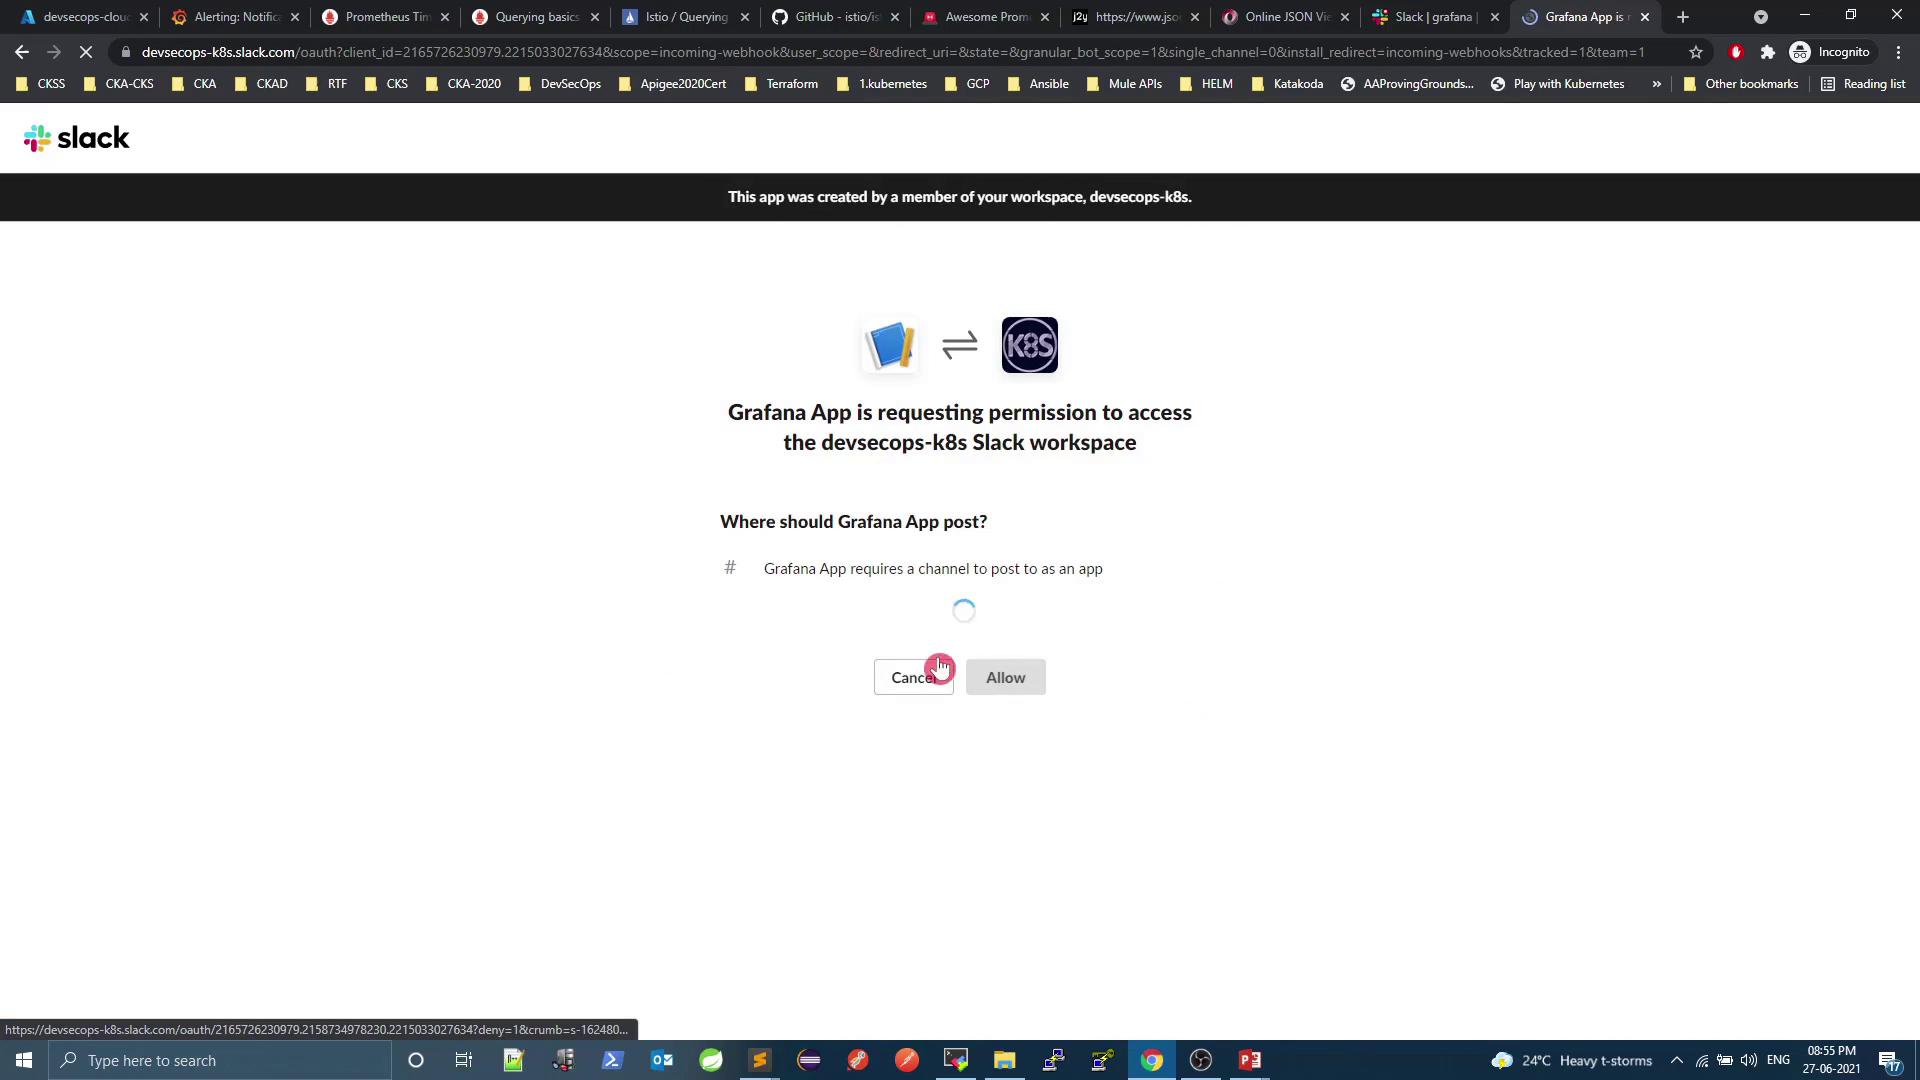
- Approve the Grafana app in Slack.
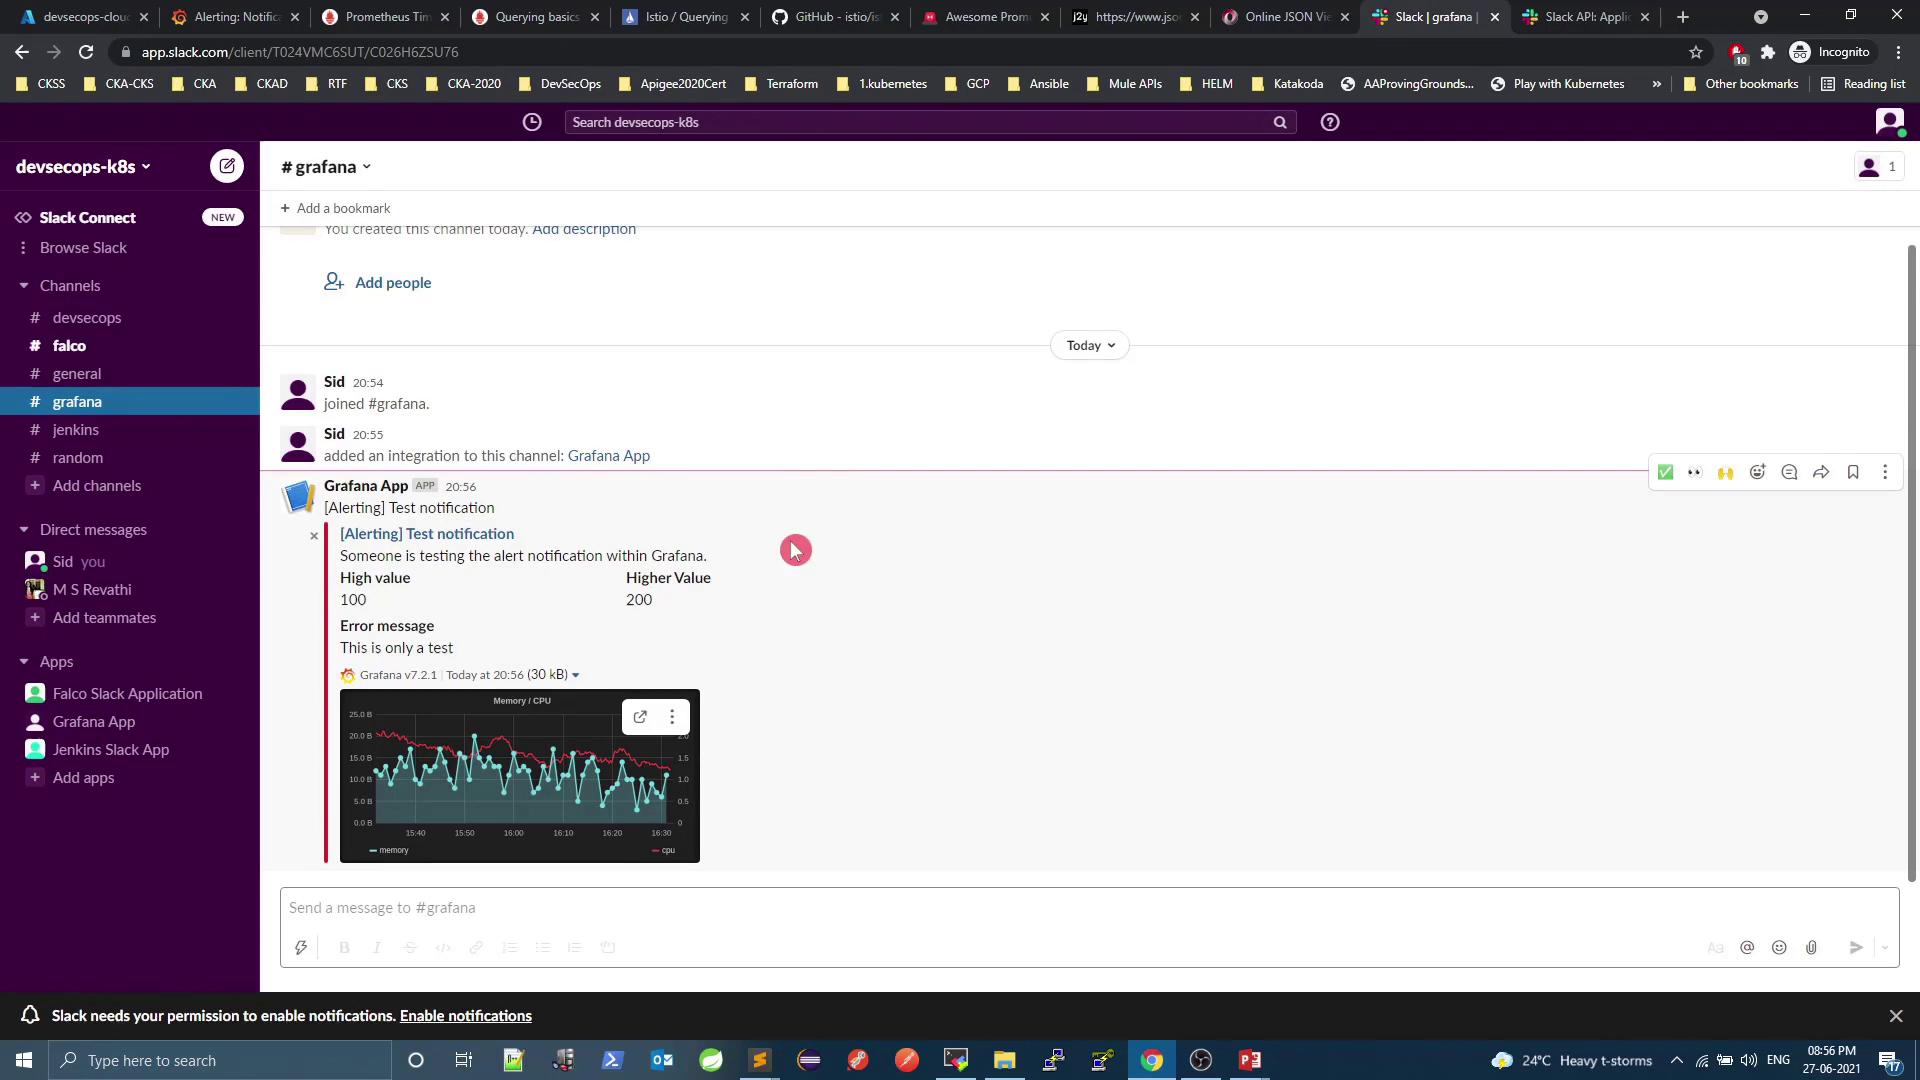
- Test the channel and watch alerts roll in:
5. Prometheus Alerts & Alertmanager
Out of the box, Prometheus doesn’t ship with alert rules. Let’s integrate Alertmanager and define rules:- Verify current state
- Check Alertmanager integration
alertmanager.yml and your Prometheus rules files.
Links & References
- Kubernetes Services Overview
- Istio Metrics & Telemetry
- Grafana Alerting
- Prometheus Alertmanager Guide