DevSecOps - Kubernetes DevOps & Security
Kubernetes Operations and Security
Prometheus Basics
In this lesson, you’ll learn how to set up a complete monitoring stack with Prometheus, Grafana, and Alertmanager. We’ll cover:
- Overview of Prometheus
- Prometheus architecture
- Data visualization with Grafana
- Alerting with Prometheus and Alertmanager
1. Overview of Prometheus
Prometheus is an open-source, pull-based monitoring and alerting system designed for time series data. It excels at:
- Multi-dimensional data model: metrics are labeled with key/value pairs.
- PROMQL: a flexible query language for slicing, aggregating, and analyzing time series.
- Native TSDB: optimized on-disk format for fast storage and retrieval.
- White-box monitoring: collects internal metrics (CPU, memory, request rates, etc.) from instrumented code.
Note
Prometheus focuses strictly on metrics collection and alerting. It does not handle logs, distributed tracing, or advanced anomaly detection. Consider integrating with Grafana Loki for logs and Jaeger for tracing.
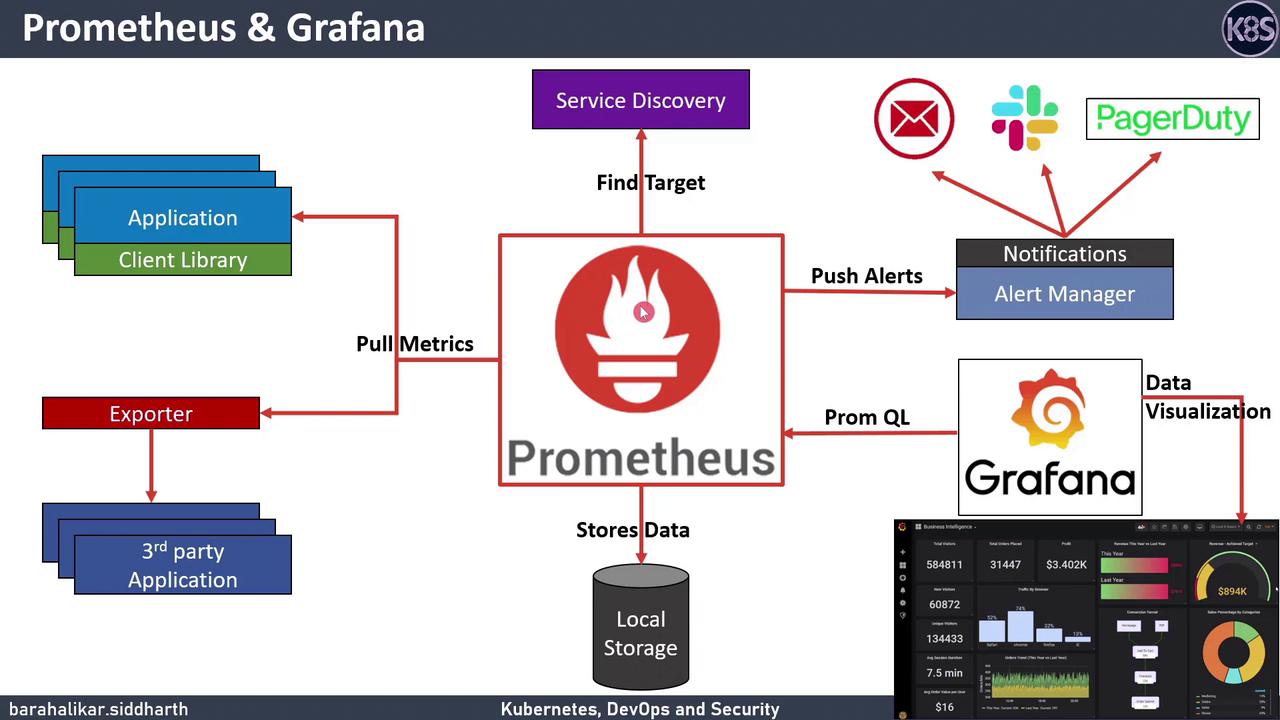
2. Prometheus Architecture
Prometheus consists of several core components that work together to discover, scrape, store, and alert on metrics.
2.1 Service Discovery
Prometheus automatically discovers scrape targets in dynamic environments:
| Platform | Discovery Mechanism | Example |
|---|---|---|
| Kubernetes | Kubernetes API | kubernetes_sd_configs |
| AWS EC2 | EC2 API | ec2_sd_configs |
| Consul | HTTP API | consul_sd_configs |
| Static | Manually defined targets | static_configs |
2.2 Instrumentation and Exporters
Instrumentation happens in two ways:
- Client libraries for languages like Go, Python, Java, and Ruby.
- Exporters for services you cannot modify.
| Exporter | Purpose | GitHub/Docs |
|---|---|---|
| Node Exporter | Host-level metrics (CPU, disk) | https://github.com/prometheus/node_exporter |
| Blackbox | Endpoint probing (HTTP, TCP, ICMP) | https://github.com/prometheus/blackbox_exporter |
| MySQL Exporter | Database server metrics | https://github.com/prometheus/mysqld_exporter |
| JMX Exporter | JVM application metrics | https://github.com/prometheus/jmx_exporter |
2.3 Scraping and Local Storage
Prometheus periodically scrapes metrics from each target defined in prometheus.yml. Scrapes are HTTP GET requests that return metrics in the Prometheus exposition format. The time series data is then committed to the local TSDB.
# prometheus.yml
global:
  scrape_interval: 15s
  evaluation_interval: 30s

scrape_configs:
  - job_name: 'node-exporter'
    static_configs:
      - targets: ['node1:9100', 'node2:9100']
Warning
Ensure your scrape intervals are tuned to your environment. Too frequent scrapes can overload the TSDB, while too infrequent scrapes may miss critical events.
3. Data Visualization with Grafana
Grafana is the leading open-source platform for time series analytics. It provides:
- First-class support for Prometheus as a data source via PROMQL queries.
- Interactive dashboards: graphs, heatmaps, tables, and more.
- Alerting capabilities directly on dashboards.
- A rich marketplace of community and official plugins.
Steps to connect Prometheus to Grafana:
- Log in to Grafana and go to Configuration → Data Sources.
- Add a new Prometheus data source and set the URL (e.g.,
http://prometheus:9090). - Save & Test, then import or build dashboards.
4. Alerting with Prometheus and Alertmanager
Prometheus defines alerting rules in rules.yml using PROMQL expressions. When a condition is met for a specified duration, an alert is fired and sent to Alertmanager.
# rules.yml
groups:
  - name: node_alerts
    rules:
      - alert: HighCPUUsage
        expr: node_cpu_seconds_total{mode!="idle"} > 0.85
        for: 5m
        labels:
          severity: critical
        annotations:
          summary: "High CPU usage on {{ $labels.instance }}"
Alertmanager manages notifications by:
- Grouping and deduplicating alerts
- Applying silence, inhibition, and inhibition rules
- Throttling notifications to avoid floods
- Routing to receivers: email, Slack, PagerDuty, webhook, etc.
# alertmanager.yml
route:
  group_by: ['alertname']
  receiver: 'slack-notifications'

receivers:
  - name: 'slack-notifications'
    slack_configs:
      - channel: '#alerts'
        api_url: 'https://hooks.slack.com/services/XXX/YYY/ZZZ'
Hands-On Demo: Istio + Prometheus + Grafana
We’ll now deploy Prometheus and Grafana on an Istio-enabled Kubernetes cluster to visualize service mesh metrics. You’ll learn to:
- Deploy Prometheus using the Prometheus Operator.
- Configure Grafana with Istio dashboards.
- Set up Alertmanager for service-level alerts.
Links and References
Watch Video
Watch video content