EFK Stack: Enterprise-Grade Logging and Monitoring
Instrumenting a Simple Python App for Logging
Instrumenting a Simple Python Application for Logging
In this article, we dive into deploying a front-end Python application with robust logging capabilities. We will demonstrate how user interactions within the application generate logs, how Fluent Bit collects these logs and sends them to Elasticsearch, and how to create insightful dashboards in Kibana. This guide is ideal for developers and engineers who want to monitor application performance and gain valuable insights into user behavior.
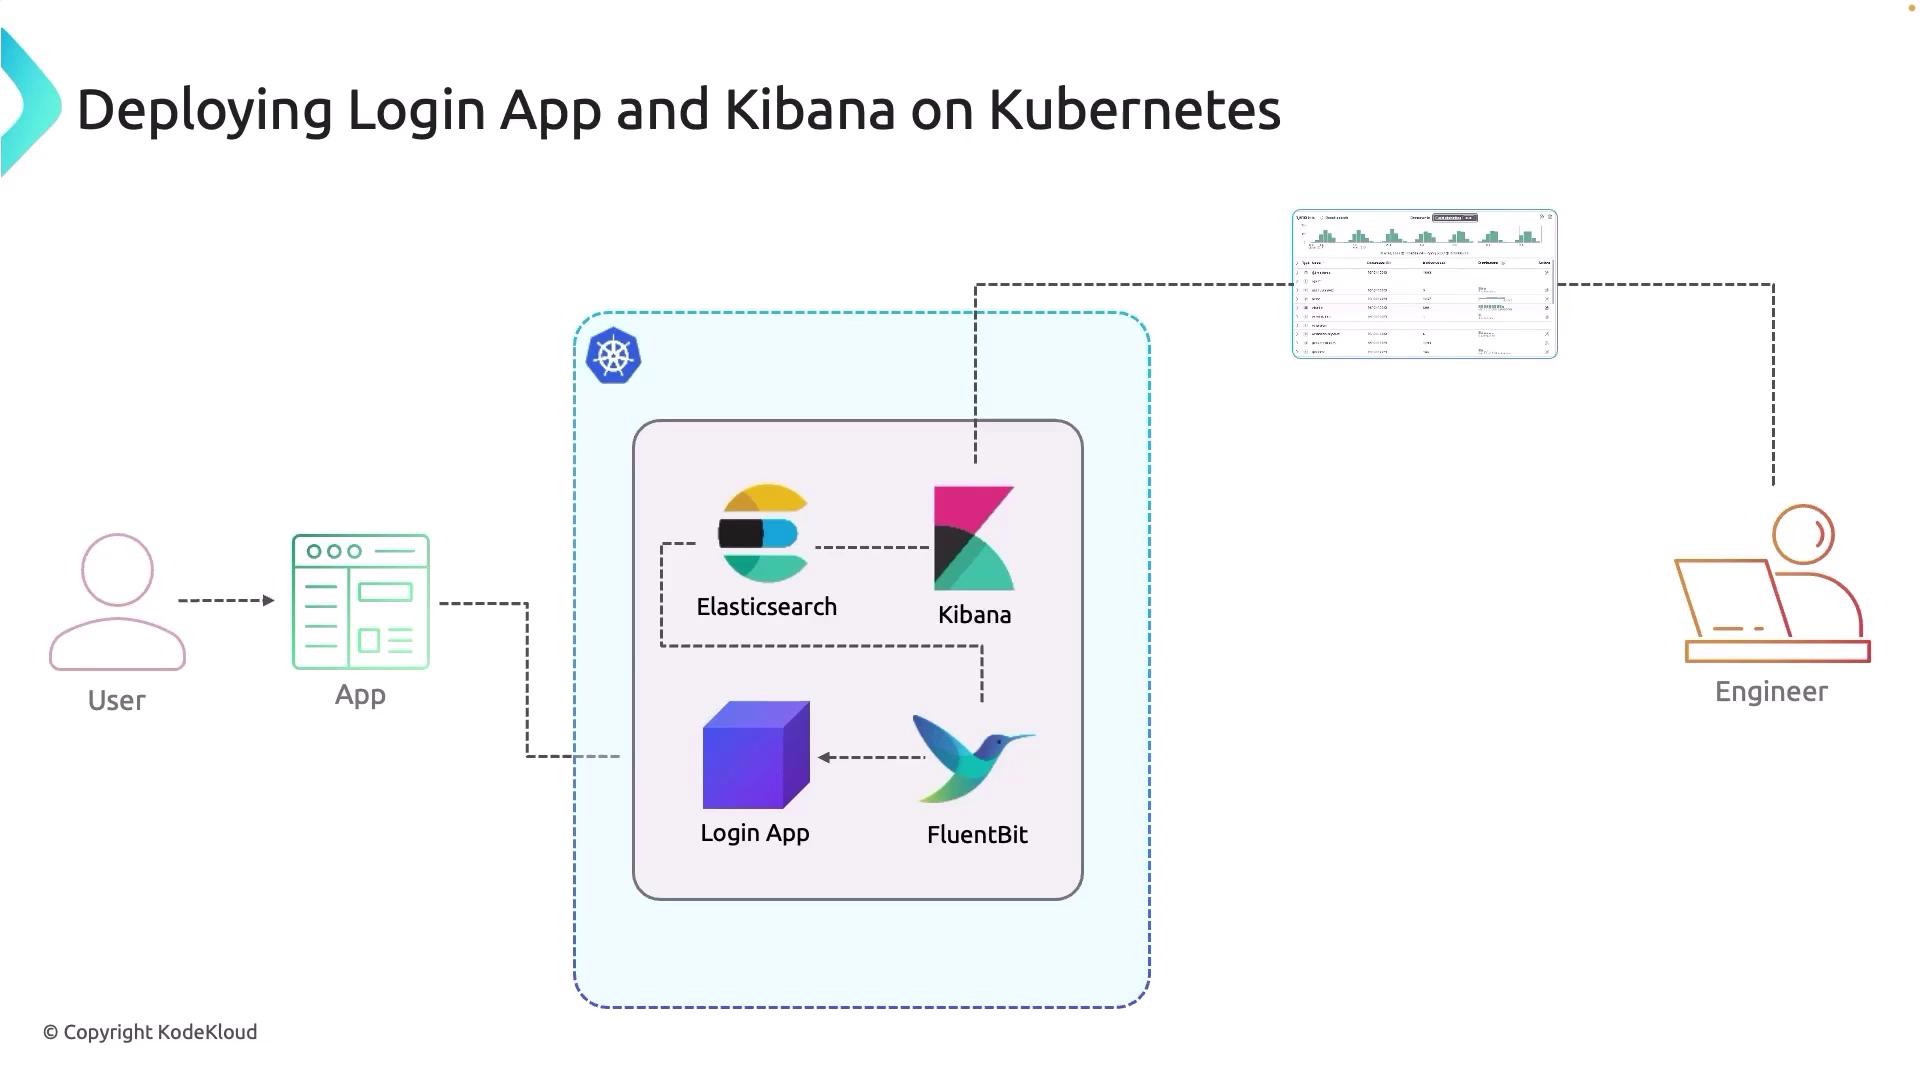
High-Level Architecture Overview
The Login App in this scenario serves two primary audiences:
- Users – They interact with the app.
- Developers – They maintain and troubleshoot the application using logs and dashboards.
This application is deployed in a Kubernetes environment where Elasticsearch and Kibana are pre-configured. The workflow is as follows:
- User Interaction: When a user interacts with the Login App, it generates logs.
- Log Collection: Fluent Bit collects these logs and forwards them to Elasticsearch.
- Data Visualization: Kibana is used to build dashboards that display the log data, providing insights into app behavior and performance.
Note
Each component in this architecture plays a crucial role in ensuring that every user action is logged and analyzed effectively.
Application Workflow and Logging Process
The following steps detail the end-to-end process:
- User Interaction: Each action in the Login App generates a corresponding log entry.
- Fluent Bit Integration: Fluent Bit monitors the application logs and collects them.
- Log Forwarding: The collected logs are sent to the Elasticsearch cluster where they are stored and indexed.
- Dashboard Creation: Developers utilize Kibana to build dashboards and analyze the logs for performance monitoring and troubleshooting.
Warning
Ensure that Fluent Bit is properly configured to parse the logs according to your application's log format to avoid data loss or misinterpretation.
Demo Walkthrough
In the next section, we will walk through the detailed demo which includes:
- Building and deploying the Login App.
- Integrating Fluent Bit for centralized logging.
- Creating Kibana dashboards for real-time monitoring.
This comprehensive demonstration will provide practical insights into how structured logging can enhance the performance and user experience of your application.
That concludes this article. Thank you for reading, and we look forward to exploring more innovative topics with you soon.
Additional Resources
Watch Video
Watch video content