EFK Stack: Enterprise-Grade Logging and Monitoring

Understanding Kibana

KQL Demo

Welcome to this comprehensive tutorial on using the Kibana Query Language (KQL) to efficiently query and analyze your sample data in Kibana. In this guide, we will cover how to upload a CSV file, explore its fields, and apply various KQL queries to filter logs based on specific criteria.

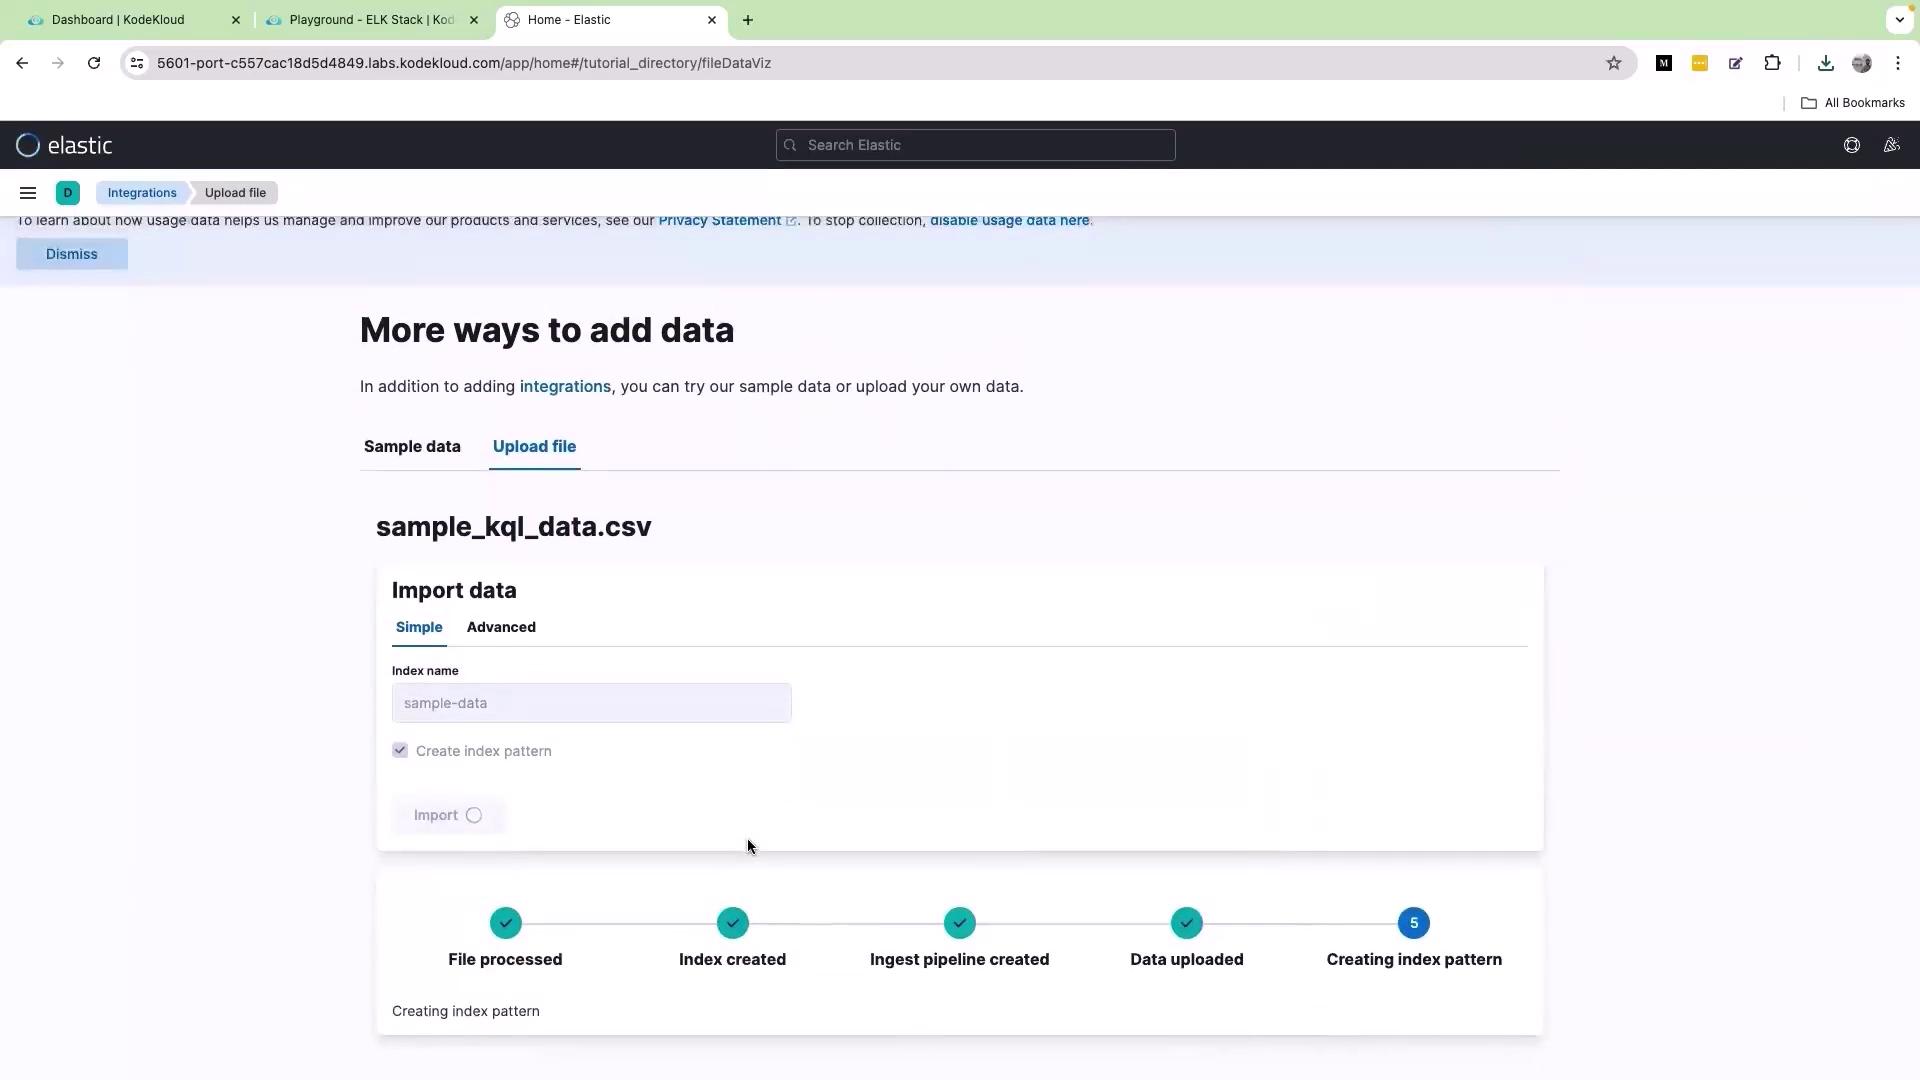
Uploading the Sample Data

To begin, open the Kibana interface in your web browser and click on the Upload a file option. Drag and drop the file named "sample_kql_data.csv" into the browser window. Once dropped, scroll down and click Import. Assign a descriptive name for the dataset (for example, "sample data"), then click Import again to complete the process.

The image shows a webpage from Elastic, offering options to add data by uploading files, with a focus on visualizing data from log files. A CSV file named "sample_kql_data.csv" is shown being dragged for upload.

After importing, scroll down and select View Index in Discovery to proceed.

The image shows a web interface for Elastic, where a CSV file named "sample_kql_data.csv" is being uploaded and processed, with steps indicating file processing, index creation, and data upload.

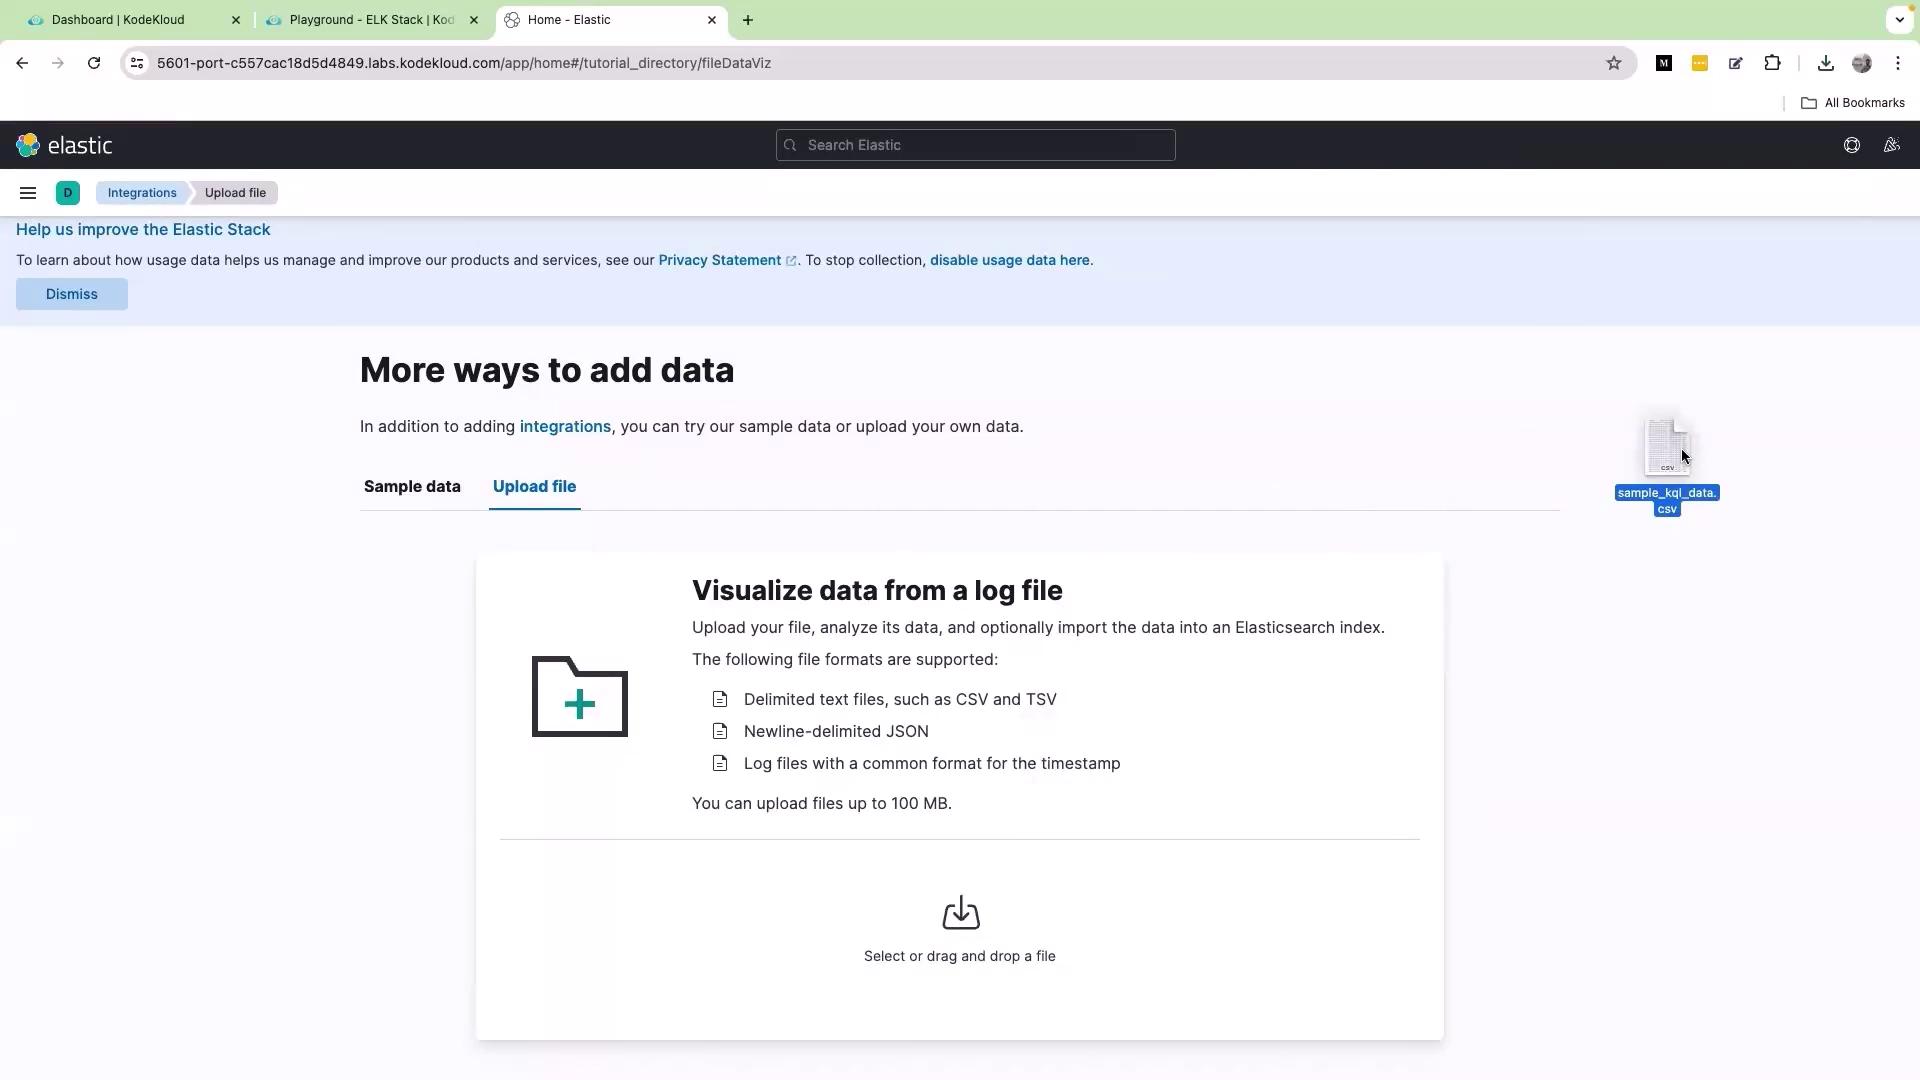
Exploring Available Fields

Once your sample data is uploaded, the first step is to review the available fields in your dataset. Each field acts as a key paired with its respective data value. For instance, a field named "action" might record various user interactions like "view", "click", "purchase", "log in", and "log out".

The image shows an Elastic Stack dashboard displaying a bar chart of data hits over time and a table with detailed document entries, including fields like timestamp, action, amount, and country.

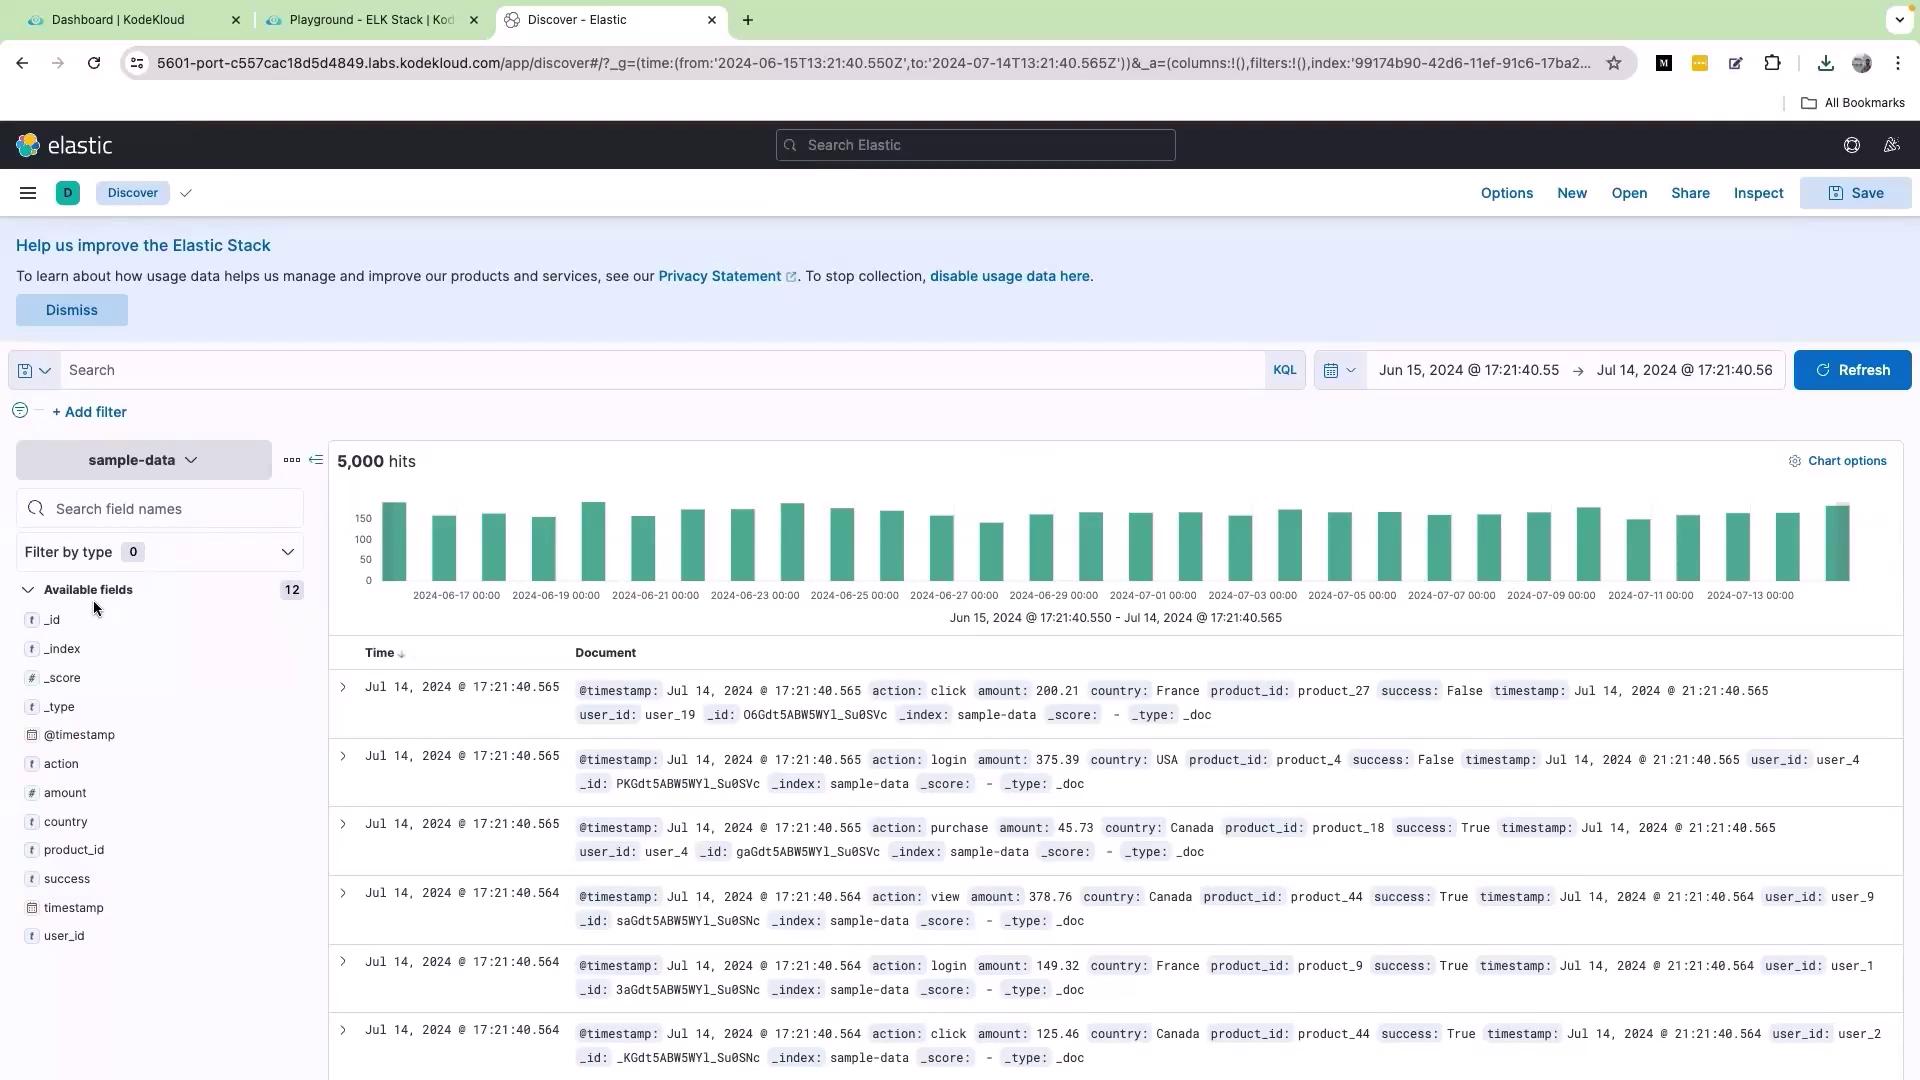
Running Basic KQL Queries

Filtering logs with KQL is straightforward. To display only the logs where the action is "purchase", enter the following query into the search bar:

action: "purchase"

Click Update to refresh the dashboard with the filtered logs.

The image shows a dashboard from Elastic's Kibana interface, displaying a bar chart and a table of data filtered by the action "purchase," with various fields like timestamp, amount, and country.

Similarly, if you need to view all logs for a specific user (for example, user_10), use the query:

user_id: "user_10"

After clicking Update, the dashboard will display the logs for user_10. To filter logs from a specific country such as Canada, use:

country: "Canada"

Then click Update to display the data from Canada. This method is particularly useful for regional traffic analysis and monitoring user behavior.

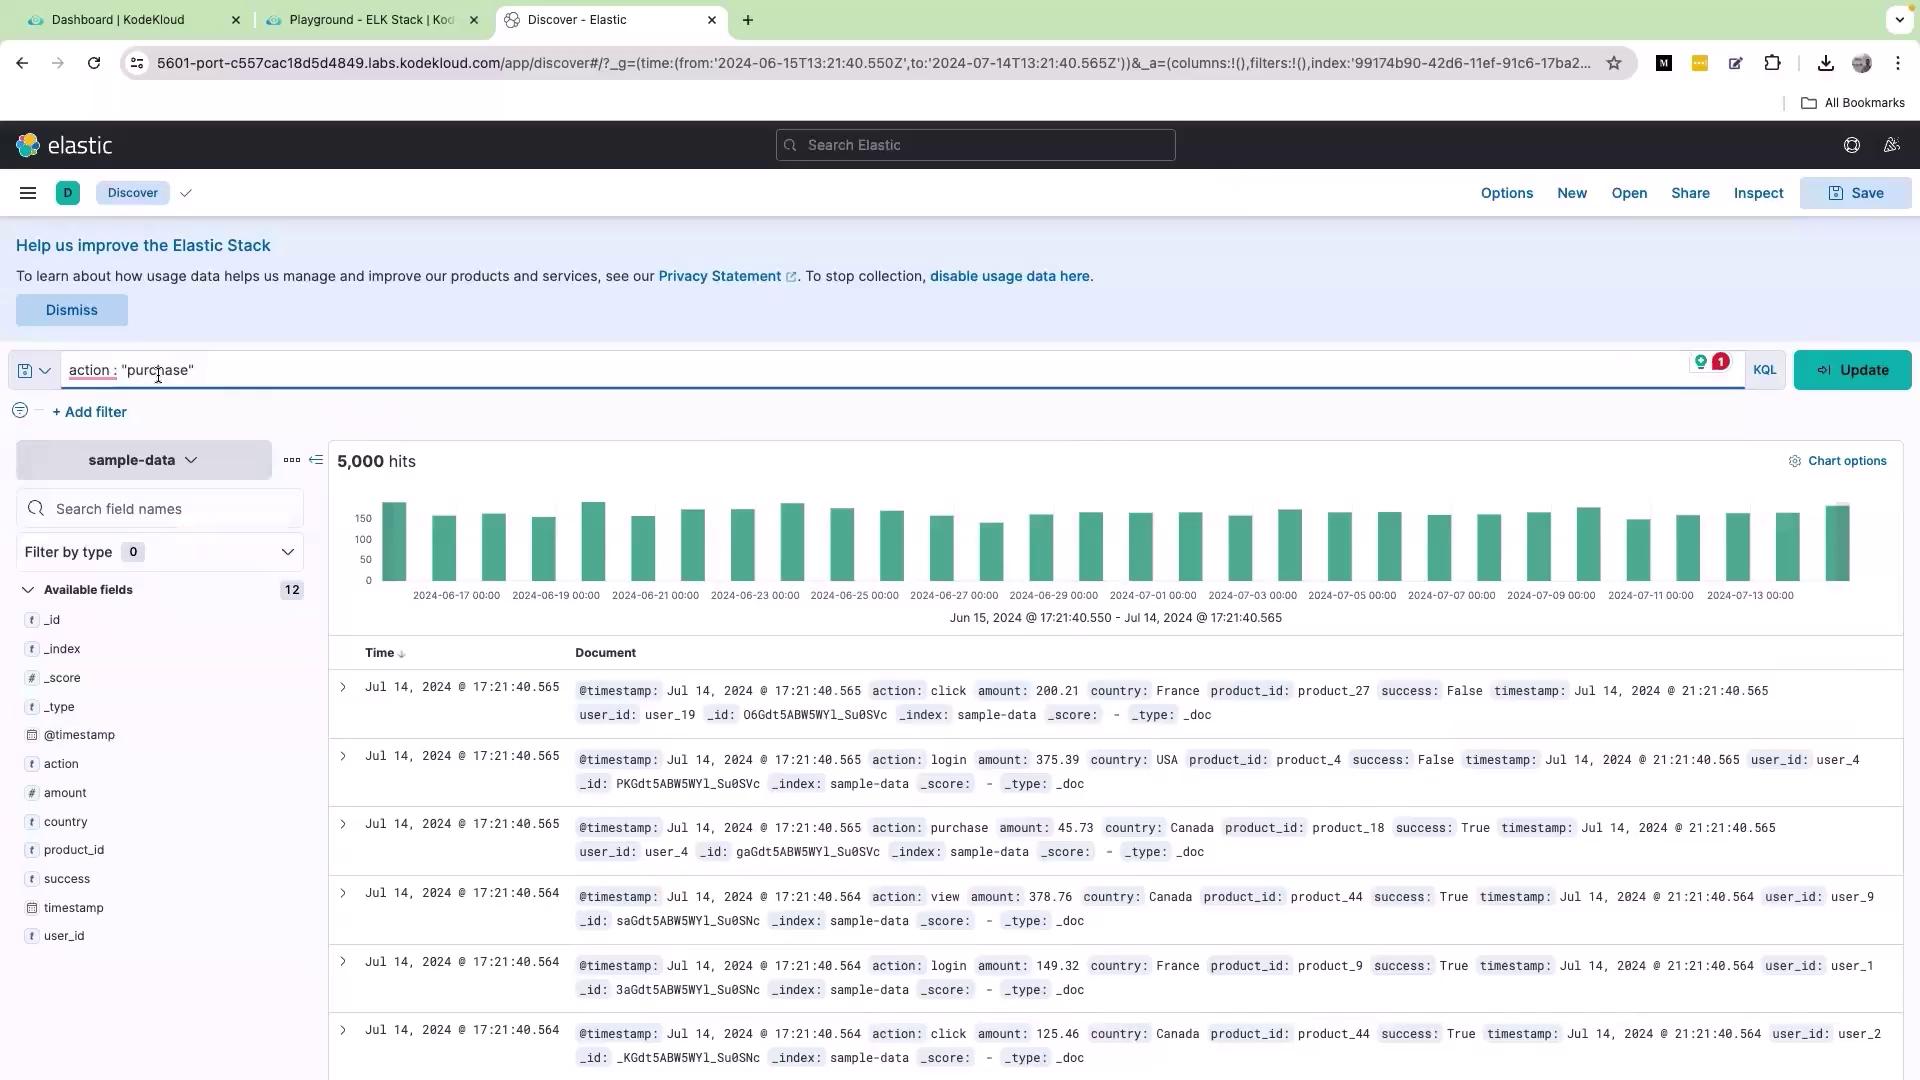
Filtering Numeric Fields

To analyze logs where numeric values meet specific conditions, consider filtering logs where the "amount" is greater than 100. This query is useful for identifying transactions or interactions that exceed a certain value:

amount > 100

Click Update to view all logs with an amount exceeding 100.

The image shows an ElasticSearch dashboard displaying a data query with a bar chart and a list of document entries filtered by an amount greater than 100. The data includes fields like timestamp, action, amount, country, and product ID.

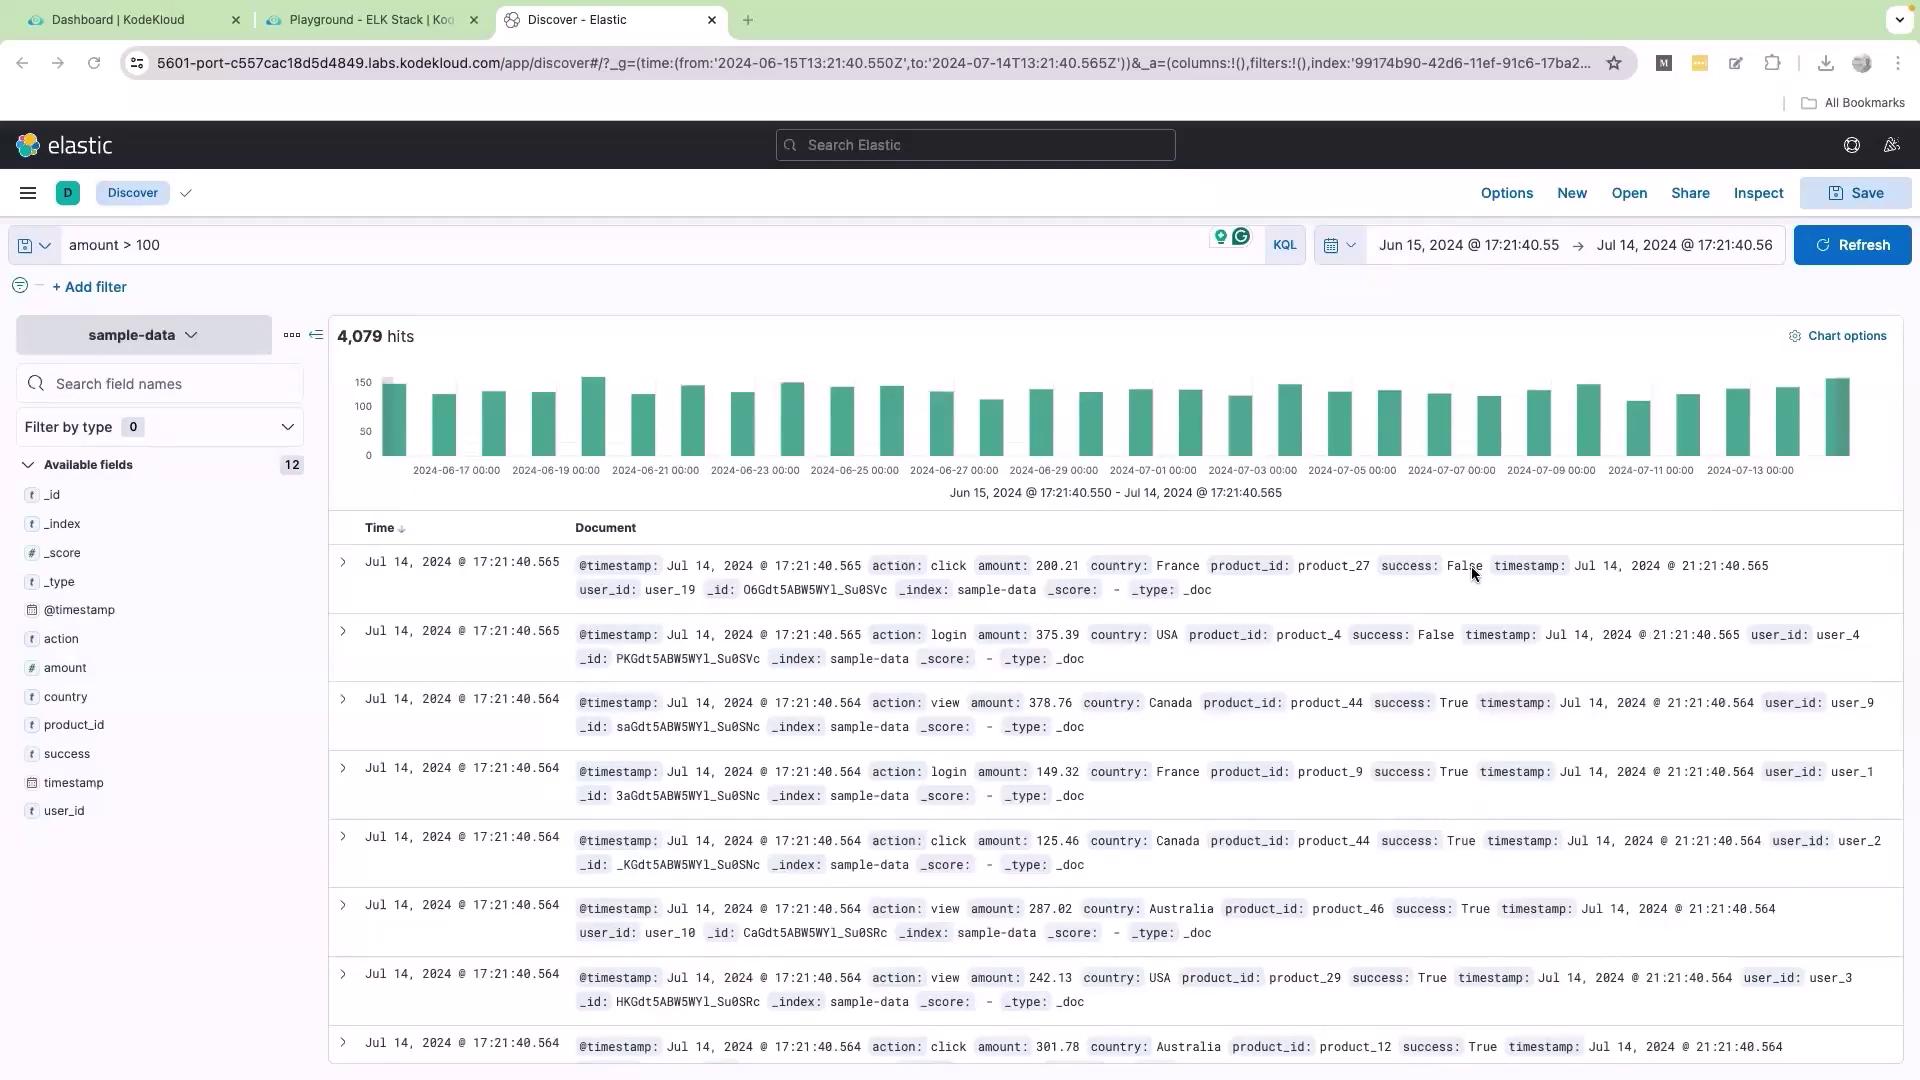
Working with Boolean Fields

KQL supports Boolean queries which are useful for filtering actions based on true/false values. For example, if you have a Boolean field named "success" that indicates whether an action was successful, you can query for successful actions with:

success: true

Note

Remember that KQL is case sensitive. Ensure that the Boolean value matches the case used in the data.

Combining Queries

KQL allows you to combine multiple conditions using logical operators. For instance, if you need to view logs where the action is "purchase" and the amount is greater than 200, use the following query:

action: "purchase" AND amount > 200

Click Update to see logs that meet both criteria simultaneously.

The image shows an ElasticSearch dashboard displaying a data query with a histogram and a list of documents filtered by specific criteria, such as "purchase" actions with amounts greater than 200.

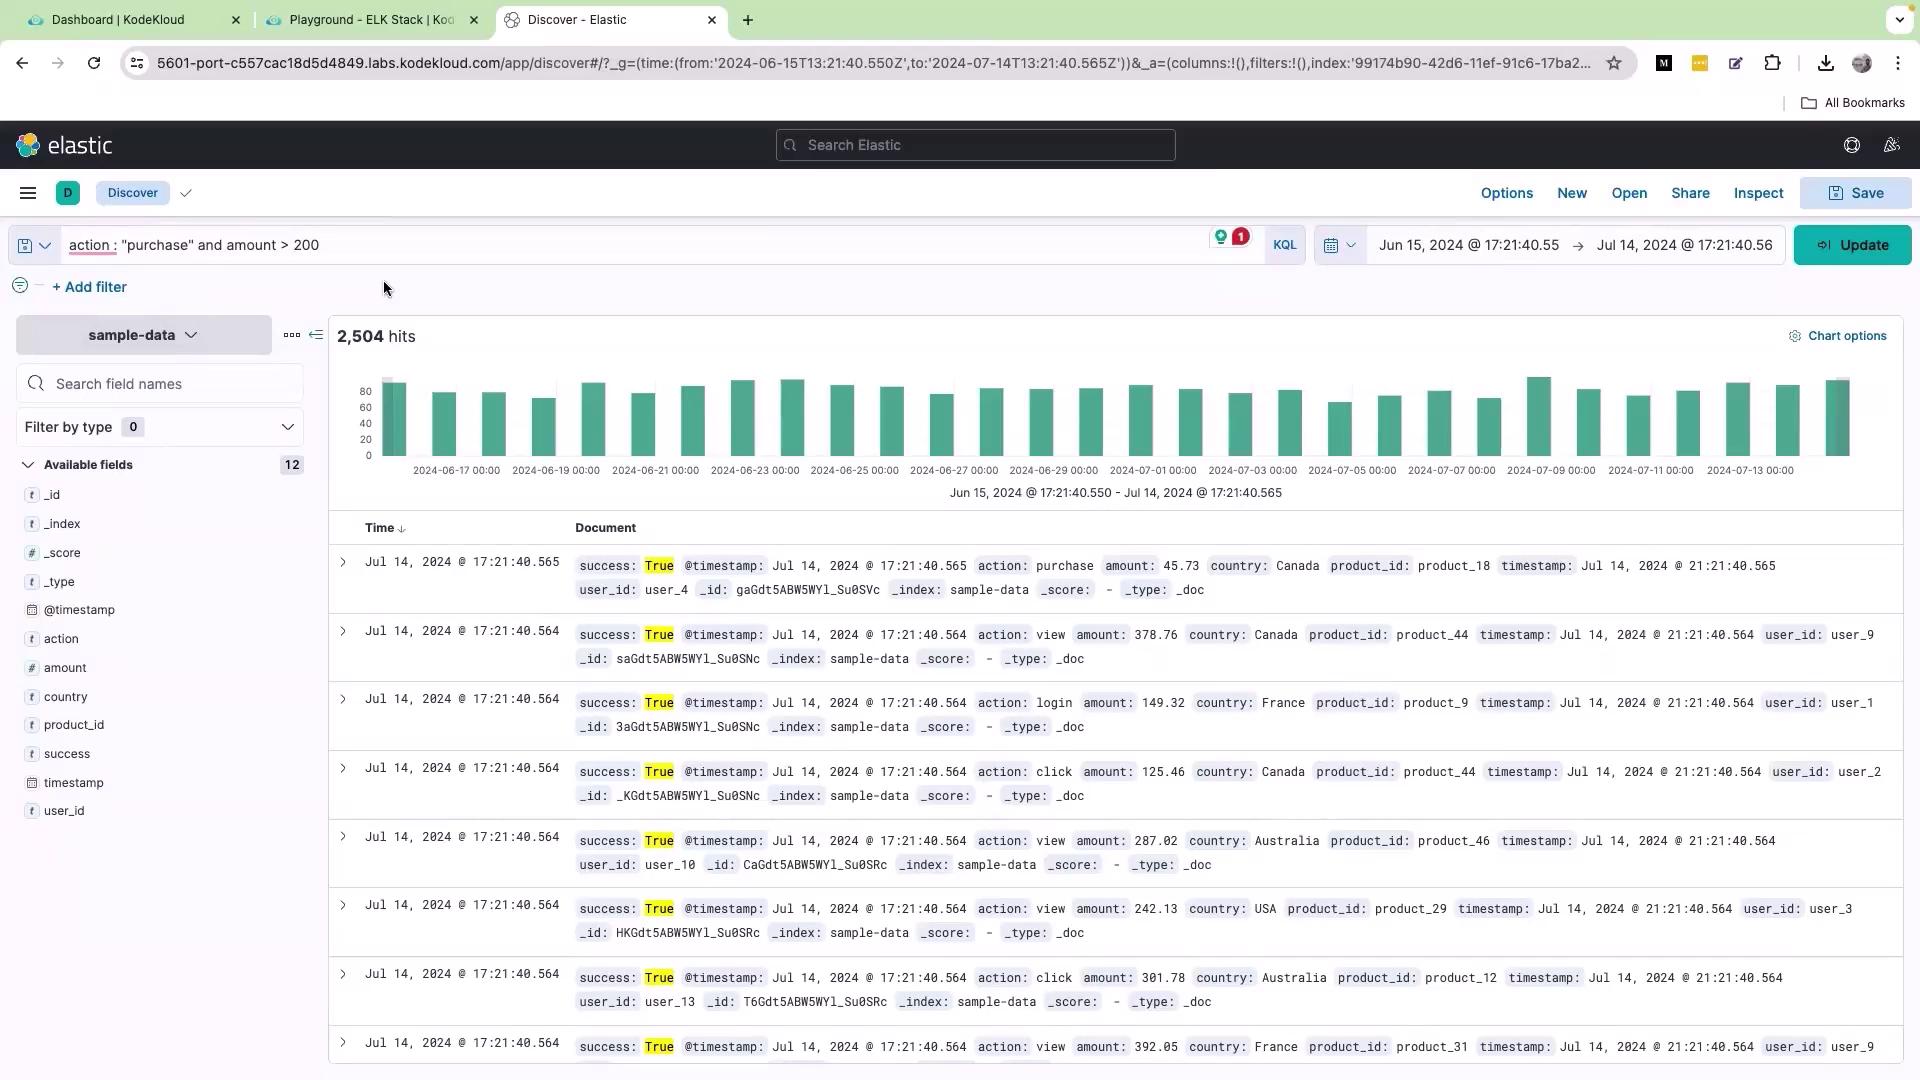
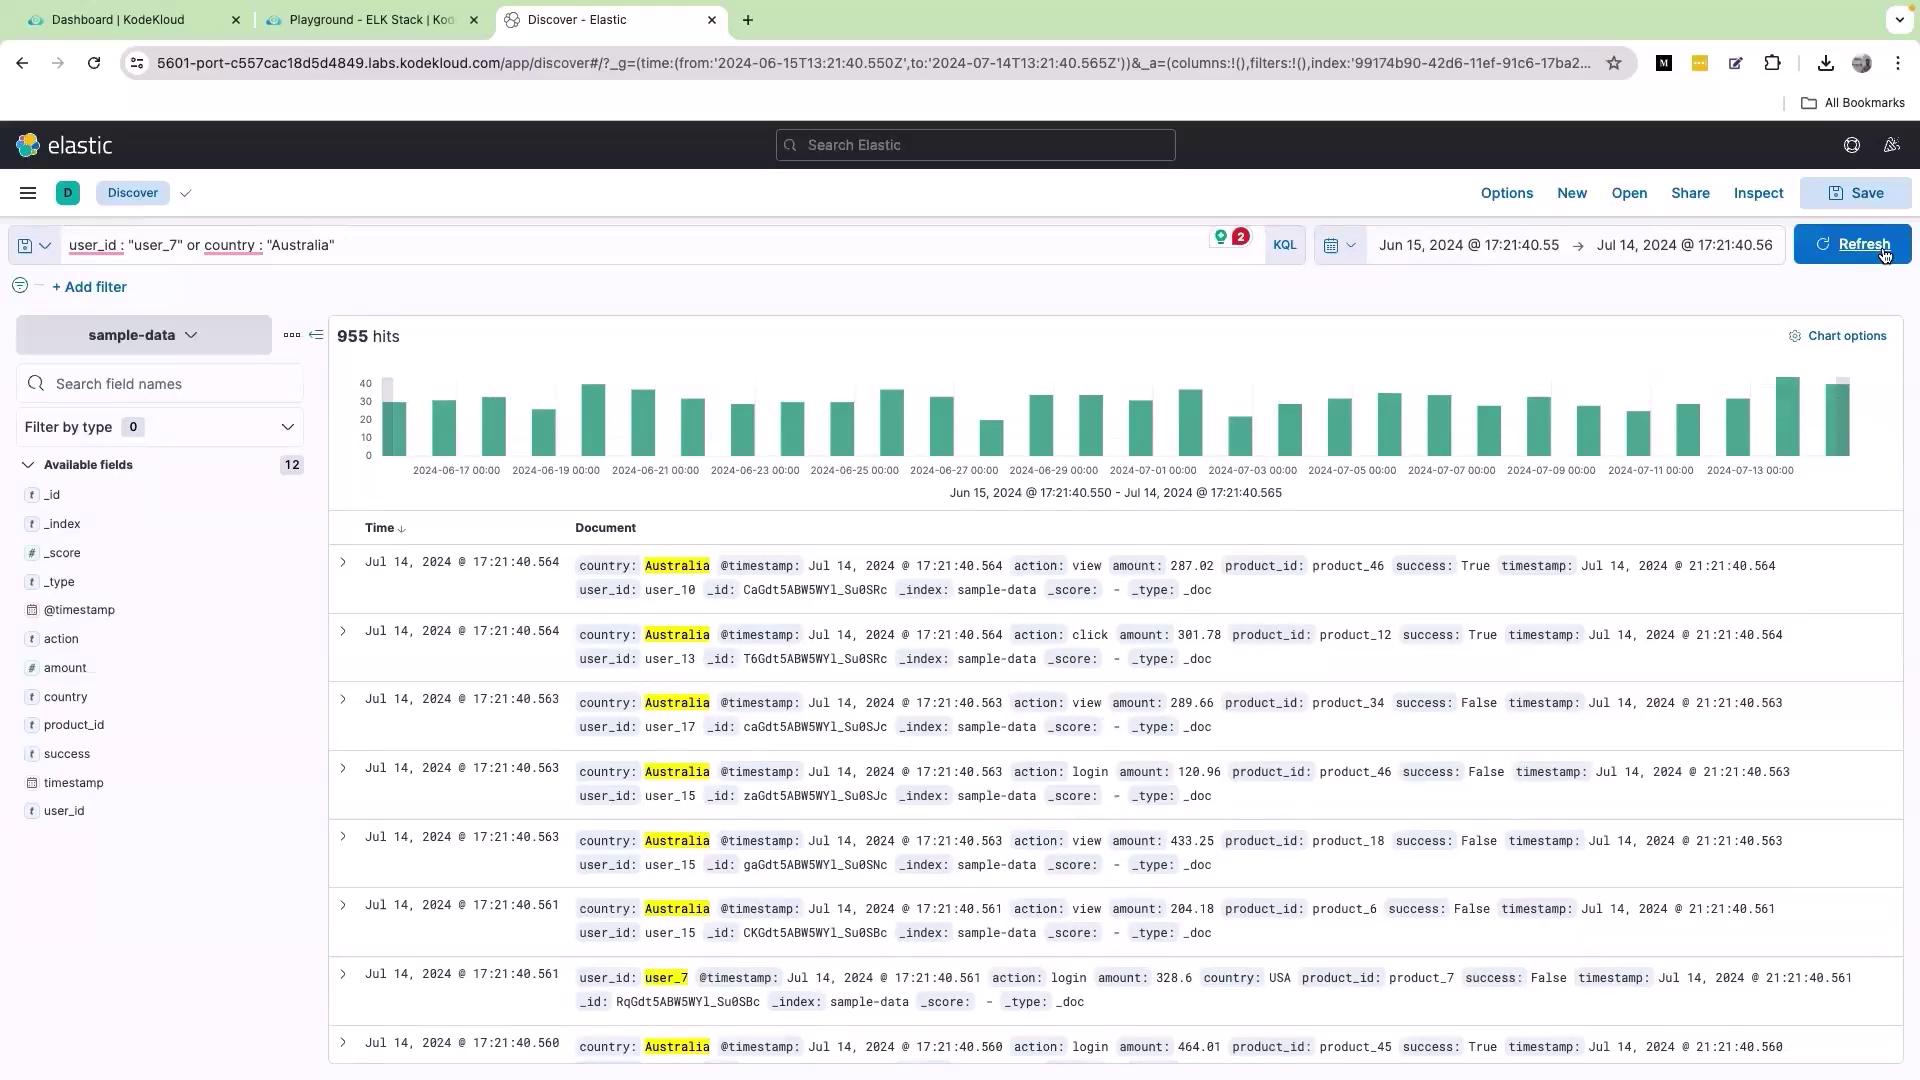
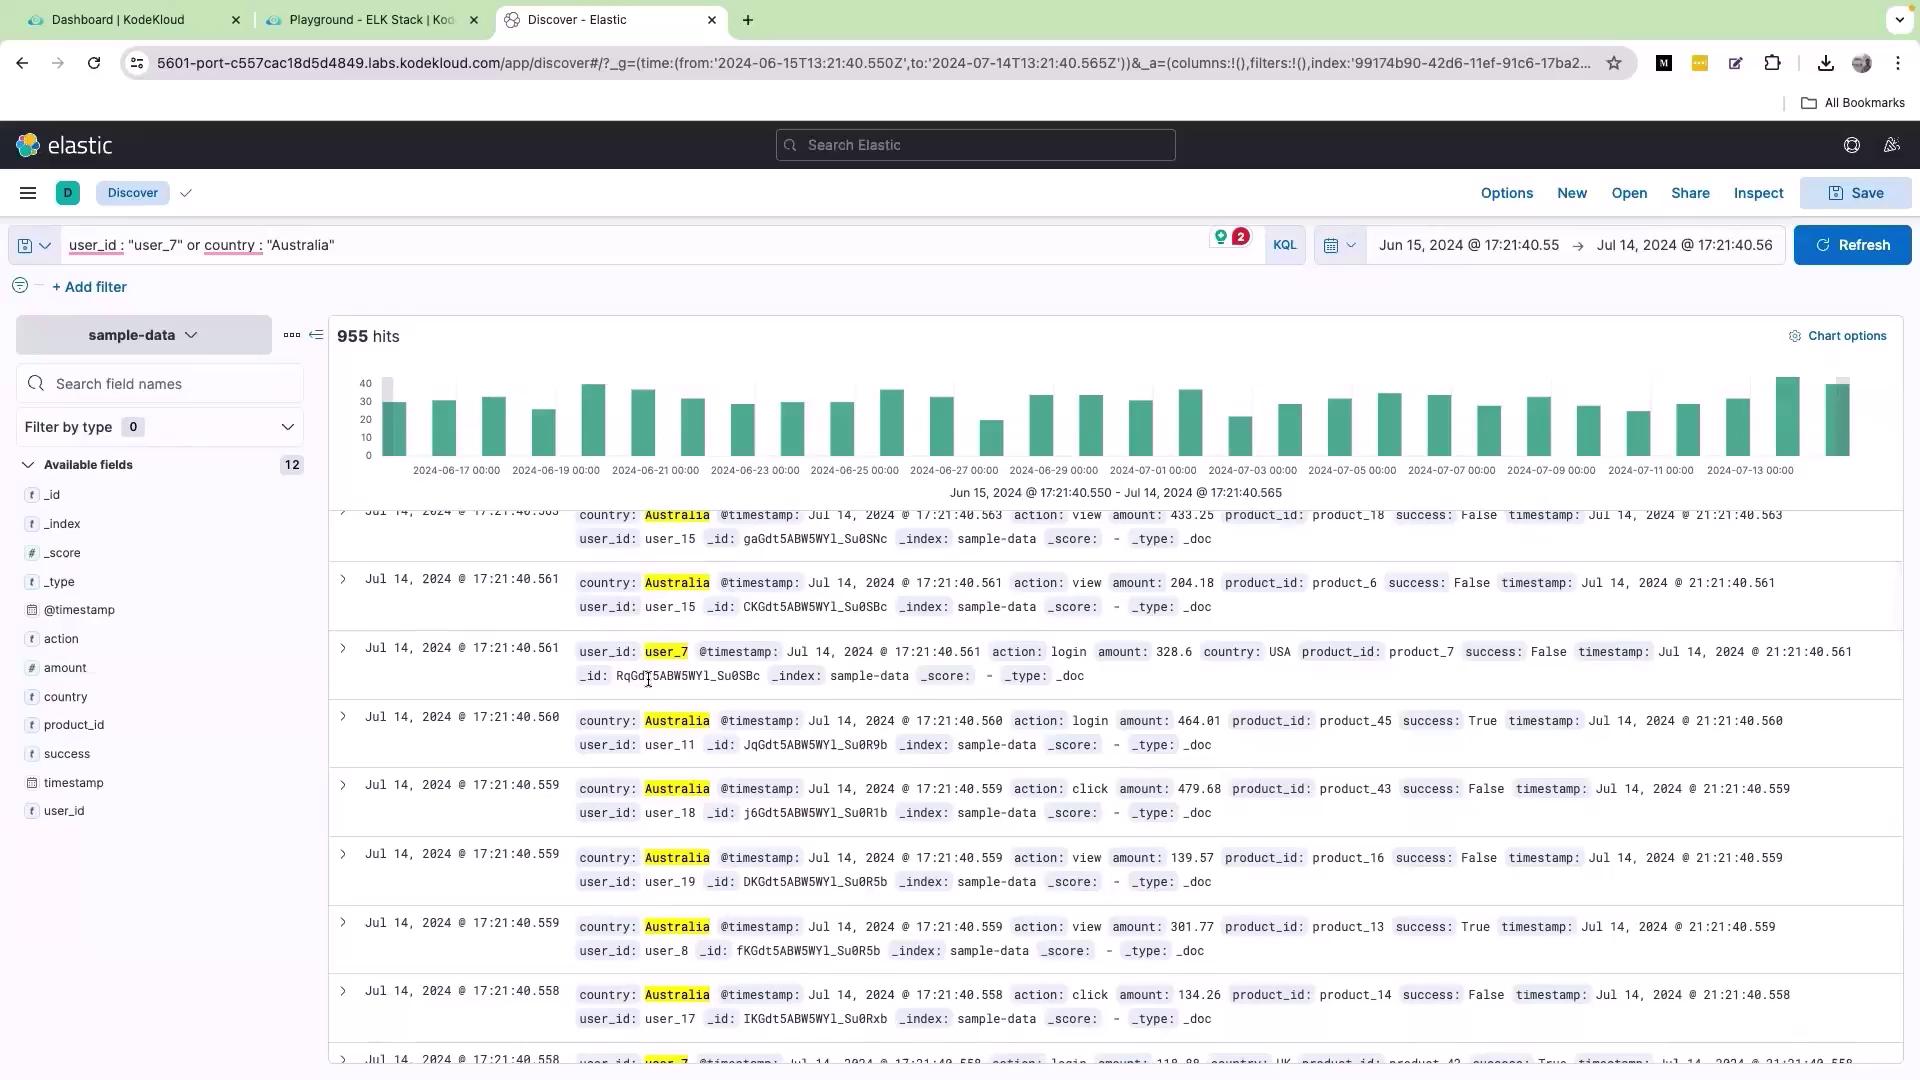
Using OR for Alternative Conditions

If you need to filter logs based on alternative conditions, the OR operator is very effective. For example, to retrieve records where the user ID is "user_7" or the country is "Australia", enter the following query:

user_id: "user_7" OR country: "Australia"

After clicking Update, the dashboard will display logs matching either condition. Note that different records might highlight different fields as the matching criteria.

The image shows an Elastic dashboard displaying search results with a bar chart and a list of documents filtered by user ID and country. The data includes timestamps, actions, and product IDs.

The image shows a dashboard from Elastic displaying a bar chart and a list of data entries filtered by user ID and country, with details like timestamps, actions, and success status.

This versatile querying capability simplifies debugging and enables you to trace user interactions—from logging in to logging out—by filtering based on user IDs or other key fields.

Conclusion

Kibana Query Language (KQL) is a powerful tool for exploring and filtering log data within Kibana. Its intuitive interface and flexible syntax allow rapid data insights, making it indispensable for monitoring applications. As Kibana evolves, features like Lens further enhance the creation of interactive dashboards and in-depth analyses.

We hope this tutorial has provided you with a clear understanding of using KQL to query log data. Stay tuned for upcoming lessons focusing on advanced features and dashboard creation techniques.

Happy querying!

Watch Video

Watch video content

Previous
Kibana Query Language KQL Understanding the syntax and capabilities of KQL for advanced data querying