AWS Solutions Architect Associate Certification

Services Management and Governance

Prometheus

In this lesson, we explore Prometheus—a powerful open-source tool engineered to collect, store, and analyze metrics. With its dedicated time series database and flexible query language, PromQL, Prometheus offers deep insights into the health and performance of your applications and infrastructure.

Monitoring an application's health is akin to keeping track of a person's well-being. Just as healthcare professionals monitor tests like blood sugar, cholesterol, and vitamin levels, infrastructure monitoring captures metrics like CPU utilization, memory usage, and application latency. These metrics are essential in ensuring that your systems operate within optimal ranges.

Note

Prometheus not only gathers current metrics but also stores historical data, enabling you to investigate trends and diagnose issues retrospectively.

After collecting these valuable metrics, it is crucial to store them efficiently. For instance, if an incident occurs on a Monday, historical metrics from the previous weekend can help pinpoint the cause. Prometheus addresses this need by periodically pulling metrics from defined targets—such as servers, applications, or containers—and storing them in its built-in time series database. Users can then query this data through an HTTP server interface using PromQL. While similar in function to services like AWS CloudWatch, Prometheus offers the flexibility of an open-source system that adapts to virtually any platform.

Prometheus Architecture

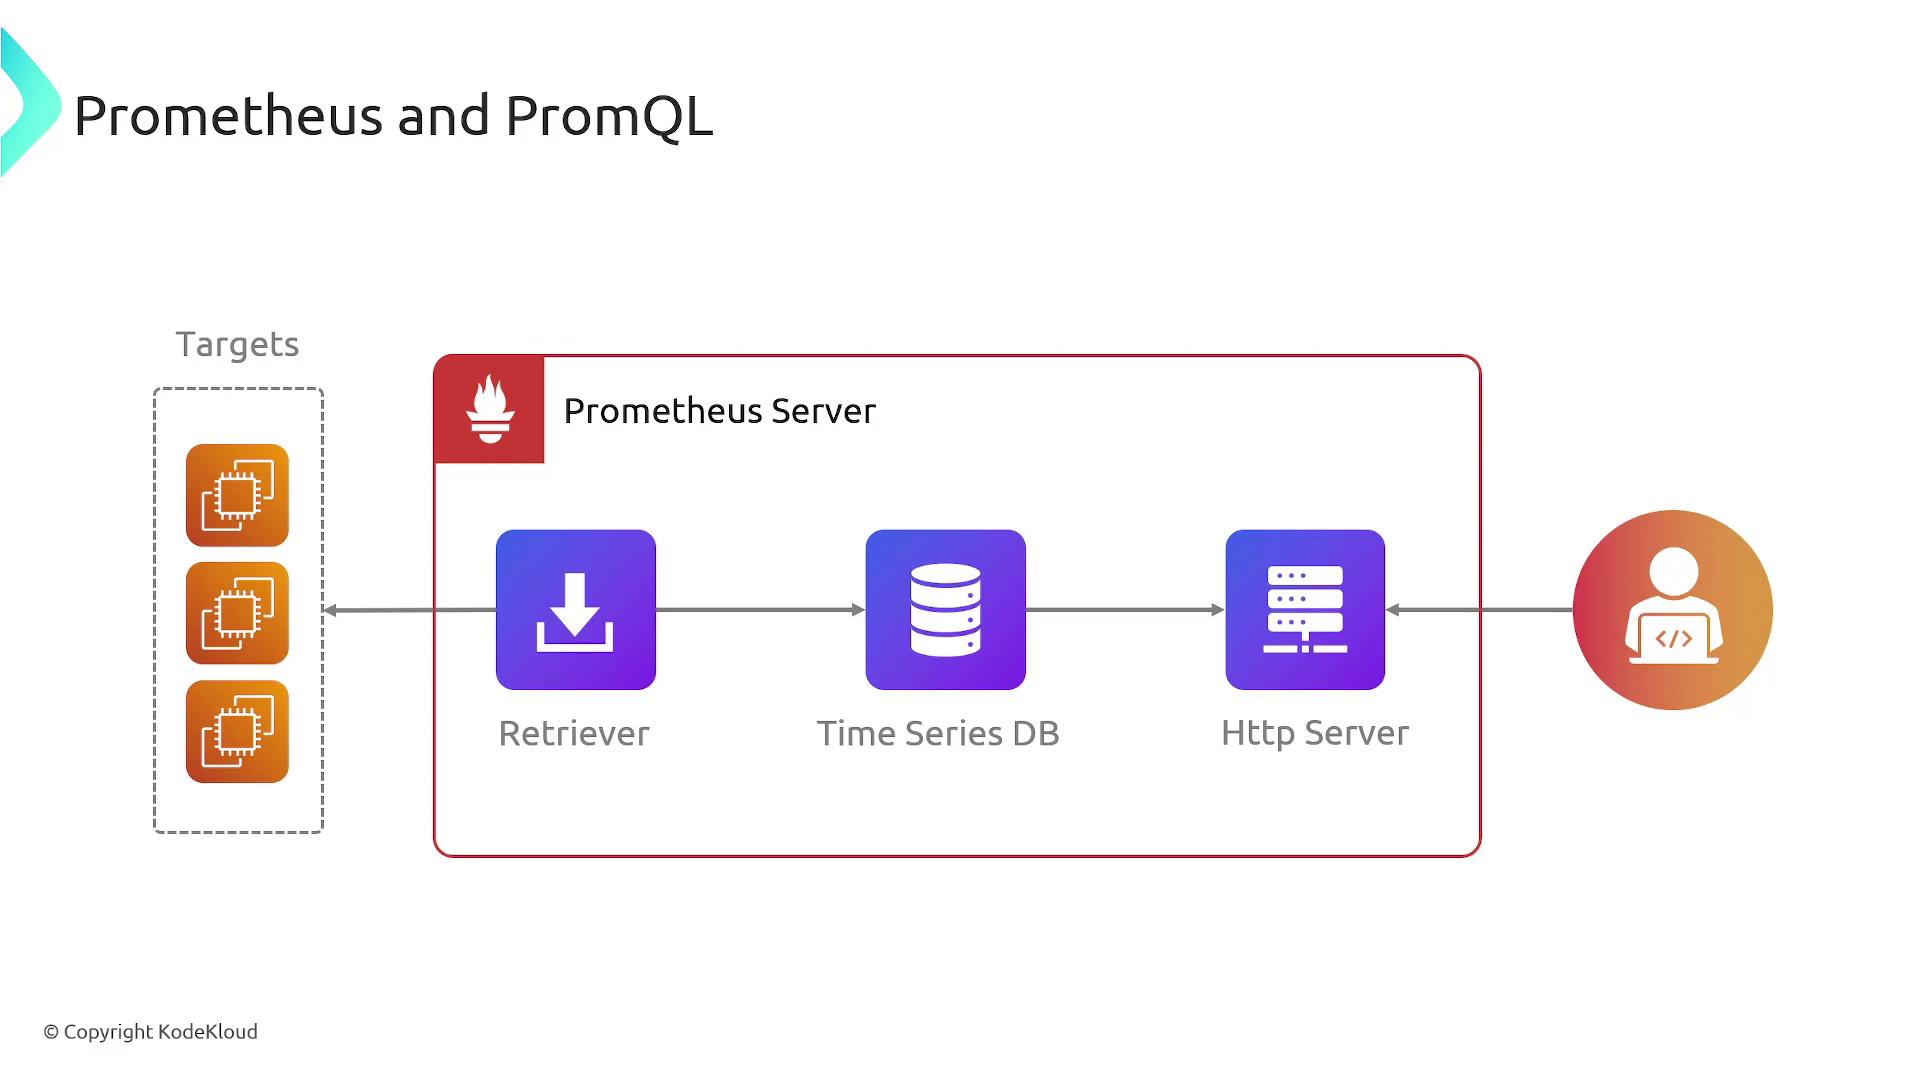
Understanding the core components of Prometheus is key to leveraging its full potential. The primary elements include:

  • Targets: These are the services or applications from which metrics are collected.
  • Receiver: This component gathers metrics from targets by sending HTTP requests at defined intervals.
  • Time Series Database: Metrics are stored here, making historical analysis efficient and responsive.
  • HTTP Server: Provides an interface for querying metrics using PromQL, facilitating data analysis and visualization.

The image is a diagram illustrating the architecture of a Prometheus server, showing its components: Retriever, Time Series DB, and HTTP Server, along with its interaction with targets and users.

Managed Prometheus on AWS

Managing a Prometheus server can be challenging due to the necessity of ensuring its health, handling high traffic, and scaling resources as needed. Amazon Managed Prometheus simplifies these challenges by handling the underlying infrastructure, allowing you to focus on monitoring and analysis.

Metrics from various services—such as those running on an Amazon Elastic Container Service (AWS ECS) cluster—can be seamlessly directed to the managed Prometheus instance. Once the data is in the system, you can query these metrics with PromQL or visualize them using dashboarding tools like Grafana.

The image is a diagram illustrating the Amazon Managed Service for Prometheus, showing the flow from an ECS Cluster in a VPC to Amazon Managed Grafana, with steps for collecting, monitoring, and analyzing metrics.

Key features of Amazon Managed Prometheus include:

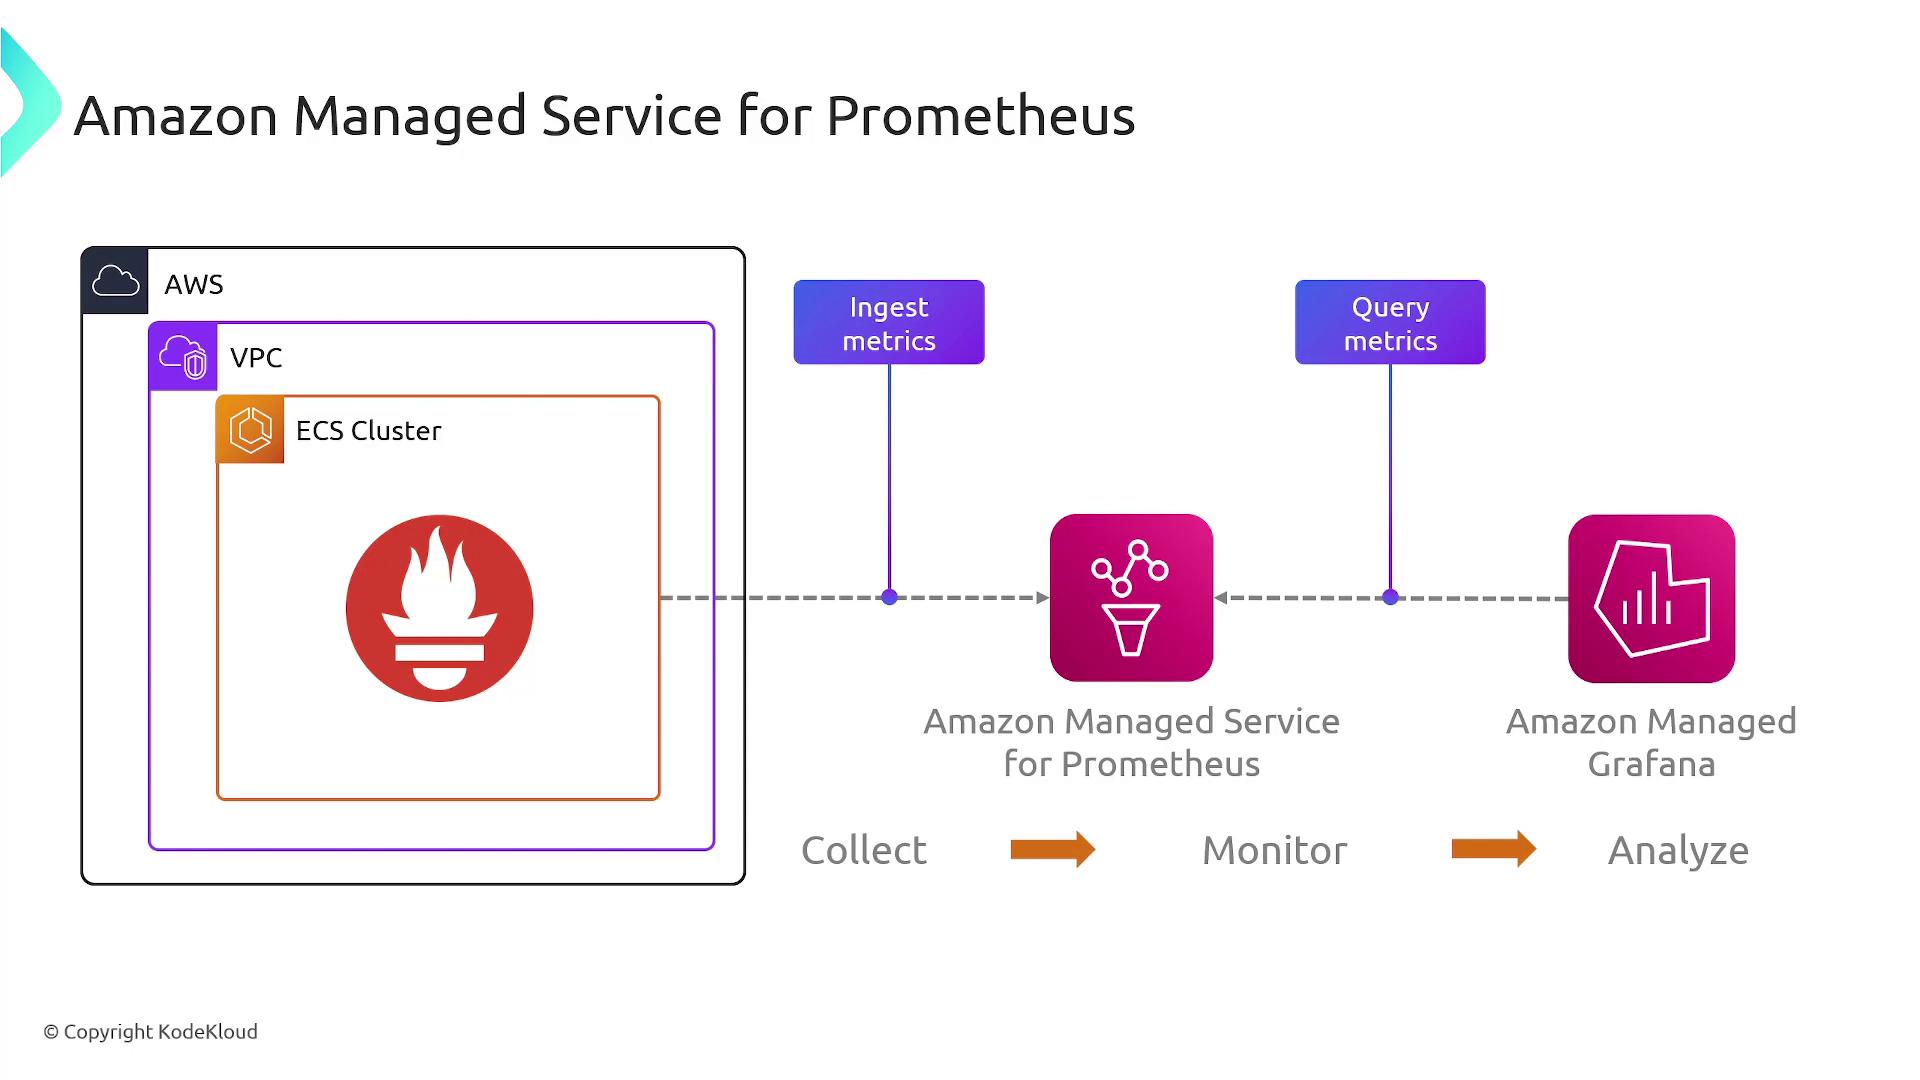
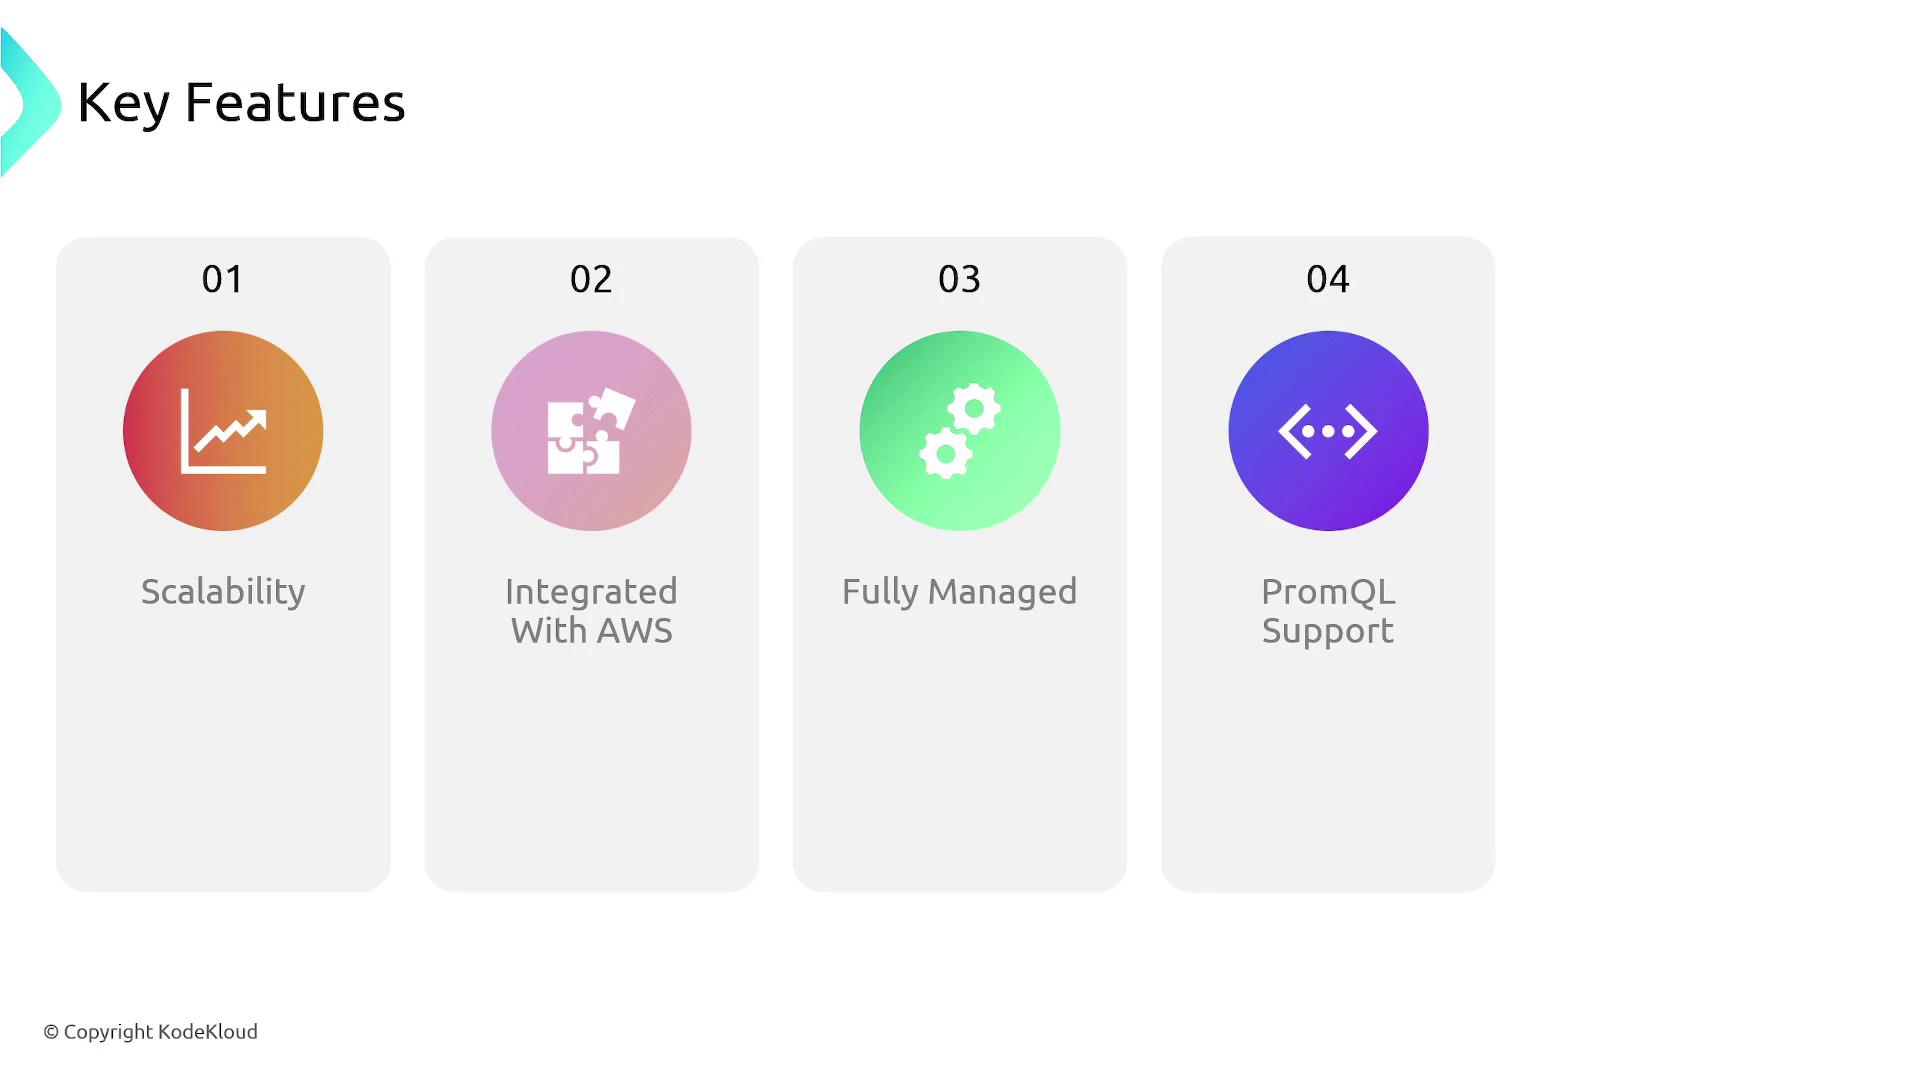
  • Automatic scaling to manage increased workloads.
  • Seamless integration with AWS services such as Amazon Elastic Compute Cloud (EC2), AWS EKS, AWS Lambda, and Amazon ECS.
  • Reduced operational overhead, thanks to AWS managing the infrastructure.
  • Robust support for PromQL, empowering you to filter, aggregate, and analyze your metrics efficiently.
  • Cost-effectiveness with a pay-as-you-go pricing model.

The image lists four key features: Scalability, Integrated with AWS, Fully Managed, and PromQL Support, each represented with an icon.

Integrating Prometheus with CloudWatch

A common and powerful use case is integrating Prometheus with CloudWatch. Imagine a containerized application running not only in an EKS cluster but also in an on-premises environment. Prometheus employs service discovery to identify and monitor all relevant targets, and it allows you to configure alerting rules within its setup.

In a standalone Prometheus setup, you might use Alert Manager to send notifications directly via email or Slack. When integrated with AWS, these alerts can be relayed to AWS CloudWatch, which then routes the notifications to your on-call team through channels like SNS. This ensures a prompt and systematic response to any incidents.

The image illustrates a workflow for Amazon Managed Service for Prometheus, showing a sequence from Prometheus to Alert Manager and then to Amazon SNS, with triggers for threshold alerts.

Note

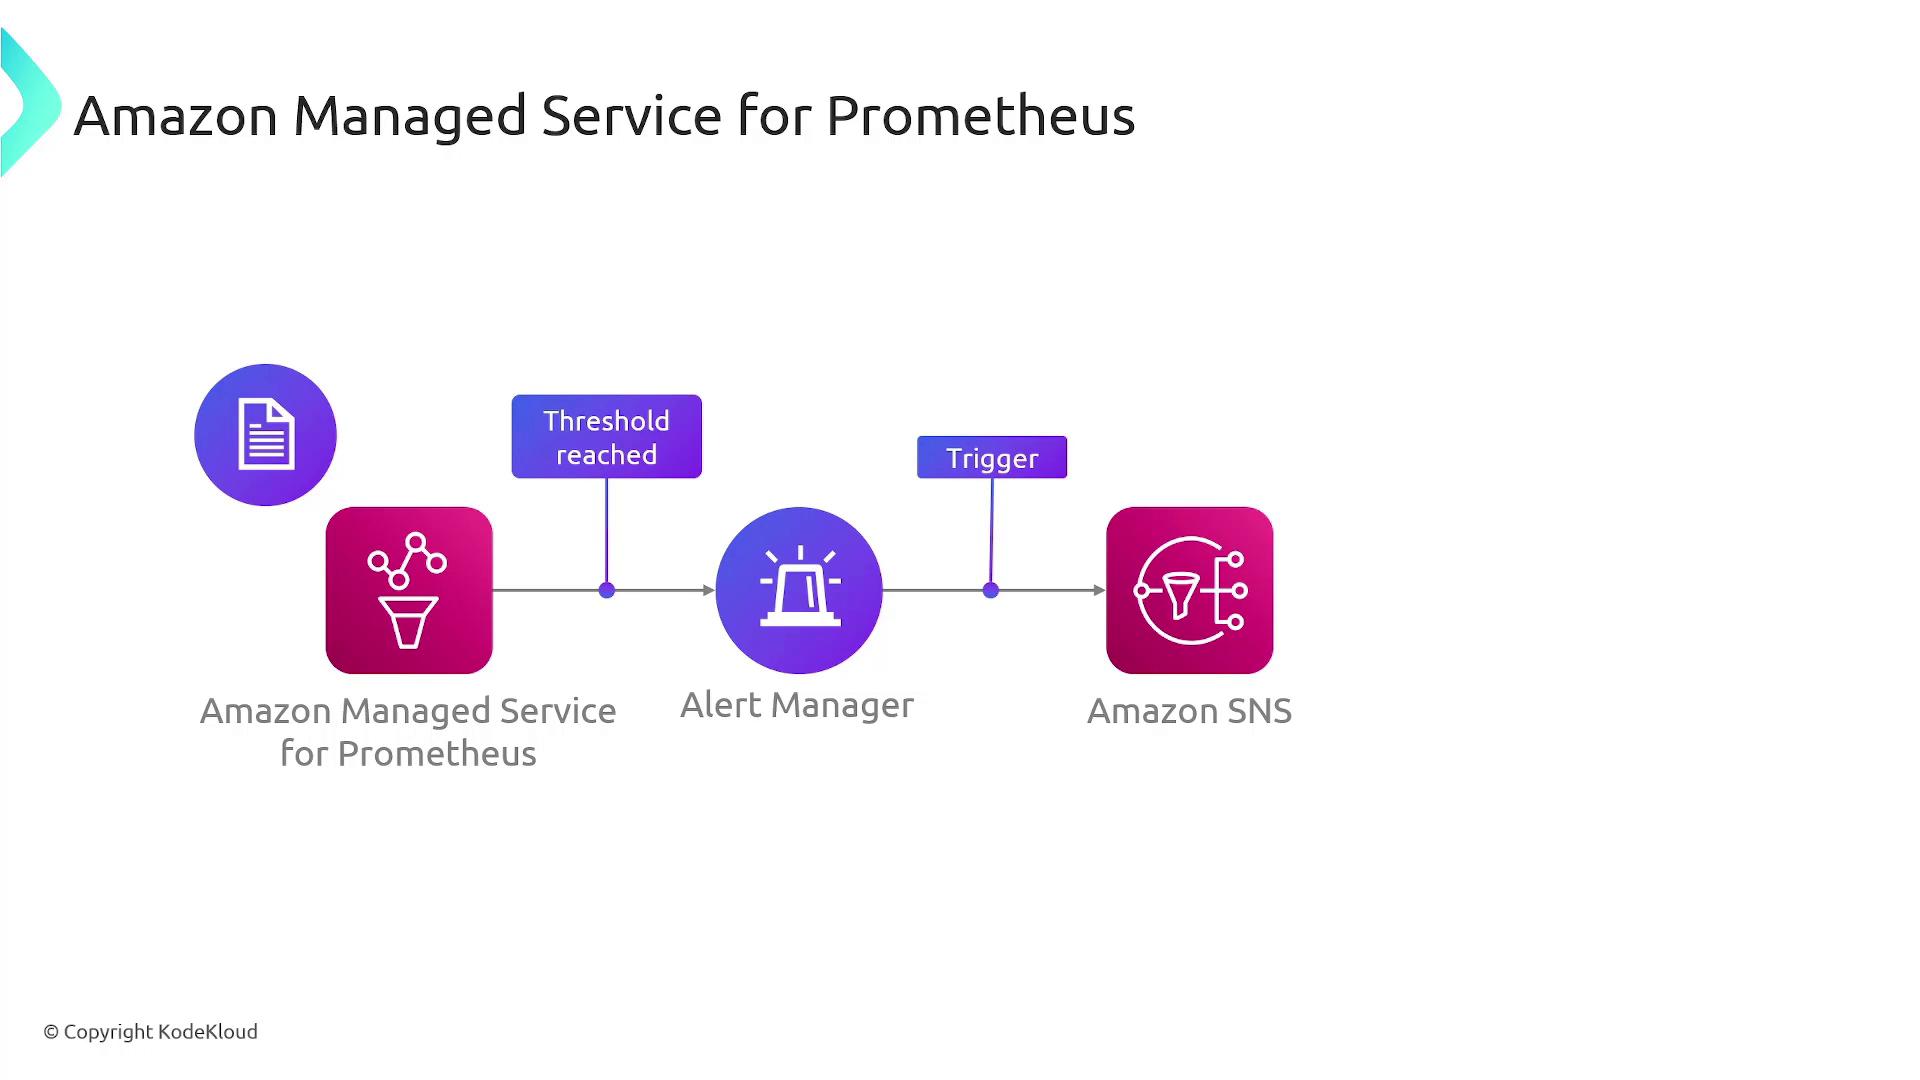
For a deeper dive into how Prometheus compares with other monitoring solutions, explore our detailed articles on modern monitoring practices.

In summary, Prometheus delivers a robust, scalable, and flexible monitoring framework that ensures your systems remain healthy and issues are resolved quickly. Its extensive ecosystem, integration with managed services, and comprehensive query capabilities make it an essential tool for proactive system management.

Additional Resources

For further reading and related topics, explore the following resources:

Watch Video

Watch video content

Previous
AWS Health Dashboard