Key Performance Metrics
| Metric Category | Metrics | Why It Matters |
|---|---|---|
| CPU Performance | CPU usage, CPU load | Identifies processing bottlenecks and scaling needs. |
| Memory Utilization | RAM consumption, memory pressure | Ensures application responsiveness and stability. |
| Disk Performance | IOPS, throughput, latency | Measures storage efficiency and data access speed. |
Monitoring CPU, memory, and disk metrics proactively helps prevent performance degradation and service outages.
Azure Monitoring Tools
| Tool | Description | Reference |
|---|---|---|
| Azure Monitor | Centralized platform to collect and analyze telemetry. | Azure Monitor docs |
| Application Insights | Real-time application performance tracking and diagnostics. | Application Insights docs |
| Log Analytics | Powerful log aggregation and query engine. | Log Analytics docs |
Collecting and Analyzing Telemetry

-
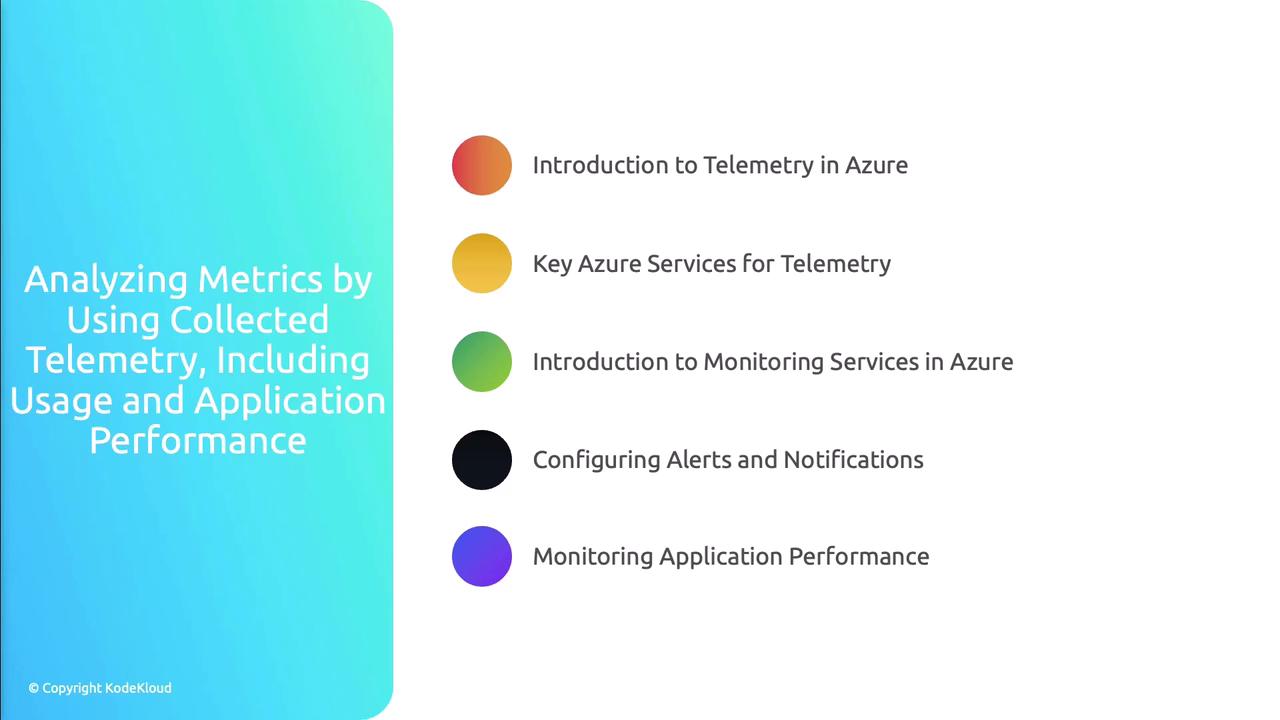
Introduction to Telemetry in Azure
Collect performance and usage data from applications and infrastructure using Azure Monitor agents and SDKs. -
Analyzing Usage Metrics
Use built-in reports and queries in Log Analytics to understand service consumption patterns and optimize resource allocation. -
Monitoring Application Performance
Integrate Application Insights SDK into your codebase for end-to-end transaction tracking and real-time root-cause analysis. -
Configuring Alerts and Notifications
Define alert rules in Azure Monitor based on metric thresholds or log query results to receive proactive notifications. -
Creating Custom Dashboards
Build interactive dashboards in the Azure portal to visualize the most critical metrics, charts, and logs in one place.
Best Practices for Azure Telemetry
- Define clear, actionable alert thresholds to minimize false positives.
- Encrypt telemetry data both in transit and at rest to ensure compliance.
- Automate the provisioning of monitoring resources using Infrastructure as Code (IaC).
- Regularly review and refine dashboards and alert rules as application workloads evolve.
Over-alerting can lead to alert fatigue. Ensure each notification delivers actionable insights.