Accessing Azure Log Analytics
- Sign in to the Azure portal.
- In the search bar, type Log Analytics and select the service.
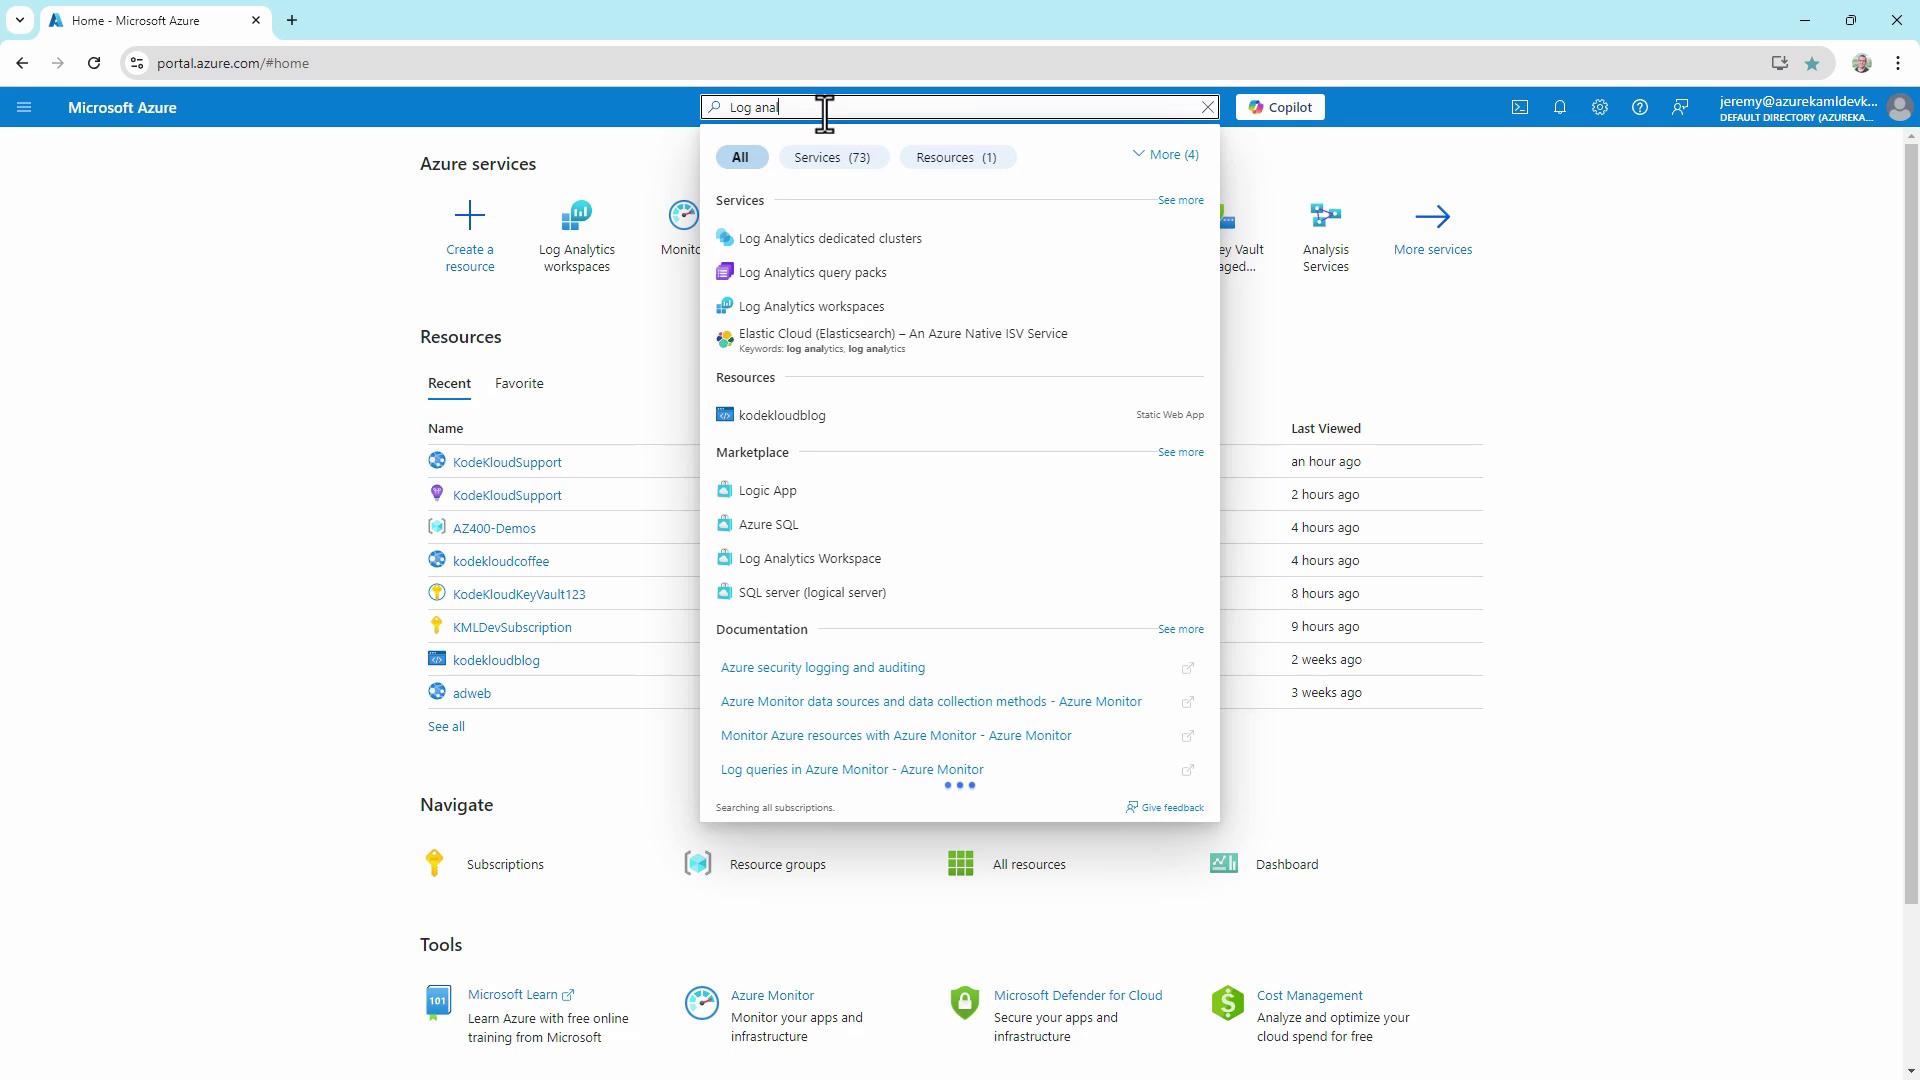
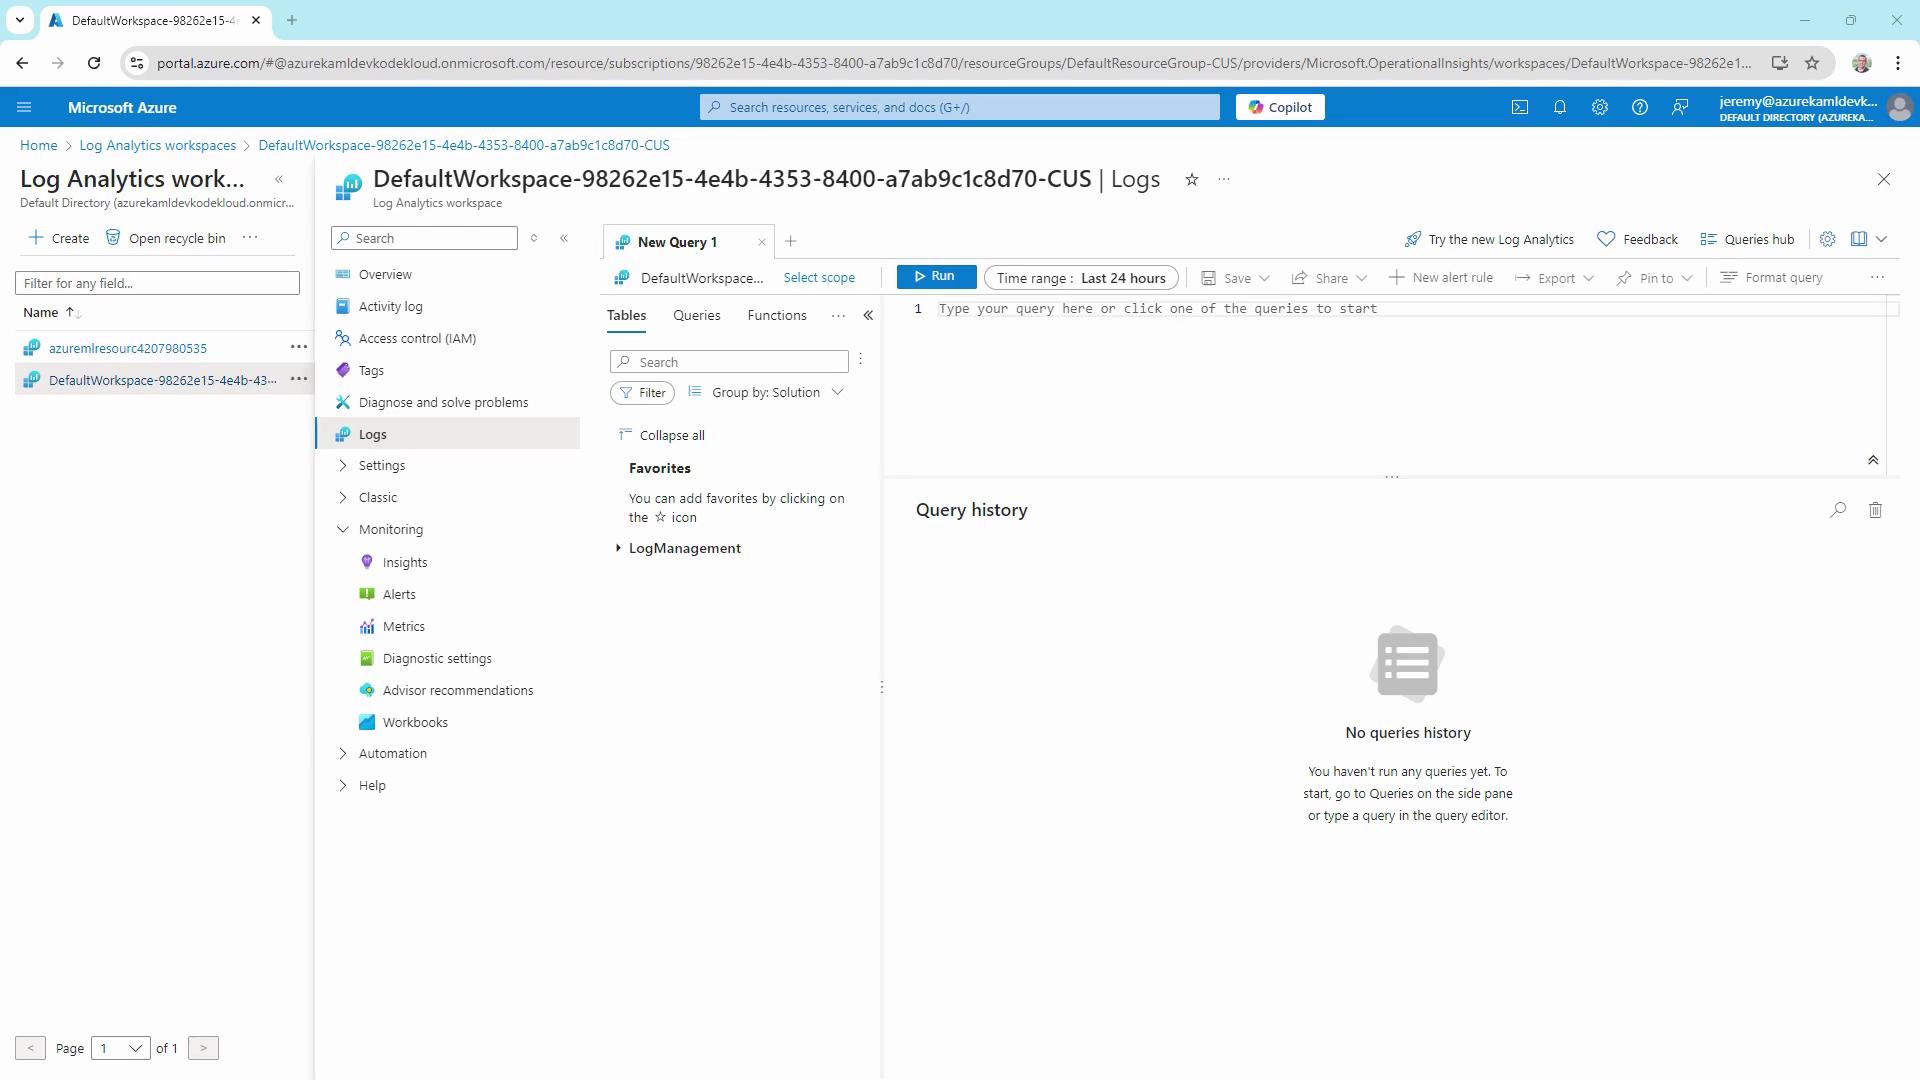
- Choose your workspace and click Logs to launch the query interface.
1. Filtering Security Log Data
Filtering is the foundation of any log investigation. Below are examples querying theSecurityEvent table.
Retrieve the last 24 hours of security events (limit to 10 records):
EventID 4625 indicates an account failed to log on. Use Microsoft’s official Event ID reference to explore other security events.
2. Summarizing Failed Logins by Account
To identify which accounts are targeted most frequently, aggregate and sort failed login counts: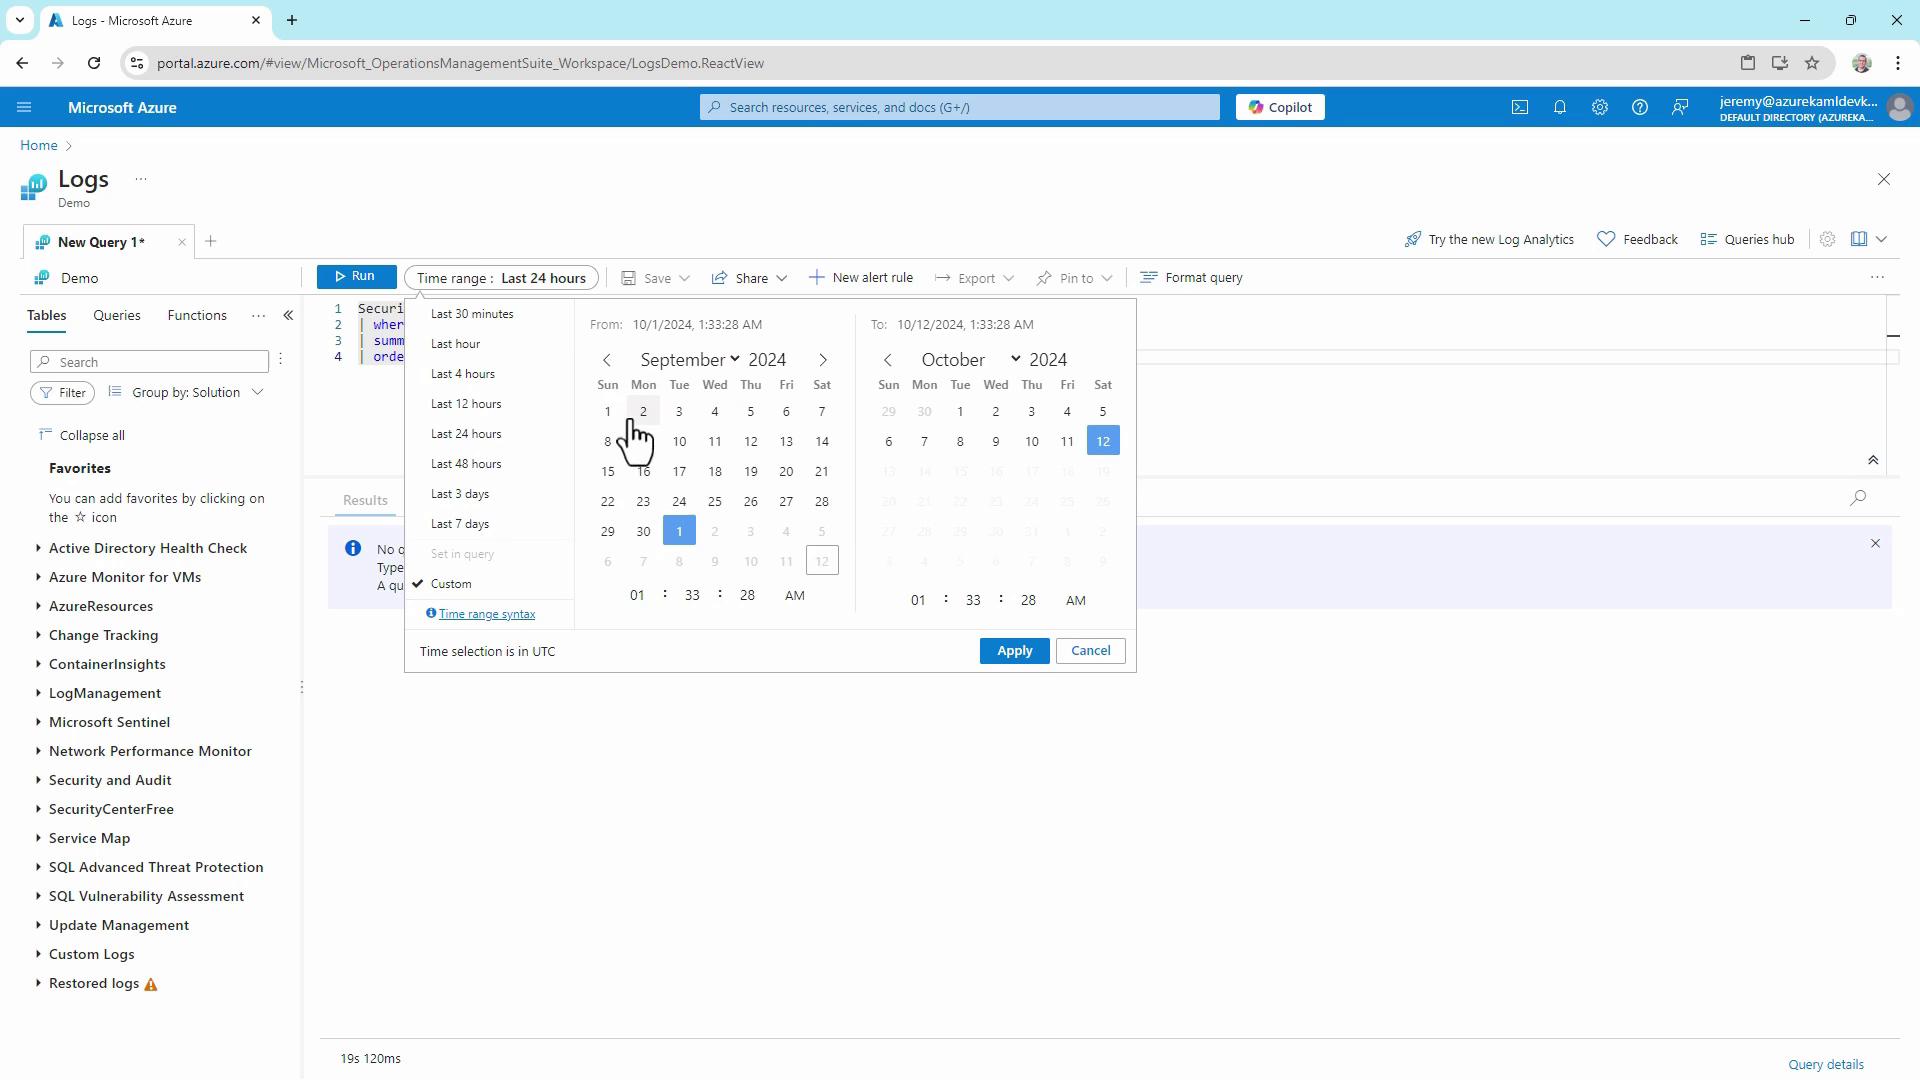
Key KQL Functions
| Function | Description | Example |
|---|---|---|
| ago() | Filters records by relative time | where TimeGenerated > ago(7d) |
| project | Selects specific columns | project TimeGenerated, ResourceGroup |
| summarize | Aggregates rows | summarize count() by OperationName |
| order by | Sorts the output | order by count_ desc |
3. Querying Azure Resource Logs
Azure resource logs, including activity and diagnostic data, are stored in theAzureDiagnostics table.
Fetch the last 7 days of resource operations:
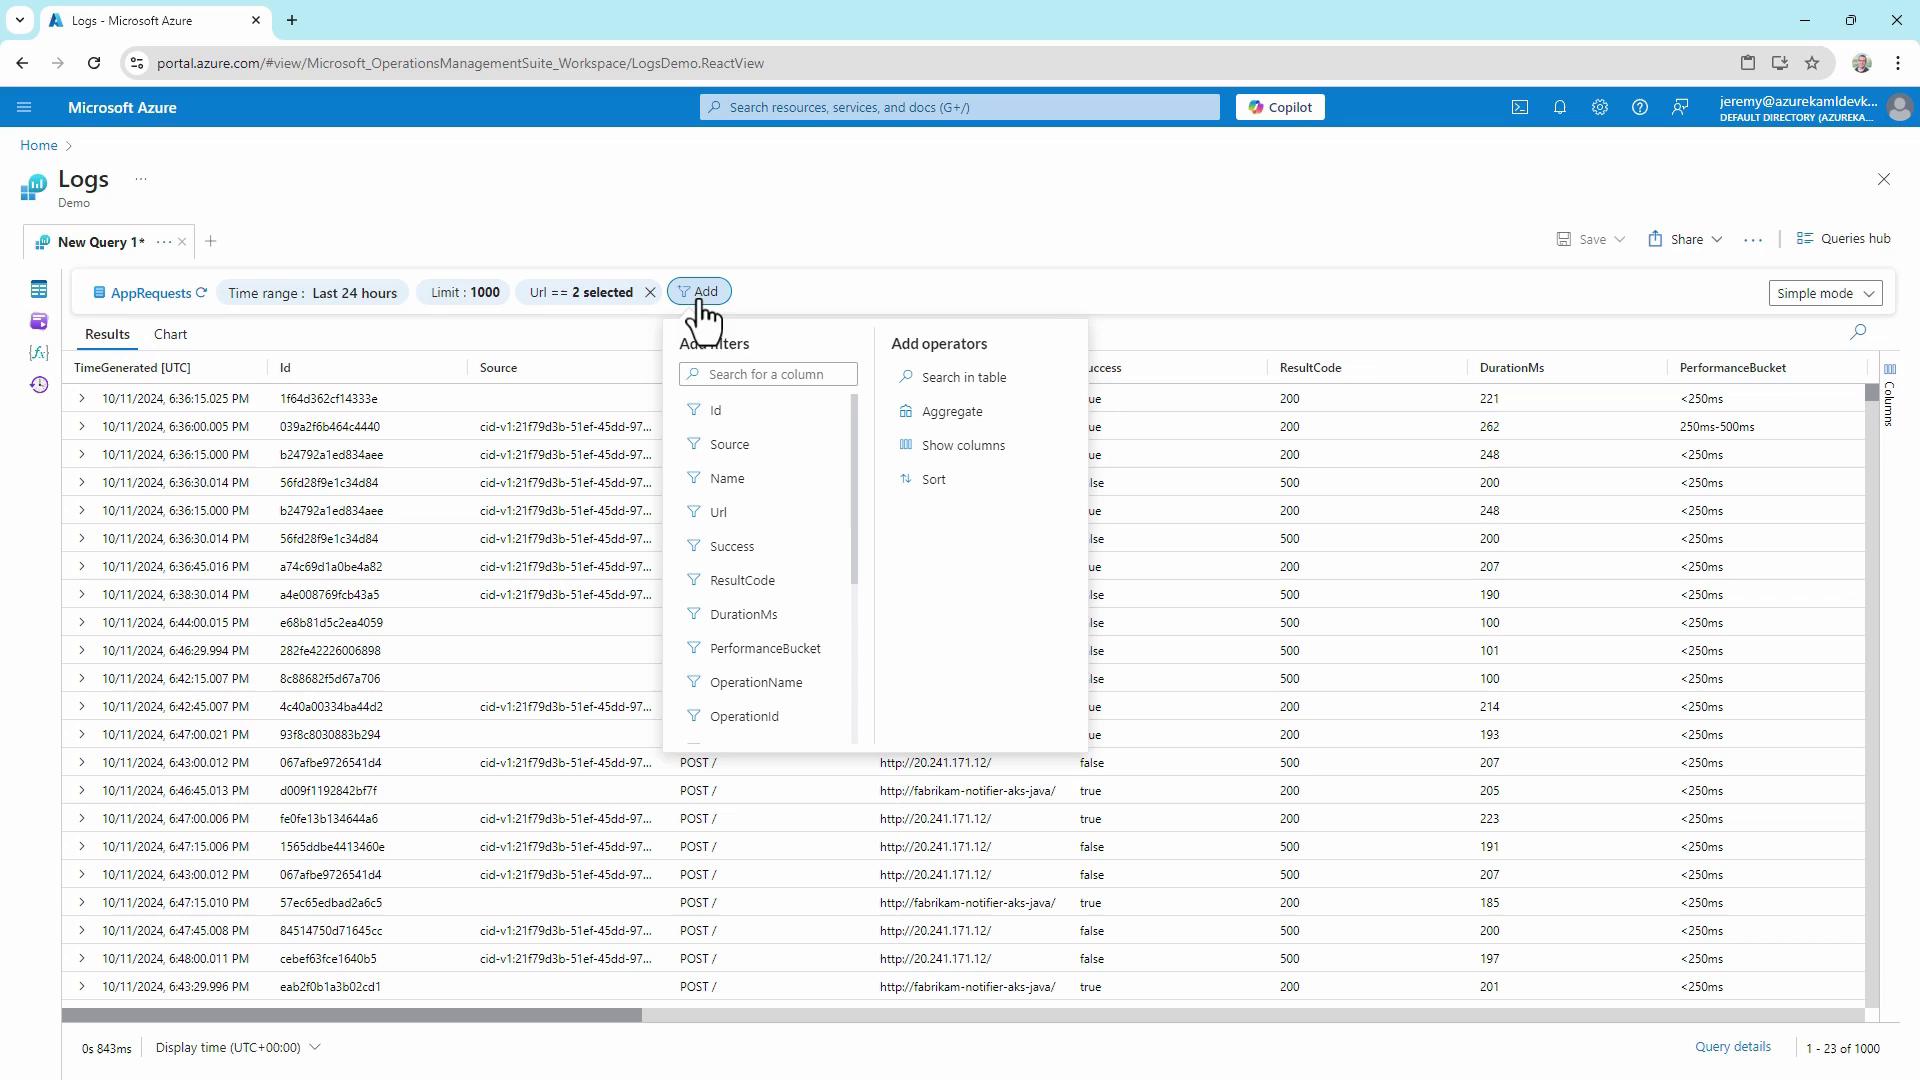
4. Switching Between UI and KQL Modes
Azure Log Analytics now offers two query experiences:- Simple Mode: Drag-and-drop interface to select tables, apply filters, and set limits without writing code.
- KQL Mode: Full control to write custom queries.
5. Sharing and Exporting Results
Once your query returns data, you can:- Copy a secure link to share the query
- Export results to CSV (all rows or displayed columns)
- Copy results to the clipboard
Be cautious when sharing or exporting sensitive log data. Always follow your organization’s data governance policies.
With these techniques, you can:
- Filter and project security events
- Aggregate and rank failed logins
- Query Azure resource diagnostics
- Navigate both UI-driven and code-driven analysis
- Securely share or export log data