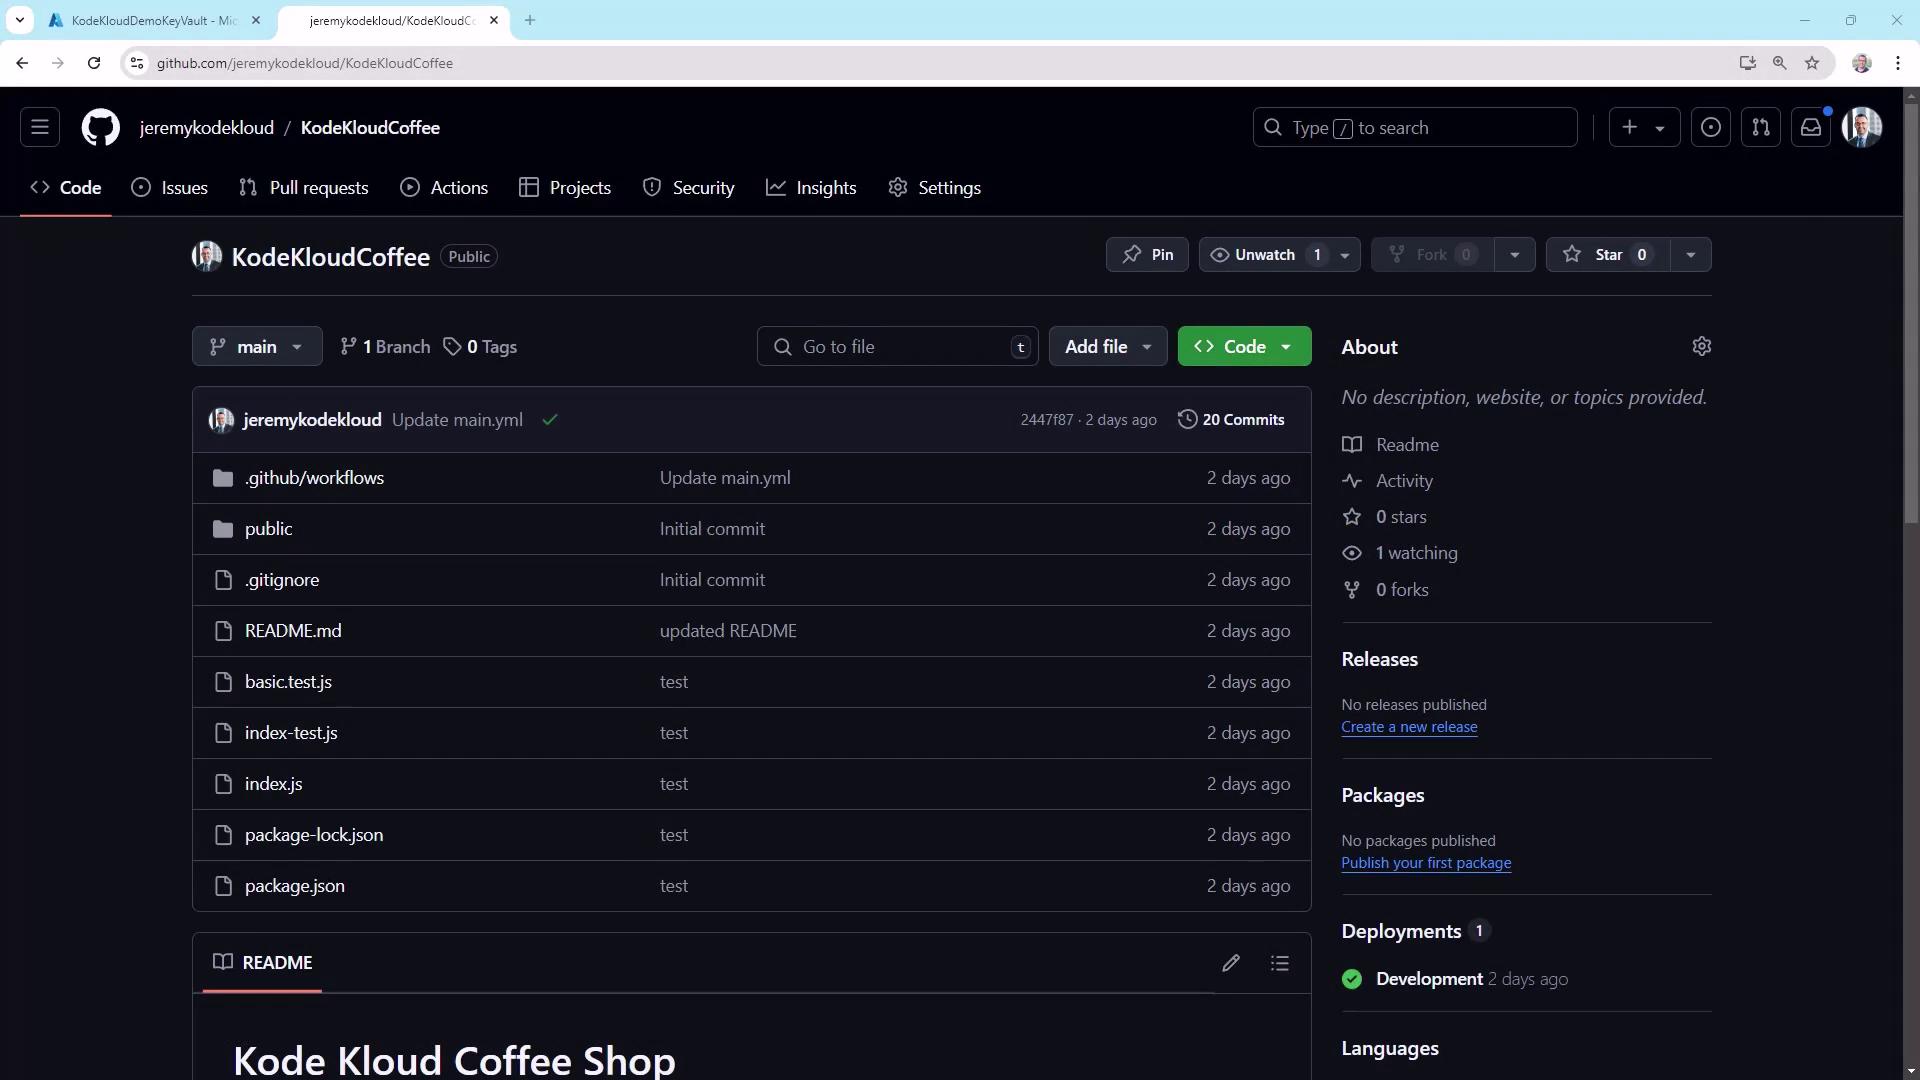
Repository Overview
Start by reviewing the structure of your repository. For example, here’s the KodeKloudCoffee project:
GitHub Insights Overview
Navigate to Insights in your repository to see an at-a-glance summary of activity: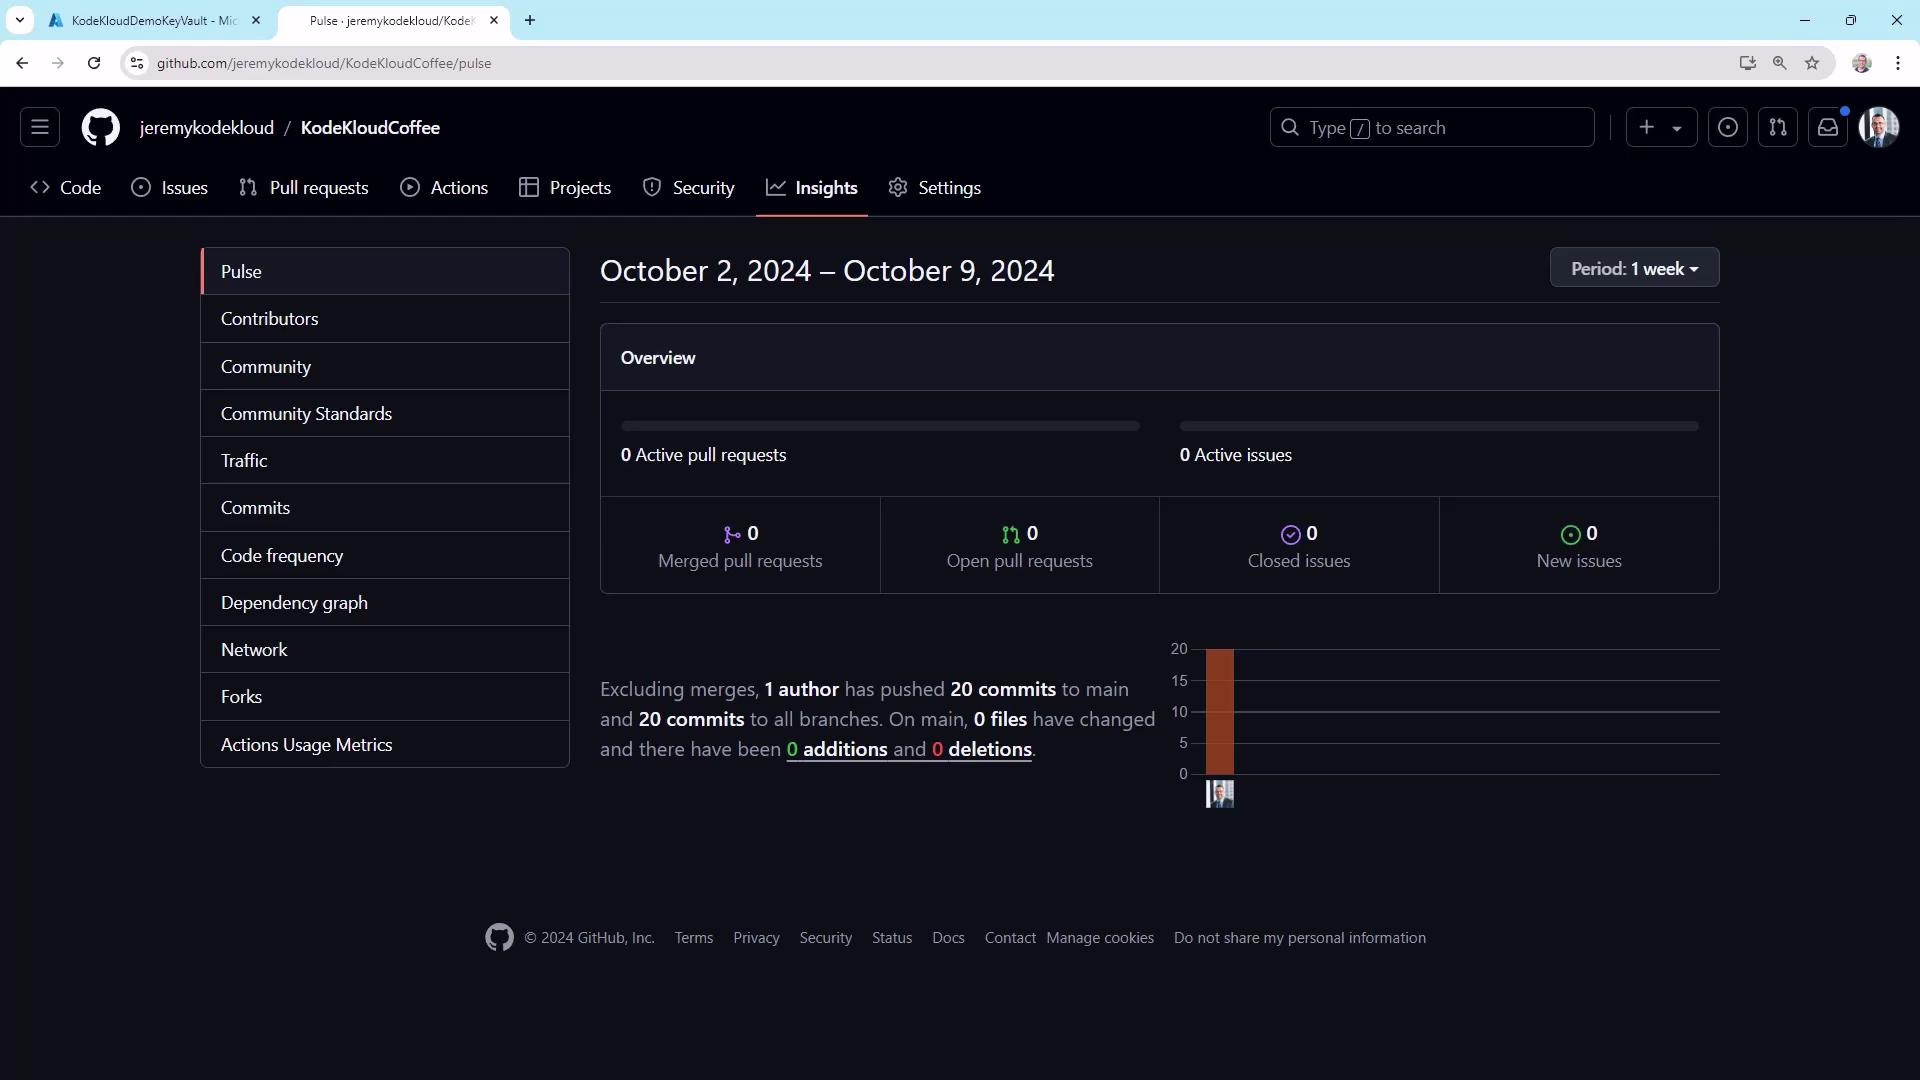
- Pull request and issue activity
- Commit counts by branch and author
- Weekly trends and contribution spikes
Key Monitoring Features at a Glance
| Monitoring Area | Location | Key Metrics |
|---|---|---|
| Insights | Insights | Commits, PR cycle time, issue resolution |
| Traffic | Insights → Traffic | Clones, visitors, referring sites |
| Commits & Churn | Insights → Commits | Daily commit volume, code churn |
| Dependency Updates | Insights → Dependency graph | Outdated packages, security alerts |
| Actions Usage | Settings → Actions → Usage | Job runs, minutes consumed, runner type |
Contributors
Discover who’s driving development. Under Insights ▶ Contributors, you’ll see a timeline and per-author breakdown:
- Core contributors vs. occasional committers
- Periods of high or low activity
Community Standards
For public repositories, use Insights ▶ Community Standards to surface missing files:
CODE_OF_CONDUCT.mdCONTRIBUTING.md- Issue & PR templates
Traffic Analytics
Track repository popularity and usage patterns: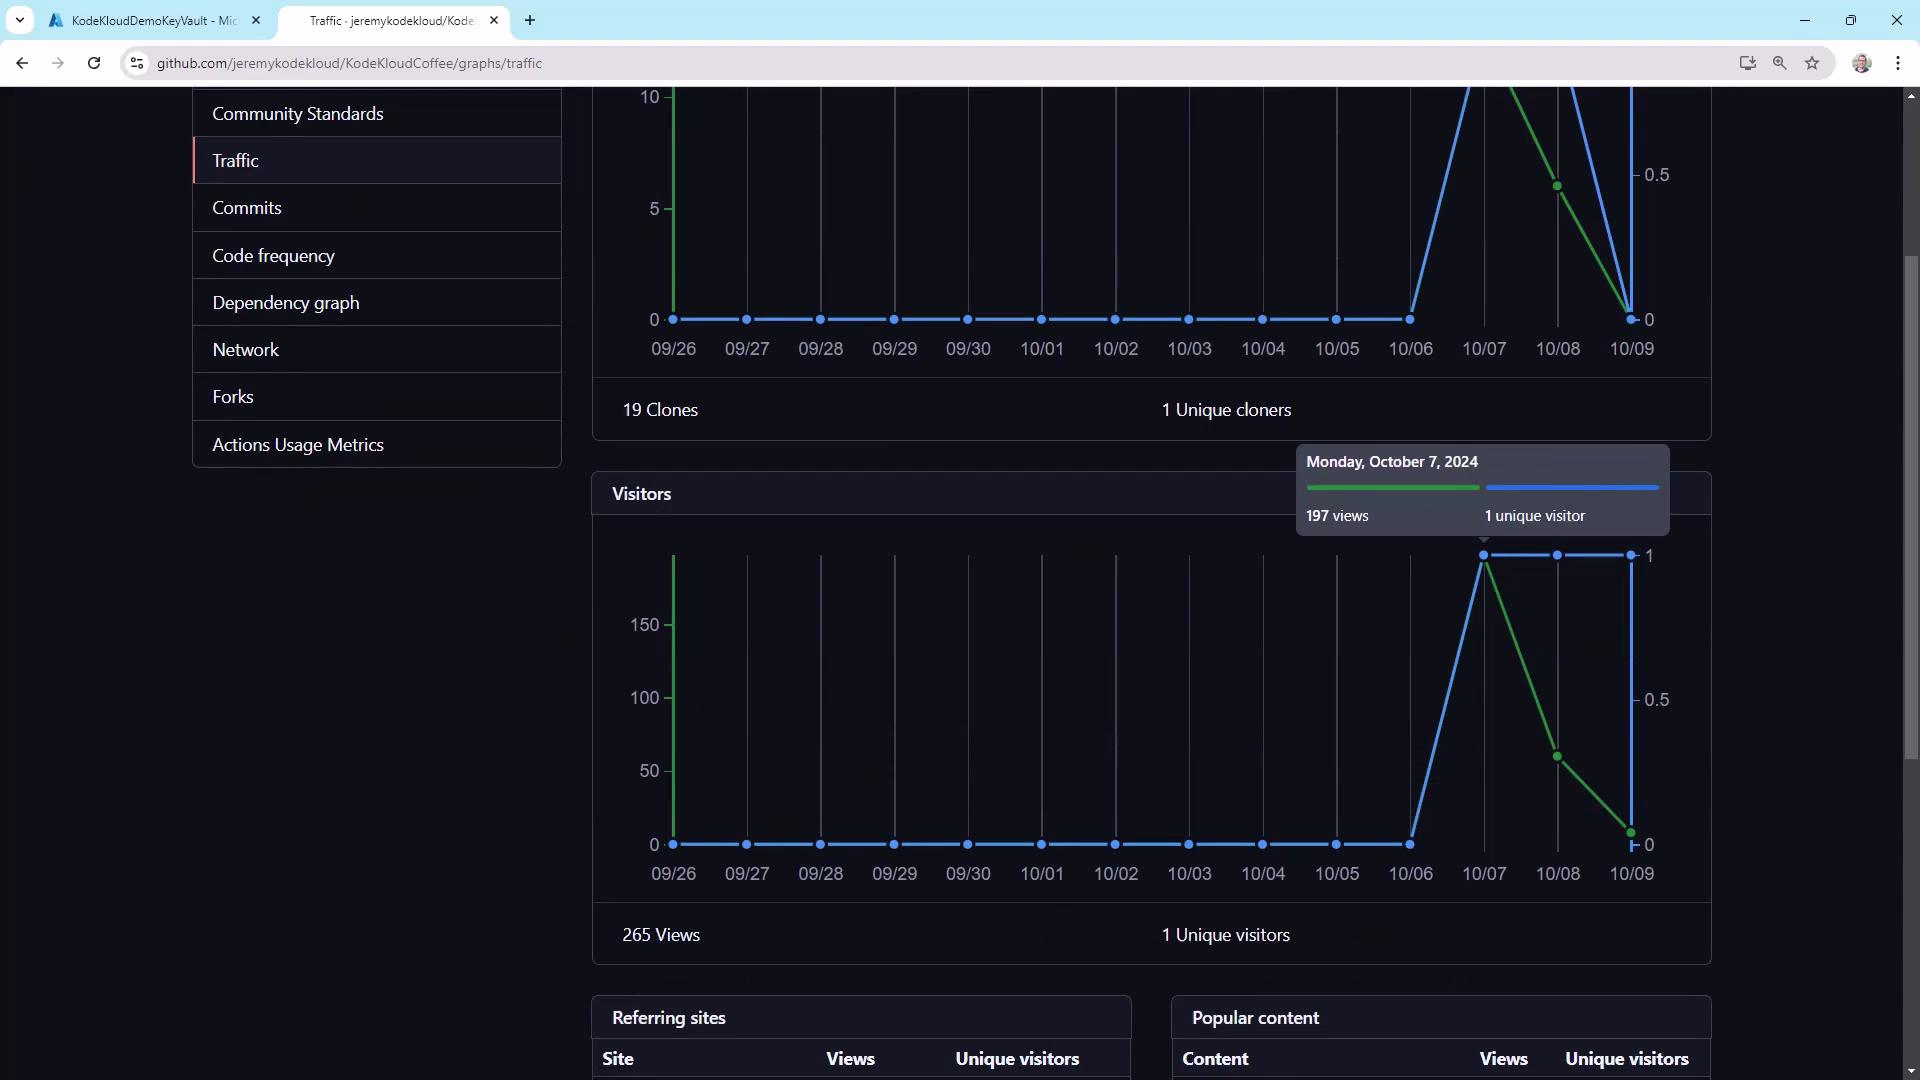
- Total clones vs. unique clones
- Unique visitors vs. page views
- Top referring sites
Public repos benefit the most from traffic metrics, but private projects can still track internal interest and cloning frequency.
Commit Activity and Churn
Review commit spikes and identify possible friction in your CI/CD pipeline: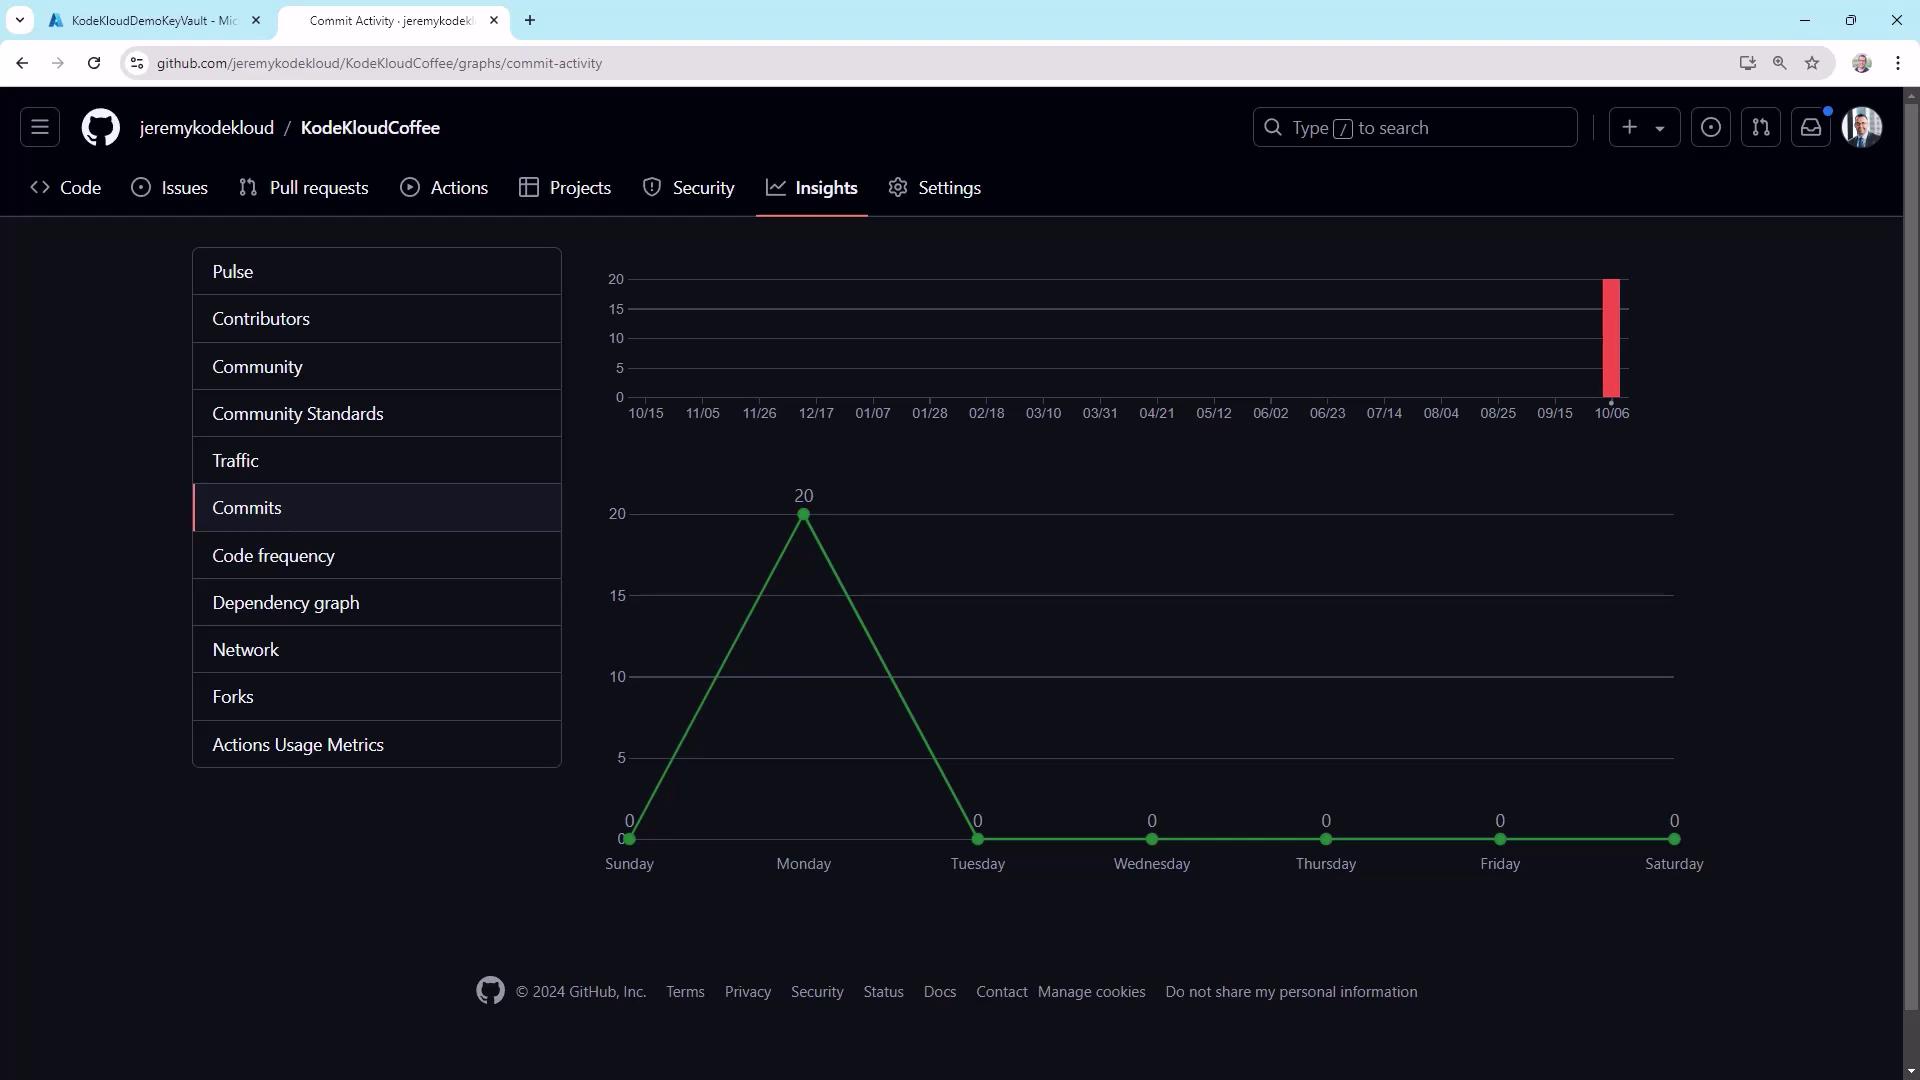
High “churn” (many commits in quick succession) often signals failing tests or deployment loops. Investigate CI logs when you see unusual peaks.
Code Frequency
In Insights → Code frequency, track weekly additions vs. deletions to gauge:- Feature development velocity
- Refactoring or cleanup efforts
Dependency Graph and Dependabot
Stay ahead of security vulnerabilities by enabling Dependabot: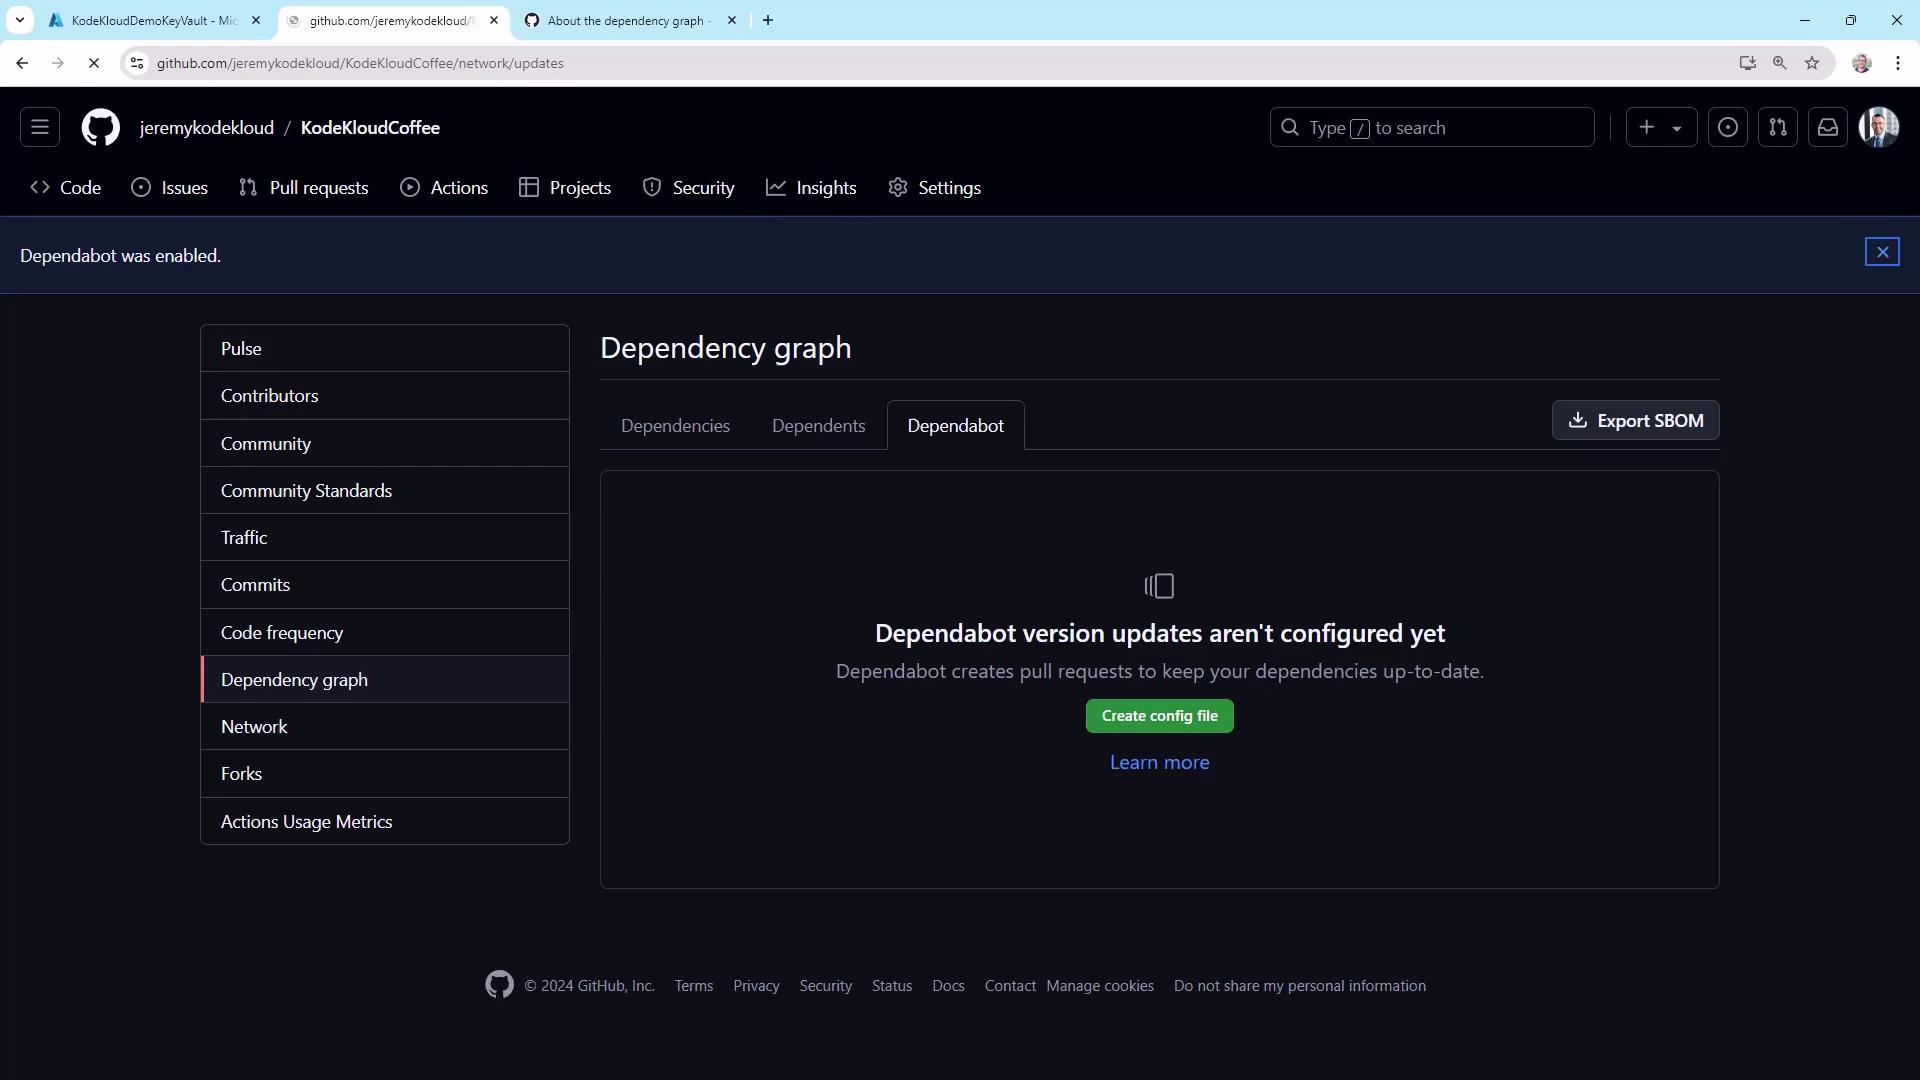
.github/dependabot.yml:
Network Graph
Visualize branching patterns and merges under Insights ▶ Network: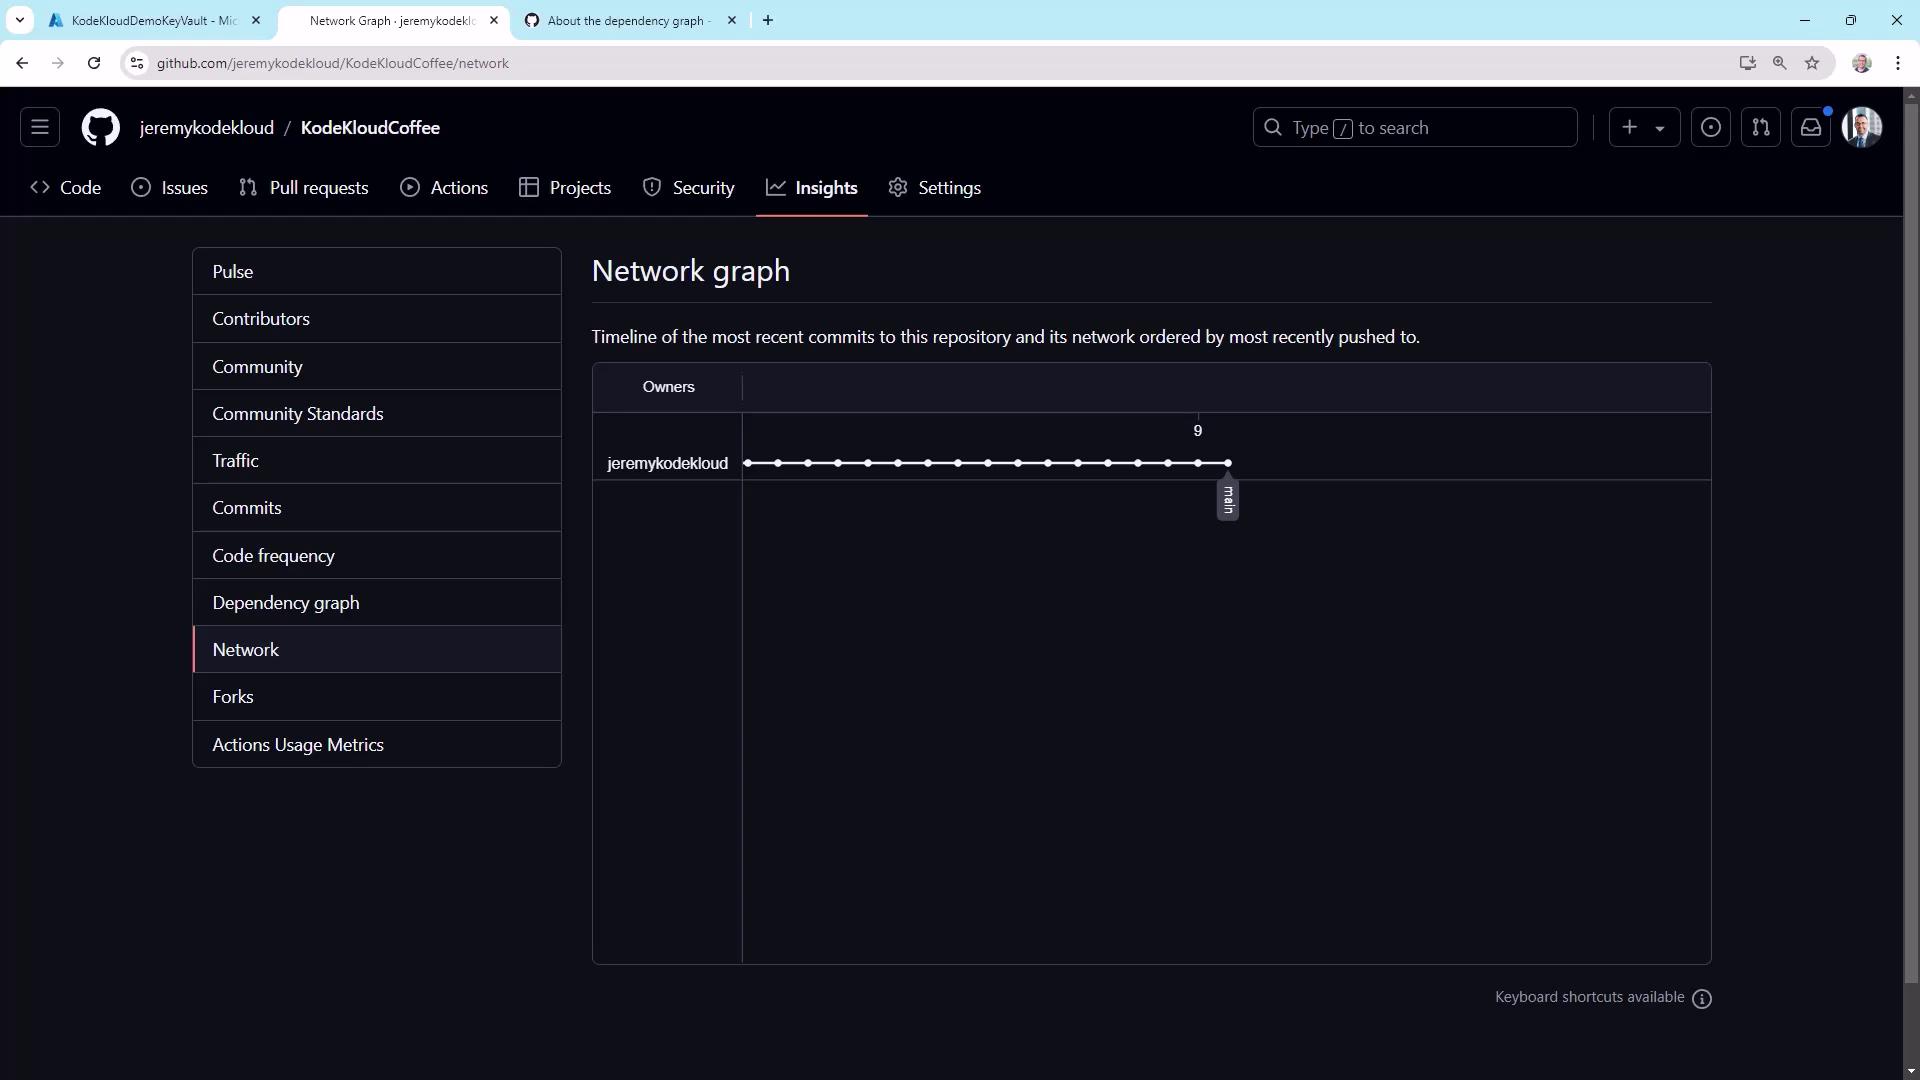
Forks
The Forks counter shows how often others have cloned your repo to contribute. It’s more critical for open-source projects but can indicate internal forks for experimentation.Actions Usage
Monitor CI/CD costs and performance in Settings ▶ Actions ▶ Usage: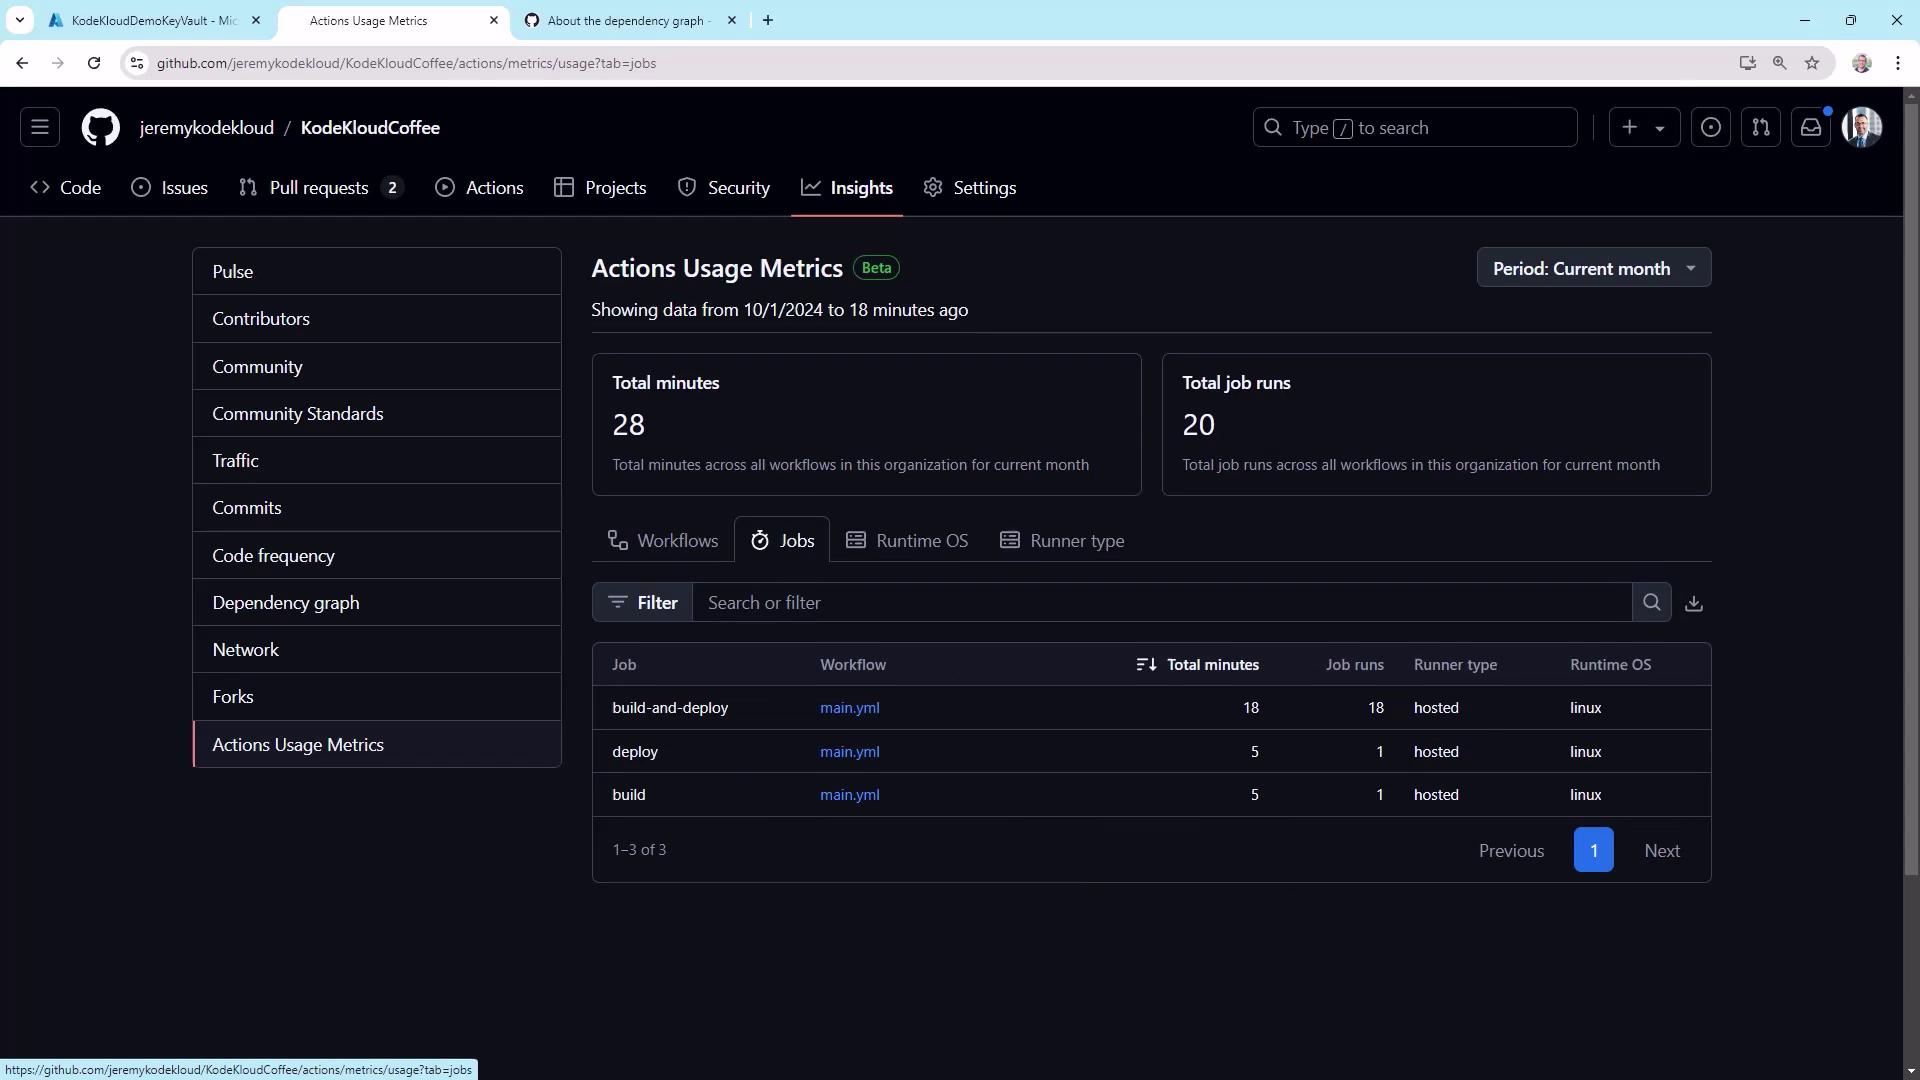
Workflow Runs and Performance
Under Actions, inspect each workflow’s history and timings: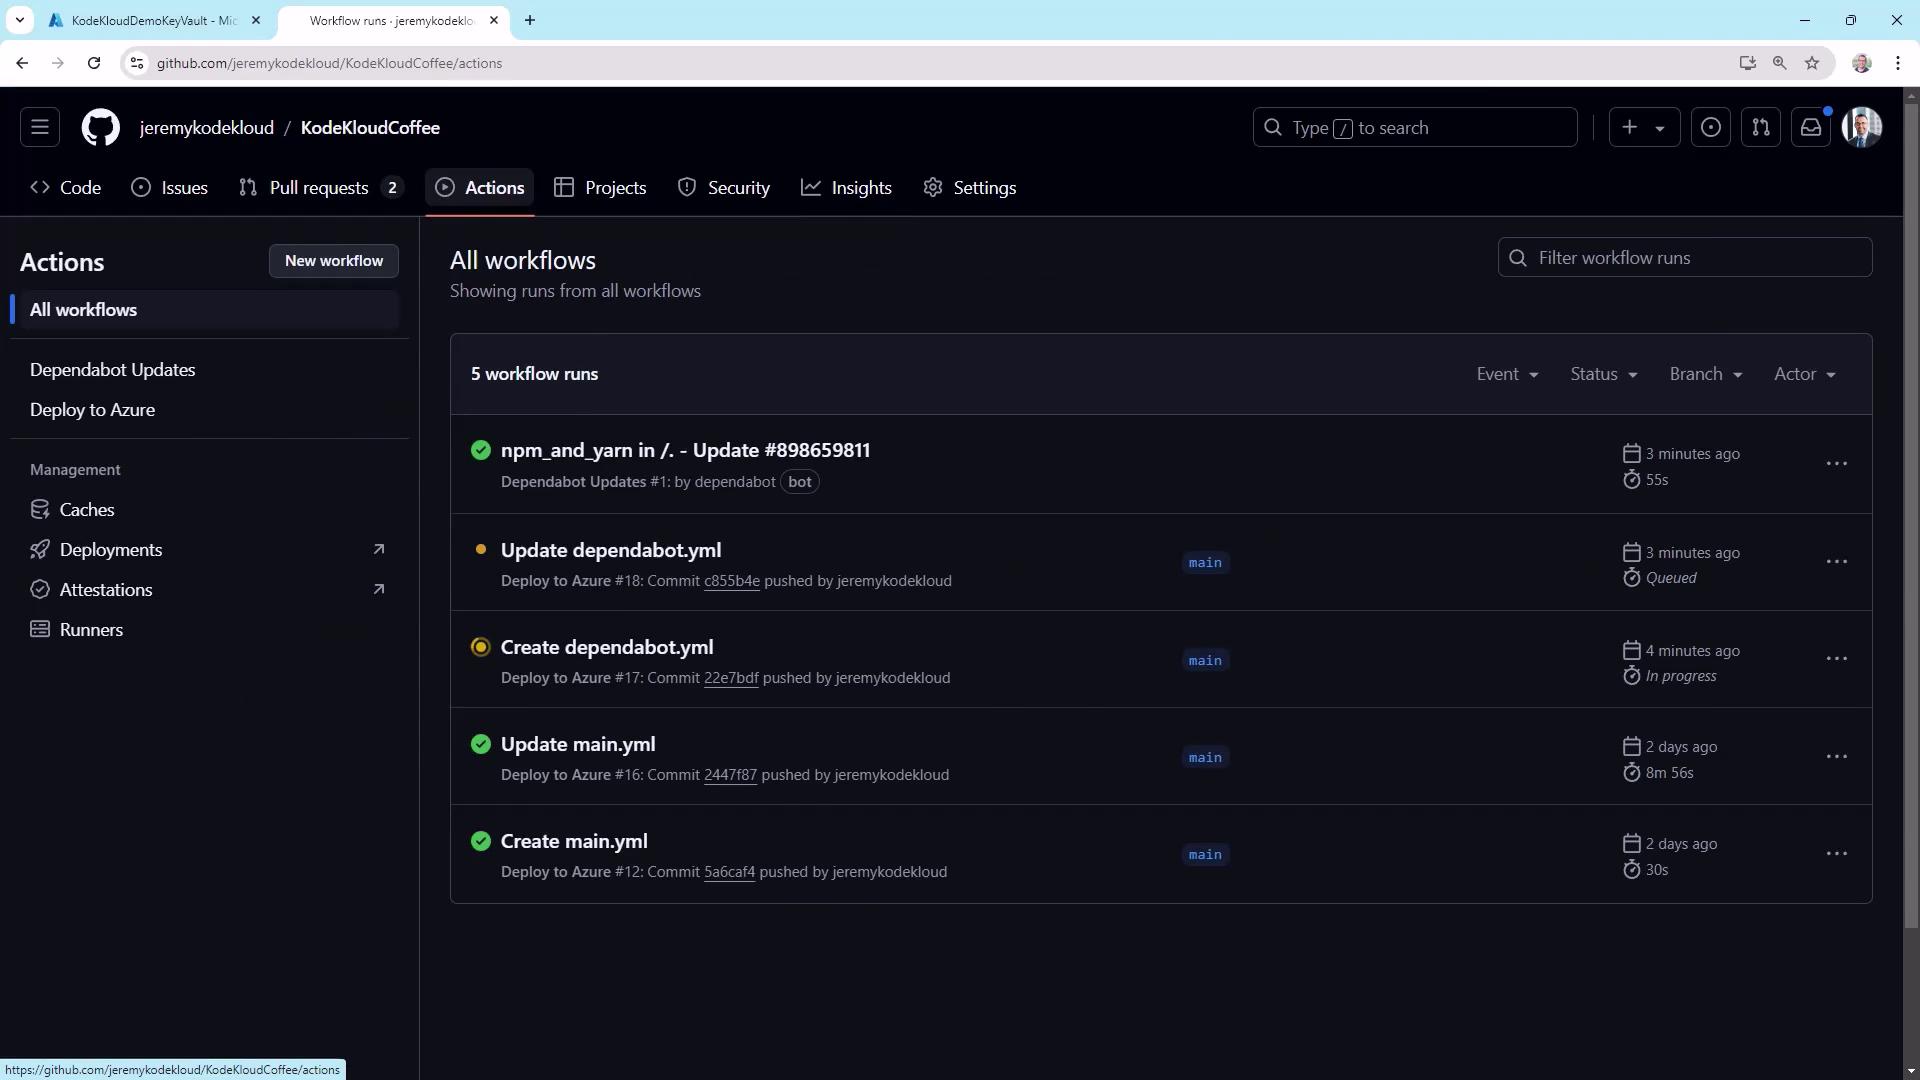
azure/webapps-deploy@v2:
Email Notifications
Set up email alerts in Settings ▶ Notifications: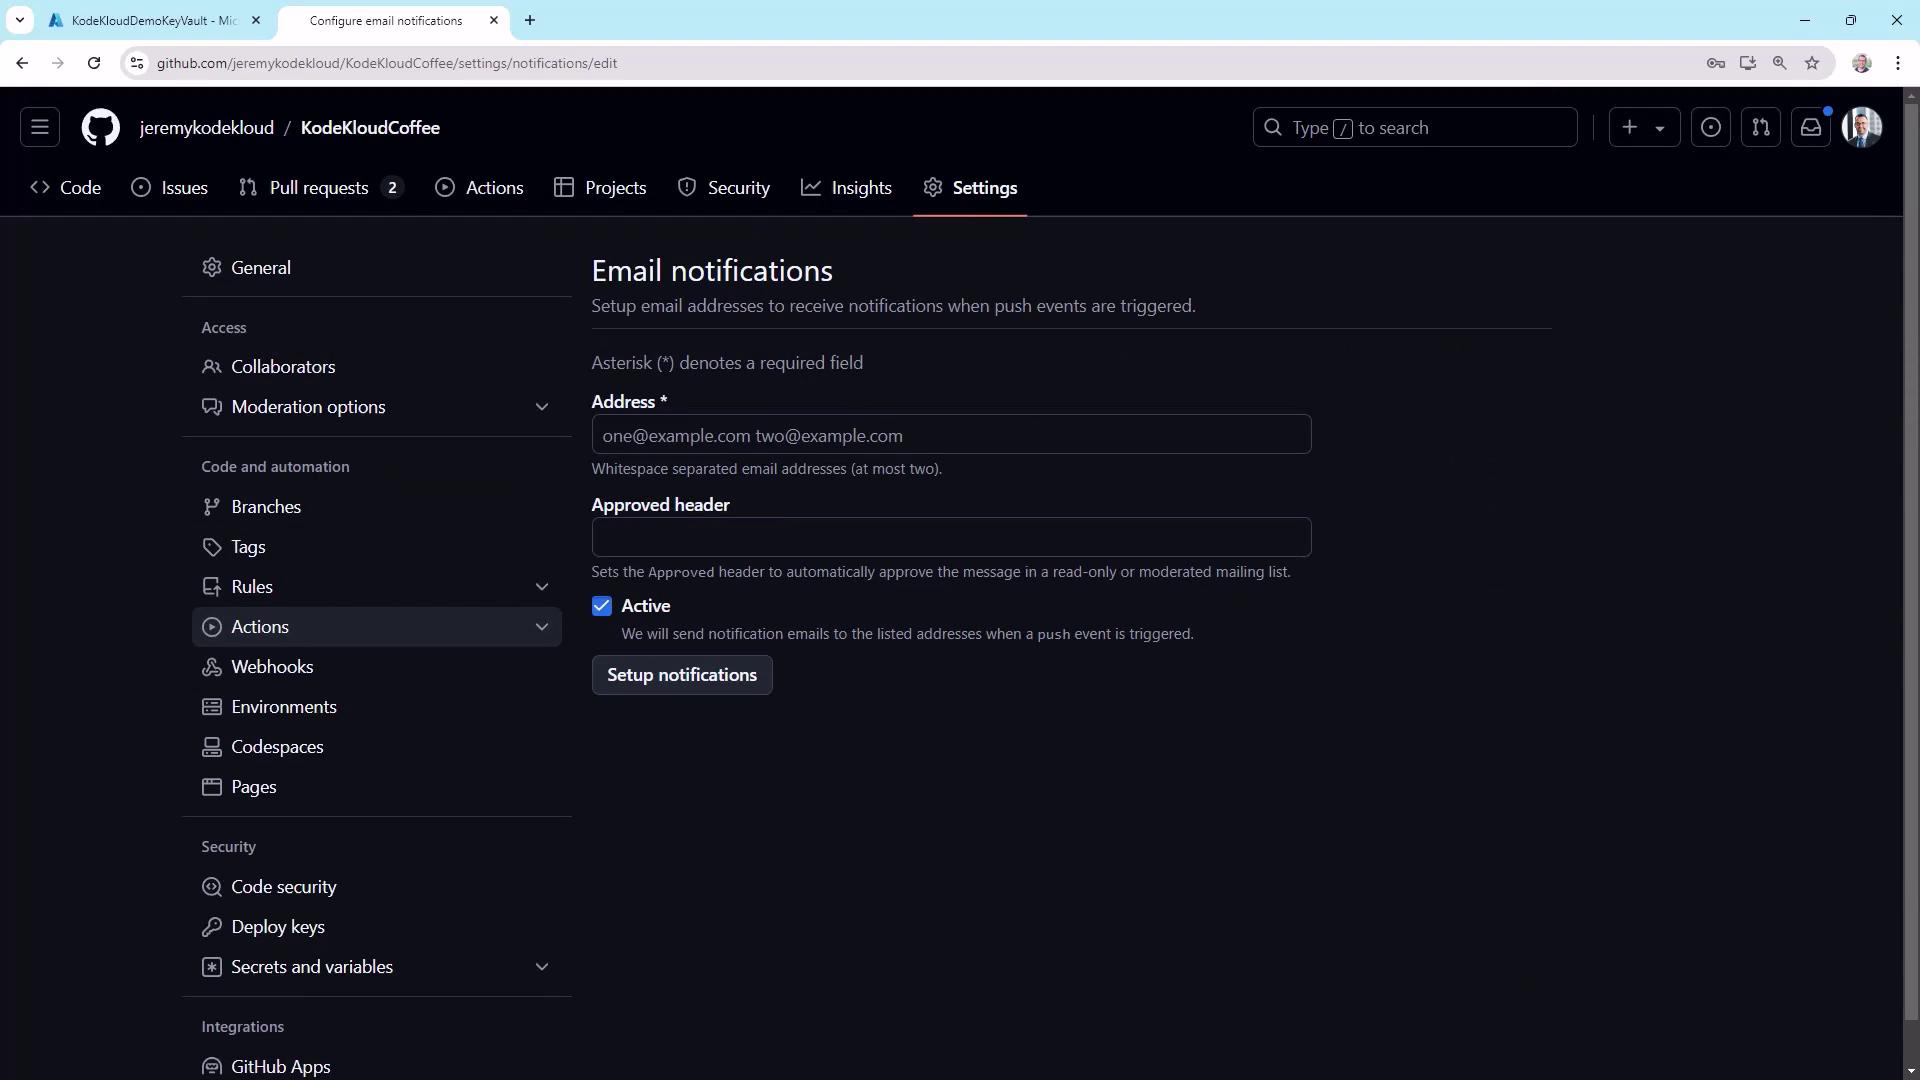
Webhooks
Use Settings ▶ Webhooks to push real-time event data to external systems: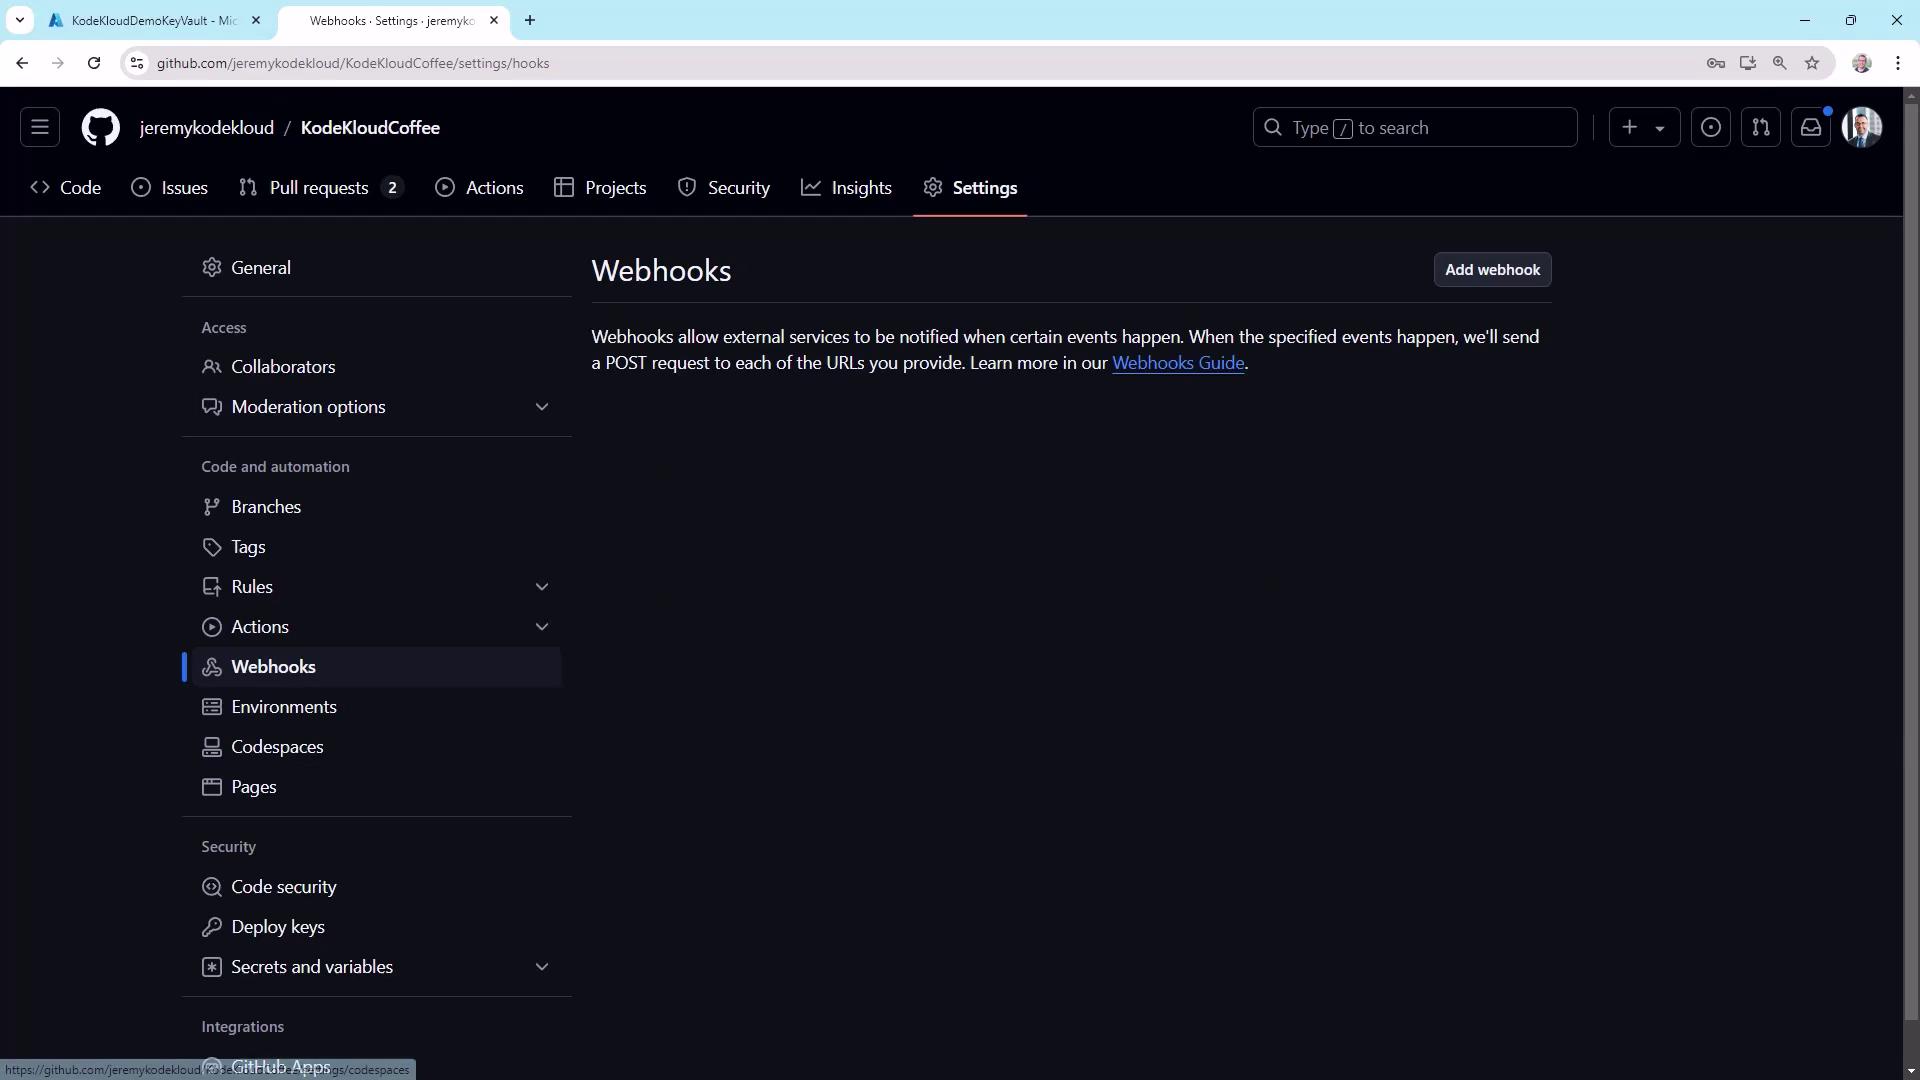
By leveraging GitHub’s built-in monitoring tools, you’ll gain actionable insights into team productivity, code health, and pipeline performance. Happy monitoring!