- Application Insights
- VM Insights
- Container Insights
- Storage Insights
- Network Insights
Overview of Azure Insights Services
| Service | Monitored Resource | Key Outcome |
|---|---|---|
| Application Insights | Live applications | App performance, user analytics, alerts |
| VM Insights | Virtual Machines | OS metrics, dependency maps |
| Container Insights | Kubernetes clusters | Pod/node health, resource usage |
| Storage Insights | Storage accounts | Throughput, capacity planning |
| Network Insights | Networking components | Topology, traffic analysis, alerts |
Enabling advanced telemetry features may increase data ingestion costs. Review Azure Monitor pricing and set up budget alerts to control expenses.
Application Insights
Monitor application performance, detect anomalies, and analyze user behavior with Application Insights.
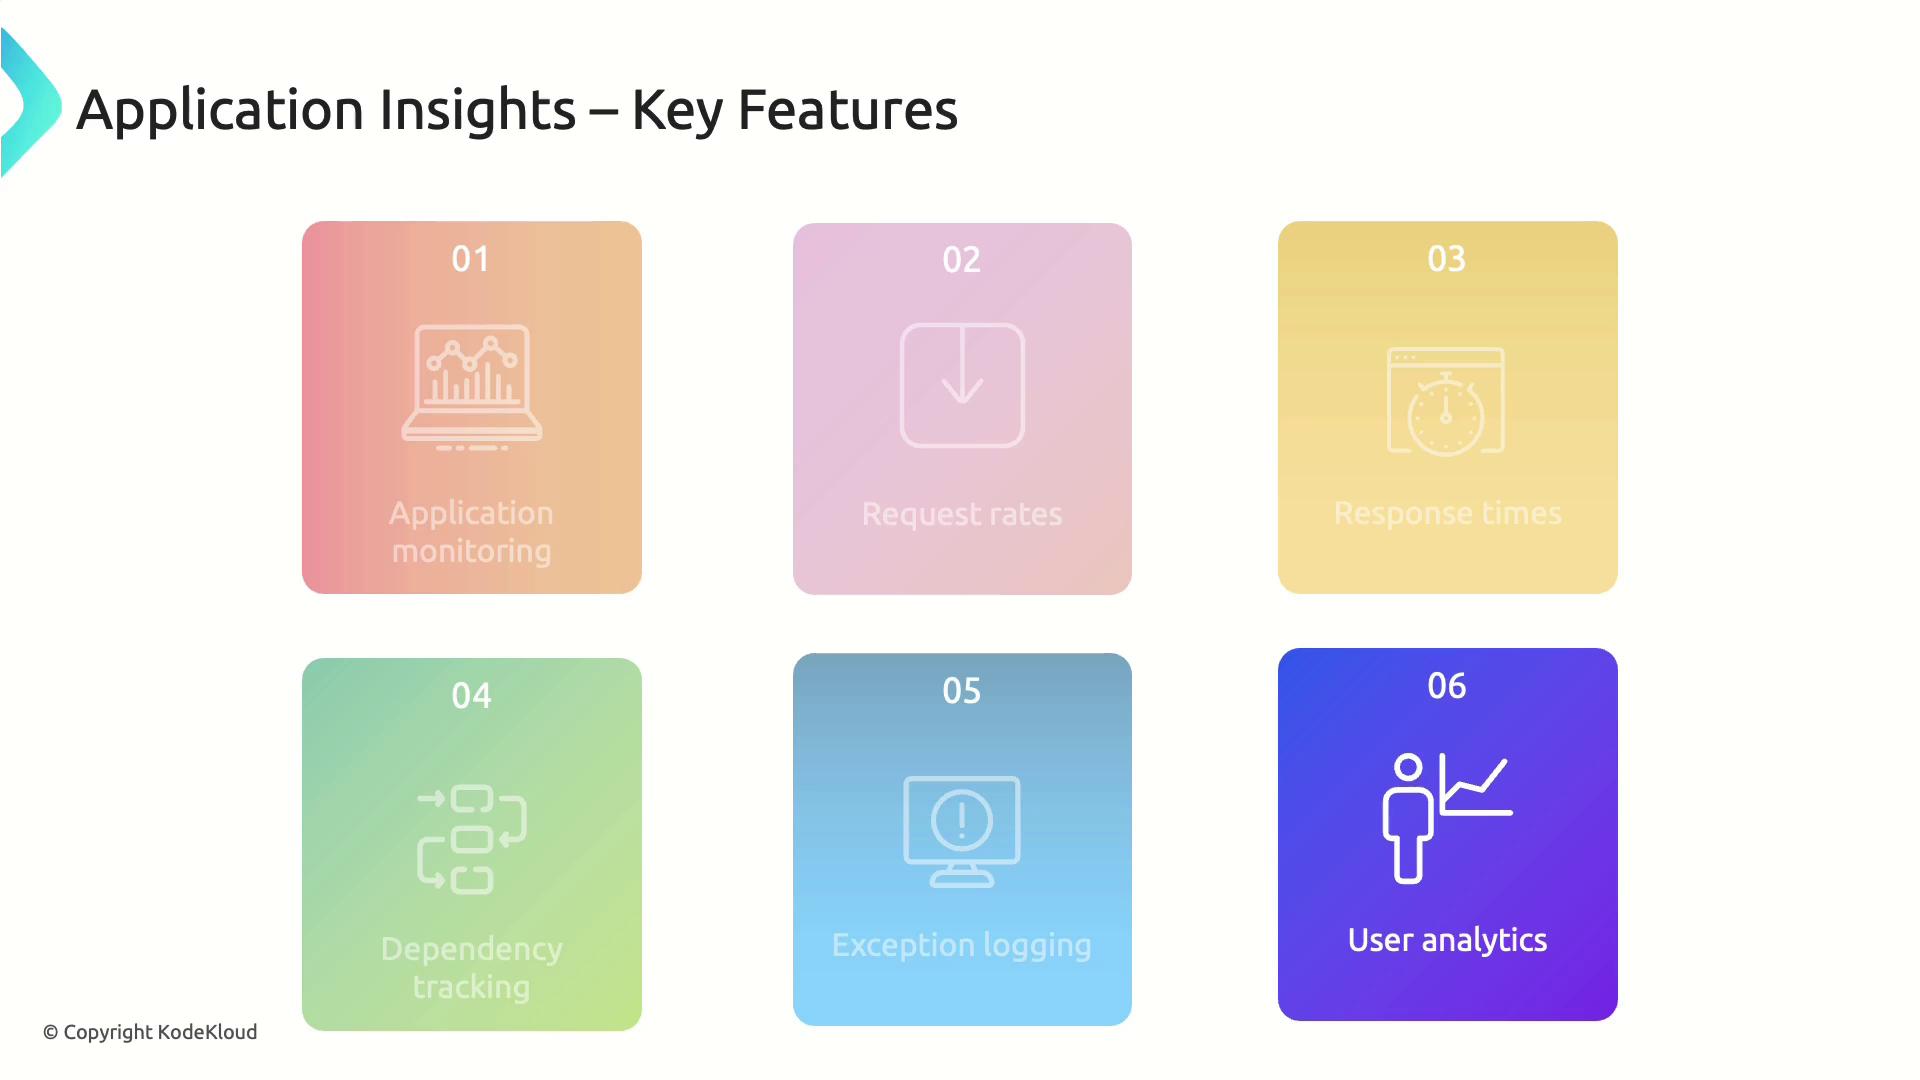
Key Features
- Request rates & response time monitoring
- Dependency tracking for service maps
- Exception logging & crash analysis
- User behavior analytics
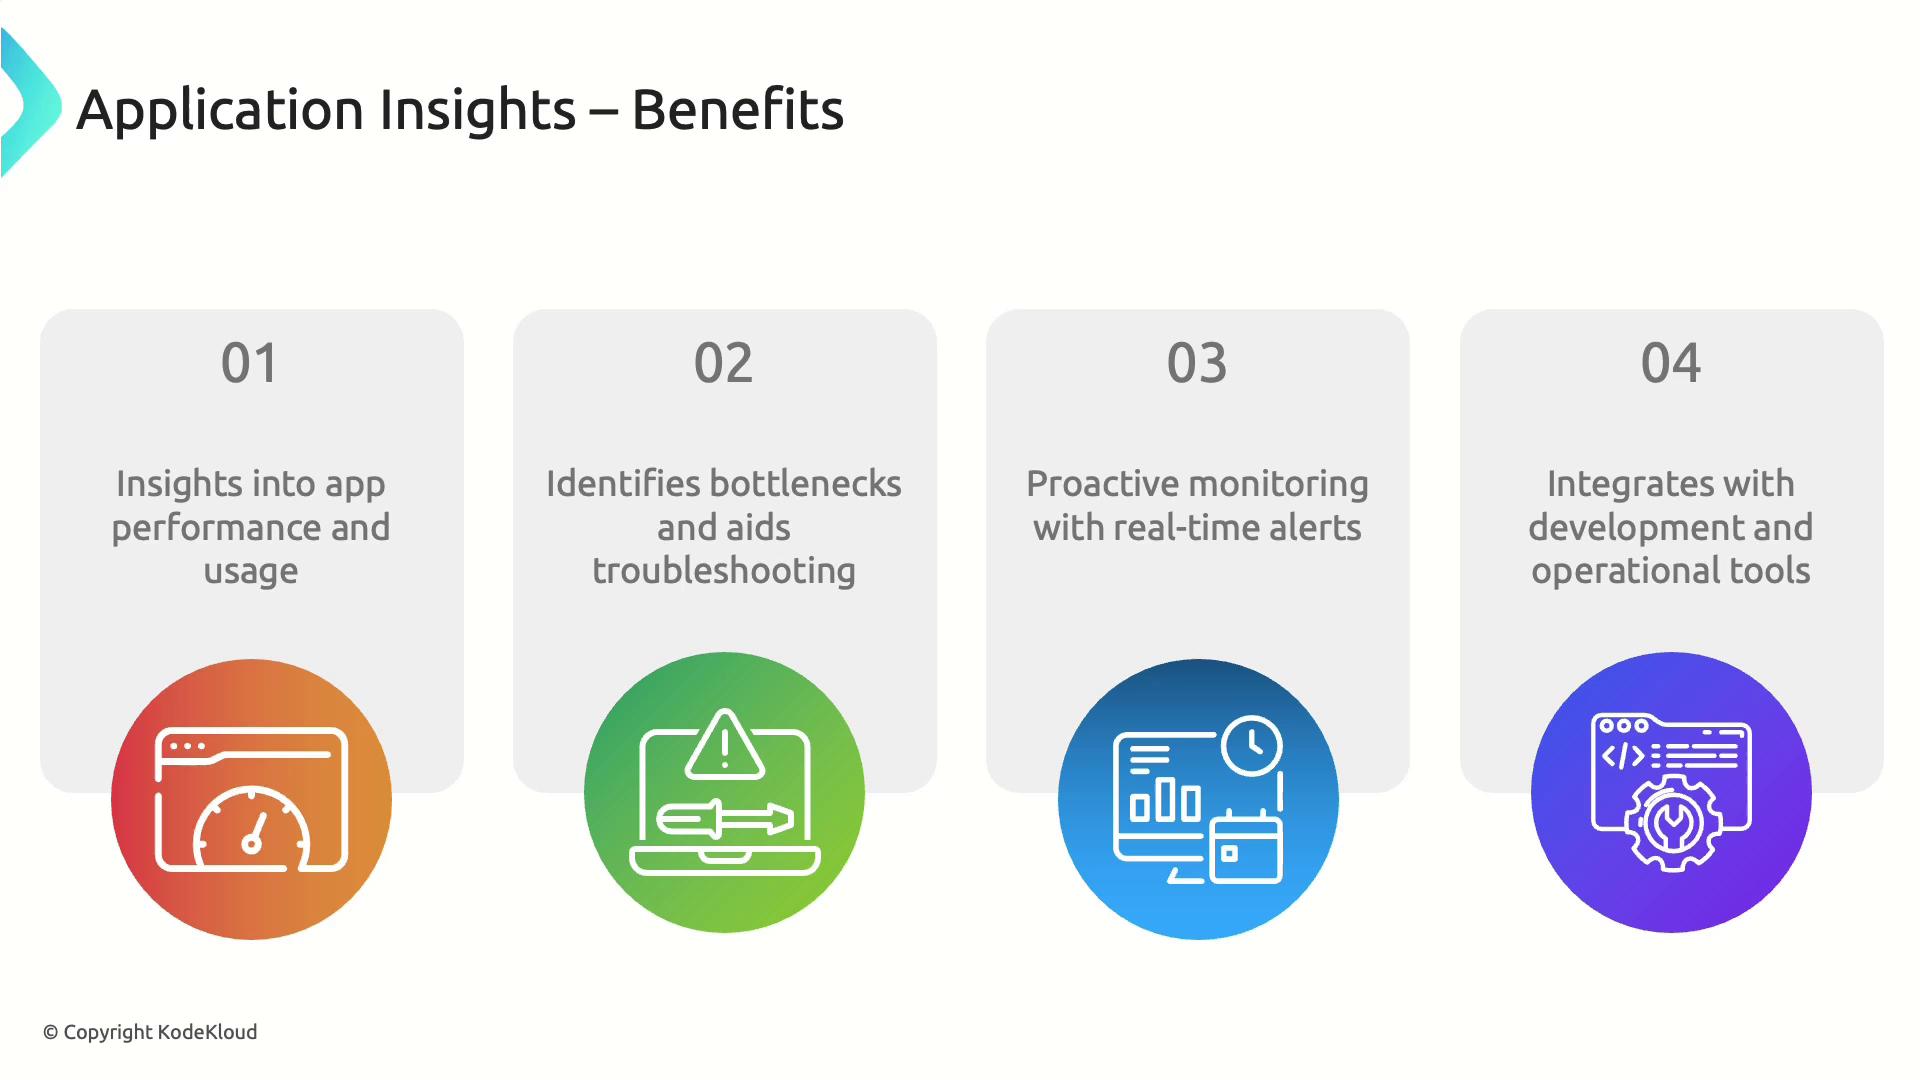
Benefits
- In-depth visibility into performance bottlenecks
- Proactive alerts to minimize downtime
- Direct integration with CI/CD pipelines
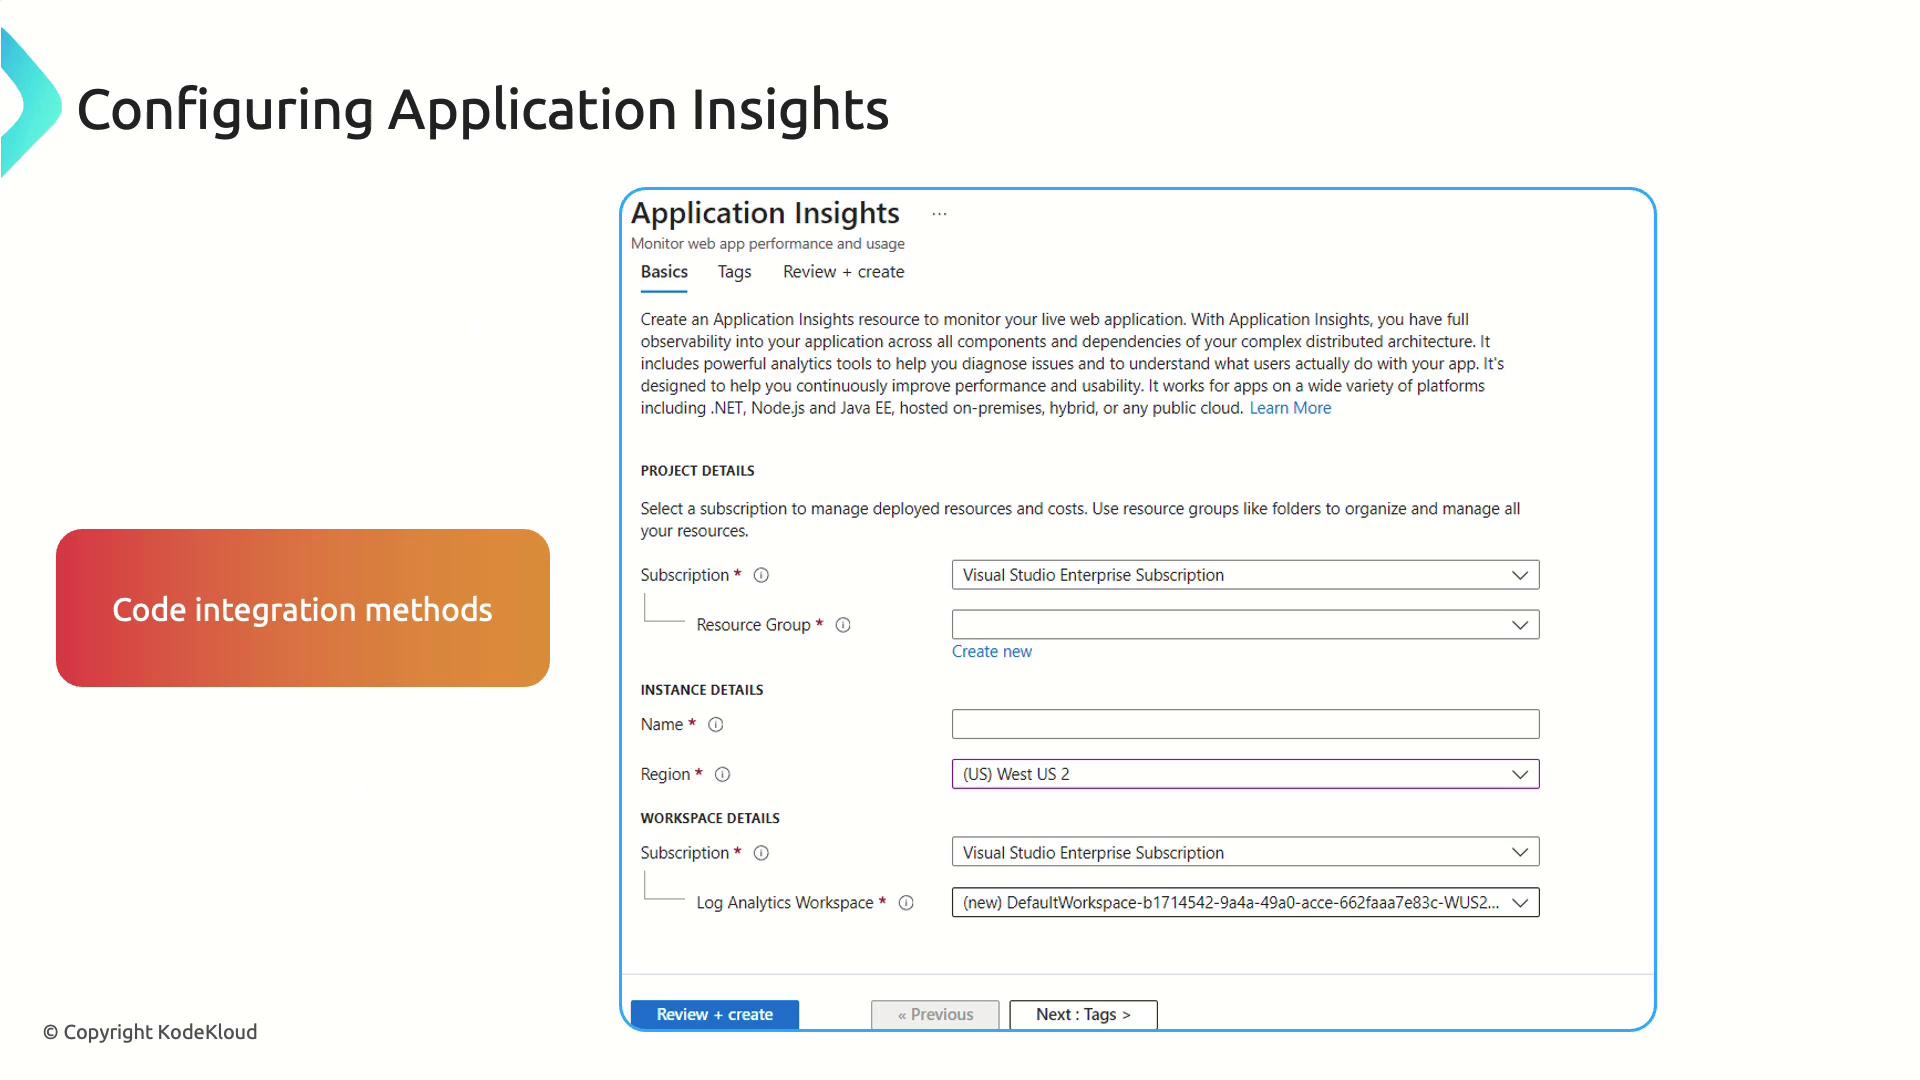
Setup Steps
- In the Azure portal, create a new Application Insights resource.
- Choose your application stack (ASP.NET, Java, Node.js, etc.).
- Install the SDK (NuGet, Maven, npm) and initialize in code.
- (Optional) Enable agent-based data collection for VMs or App Services.
- View telemetry on charts, maps, and logs in the portal.
VM Insights
Gain deep operational insights into your Azure Virtual Machines by tracking performance and dependencies.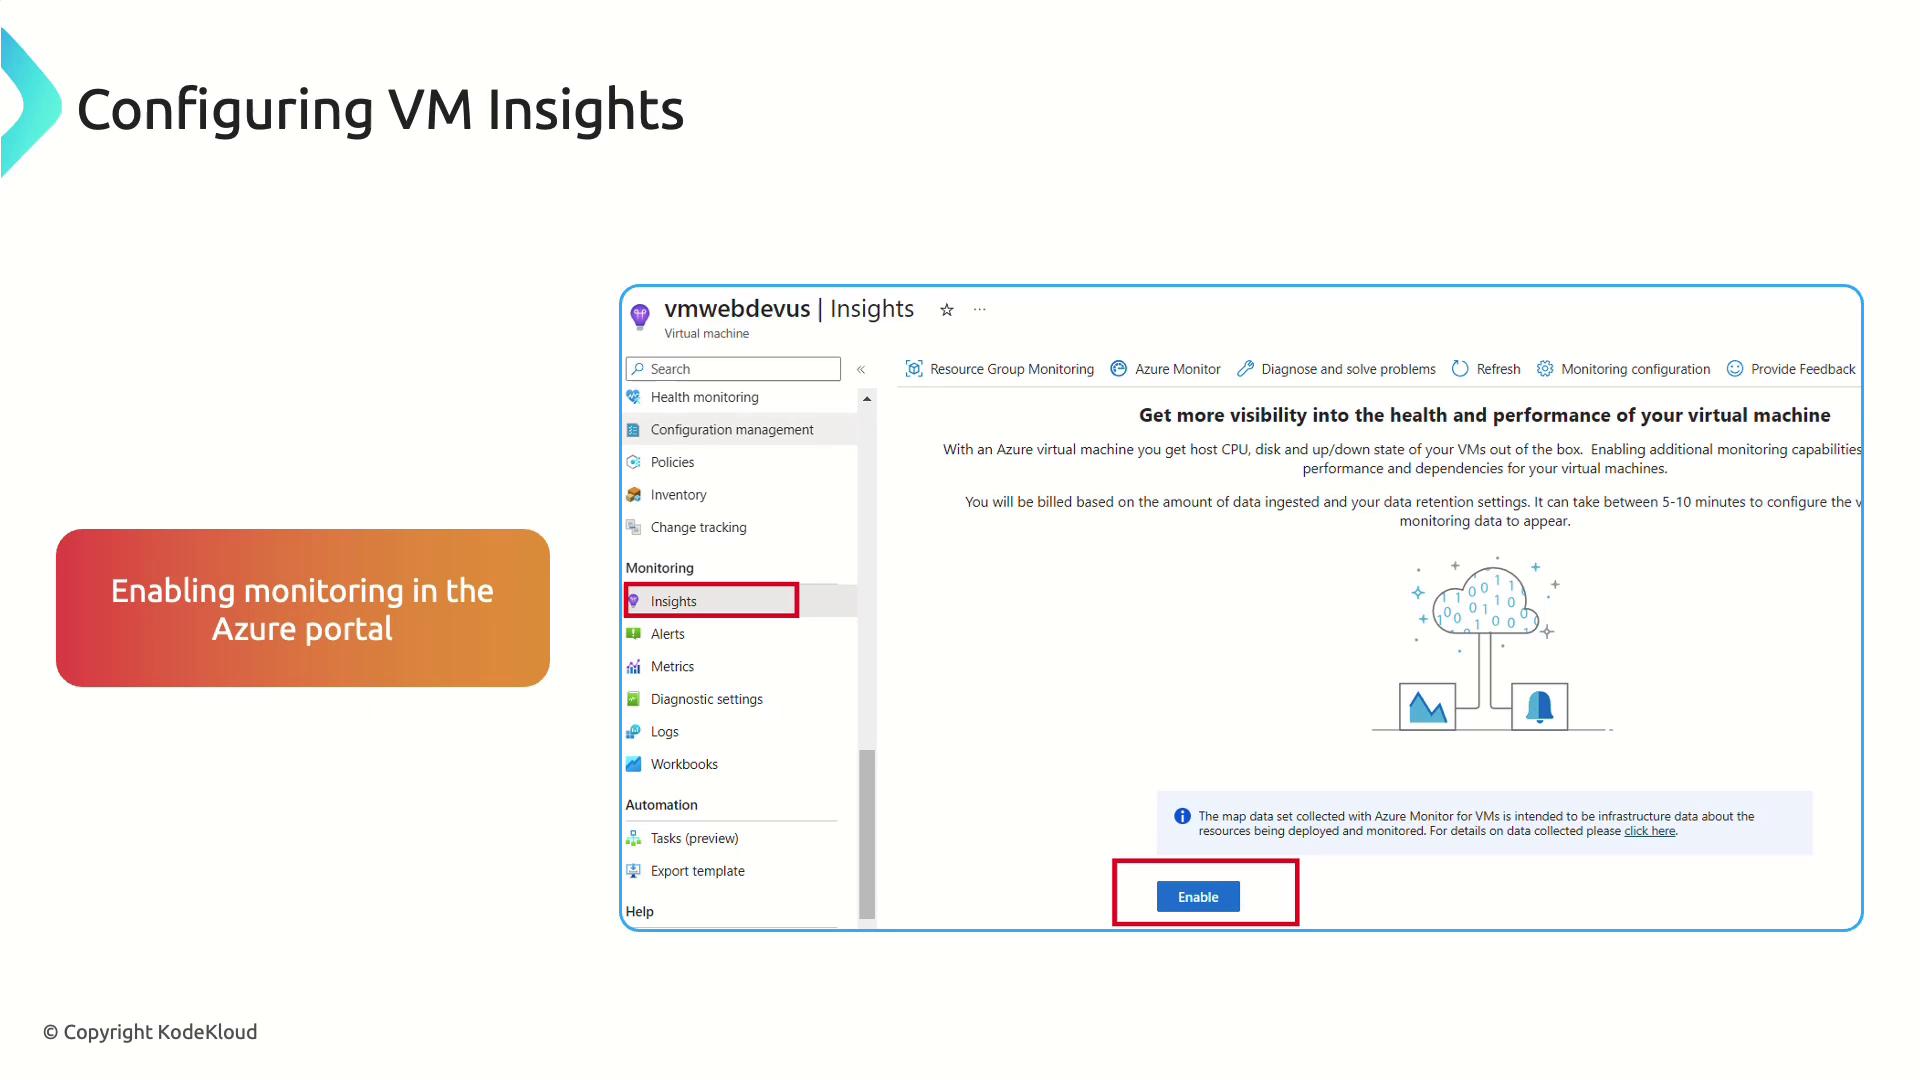
Key Features
- CPU, memory, disk, and network metrics
- Dependency mapping between VMs and services
- Guest OS-level monitoring
- Full integration with Log Analytics
Benefits
- Early detection of resource bottlenecks
- Correlate VM metrics with application events
- Centralized log and metric storage
Setup Steps
- Open your VM in the Azure portal.
- Select Insights > Enable.
- Install required monitoring extensions.
- Link to a Log Analytics workspace.
- Analyze metrics and dependency maps in the portal.
Container Insights
Monitor container workloads on AKS or other Kubernetes clusters, from pods to nodes.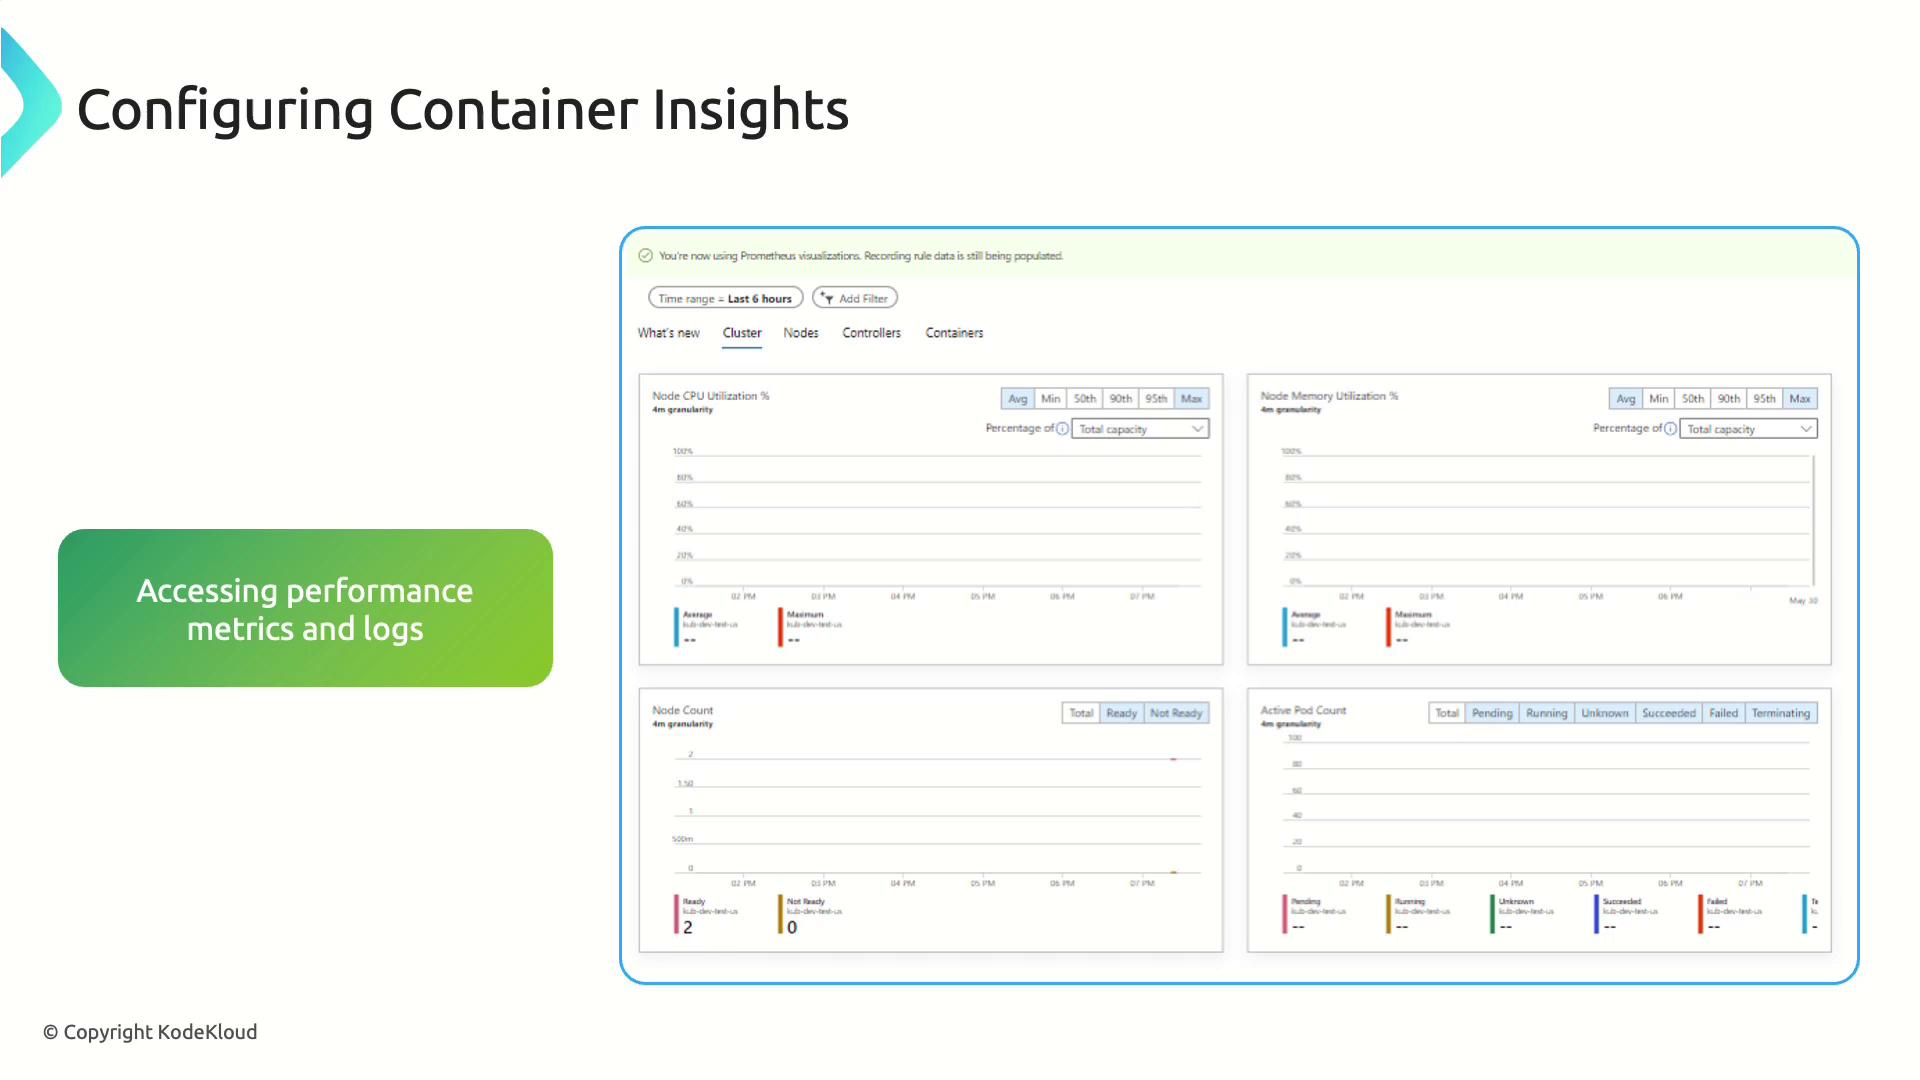
Key Features
- Container & cluster resource metrics
- Log collection & container event analysis
- Pod and node health monitoring
- Integration with Azure Monitor
Benefits
- Real-time visibility into container performance
- Identify failing pods and resource constraints
- Unified monitoring across VMs, containers, and applications
Setup Steps
- In the Azure portal, go to your Kubernetes cluster.
- Click Insights > Enable.
- Install the Log Analytics agent as prompted.
- Explore CPU, memory, node health, and logs in the portal.
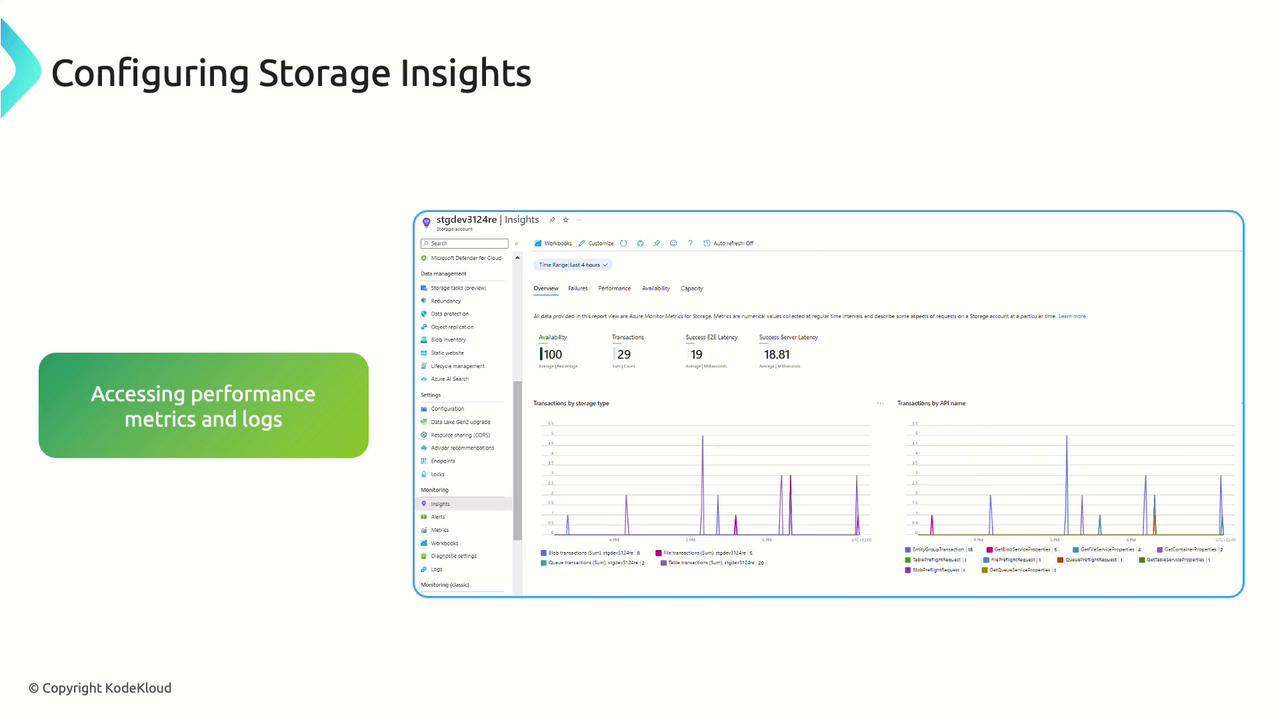
Storage Insights
Diagnose and optimize Azure Storage account performance with detailed metrics and logs.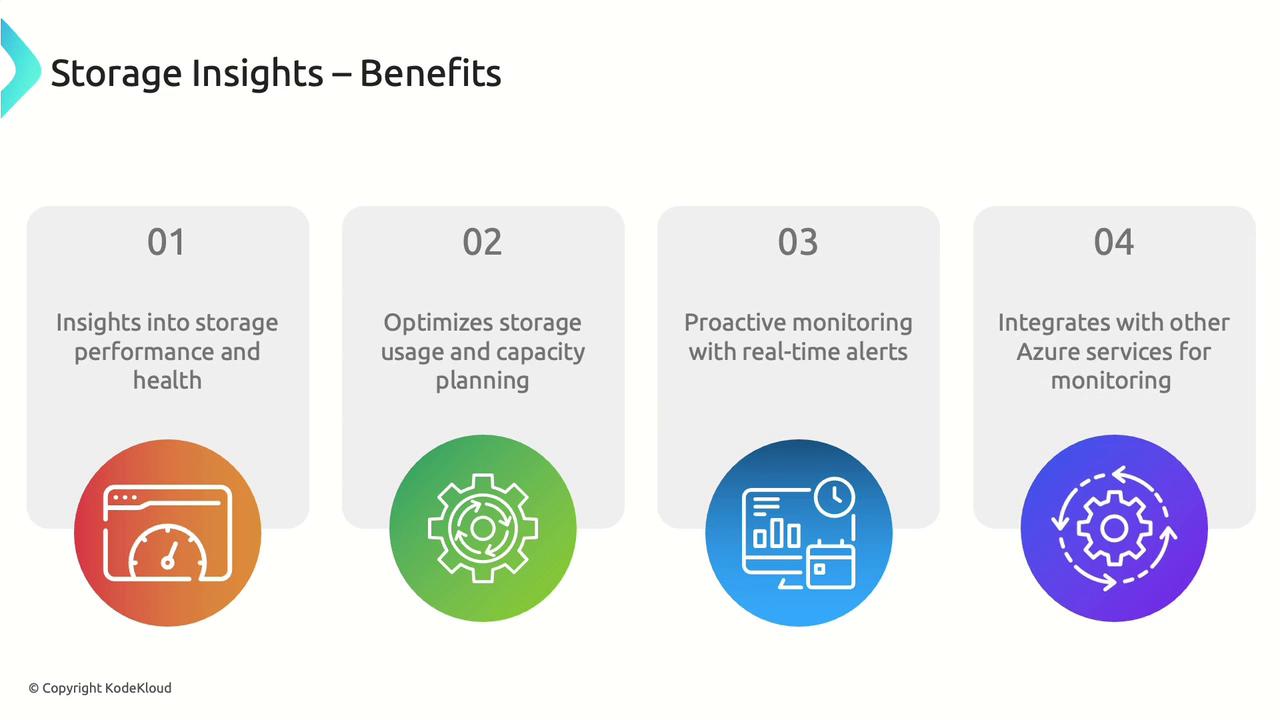
Key Features
- Throughput, latency, and capacity metrics
- Access pattern and trend analysis
- Capacity planning recommendations
- Diagnostic logging (read/write/error logs)
Benefits
- Optimize storage performance and costs
- Predict growth and scale proactively
- Integrate with alerts and dashboards
Setup Steps
- Select your Storage Account in the Azure portal.
- Navigate to Insights > Enable.
- Configure diagnostic settings to a Log Analytics workspace.
- View throughput, latency, capacity, and transaction logs.
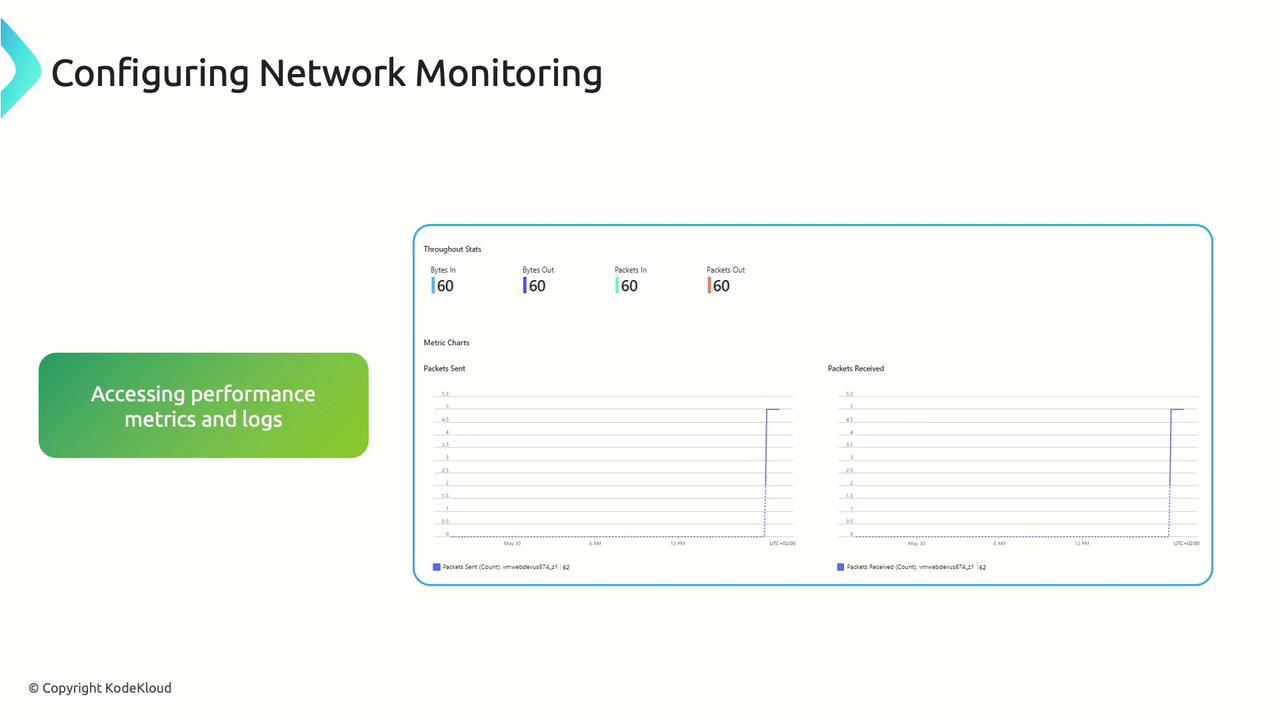
Network Insights
Visualize and troubleshoot your network topology, traffic patterns, and health in real time.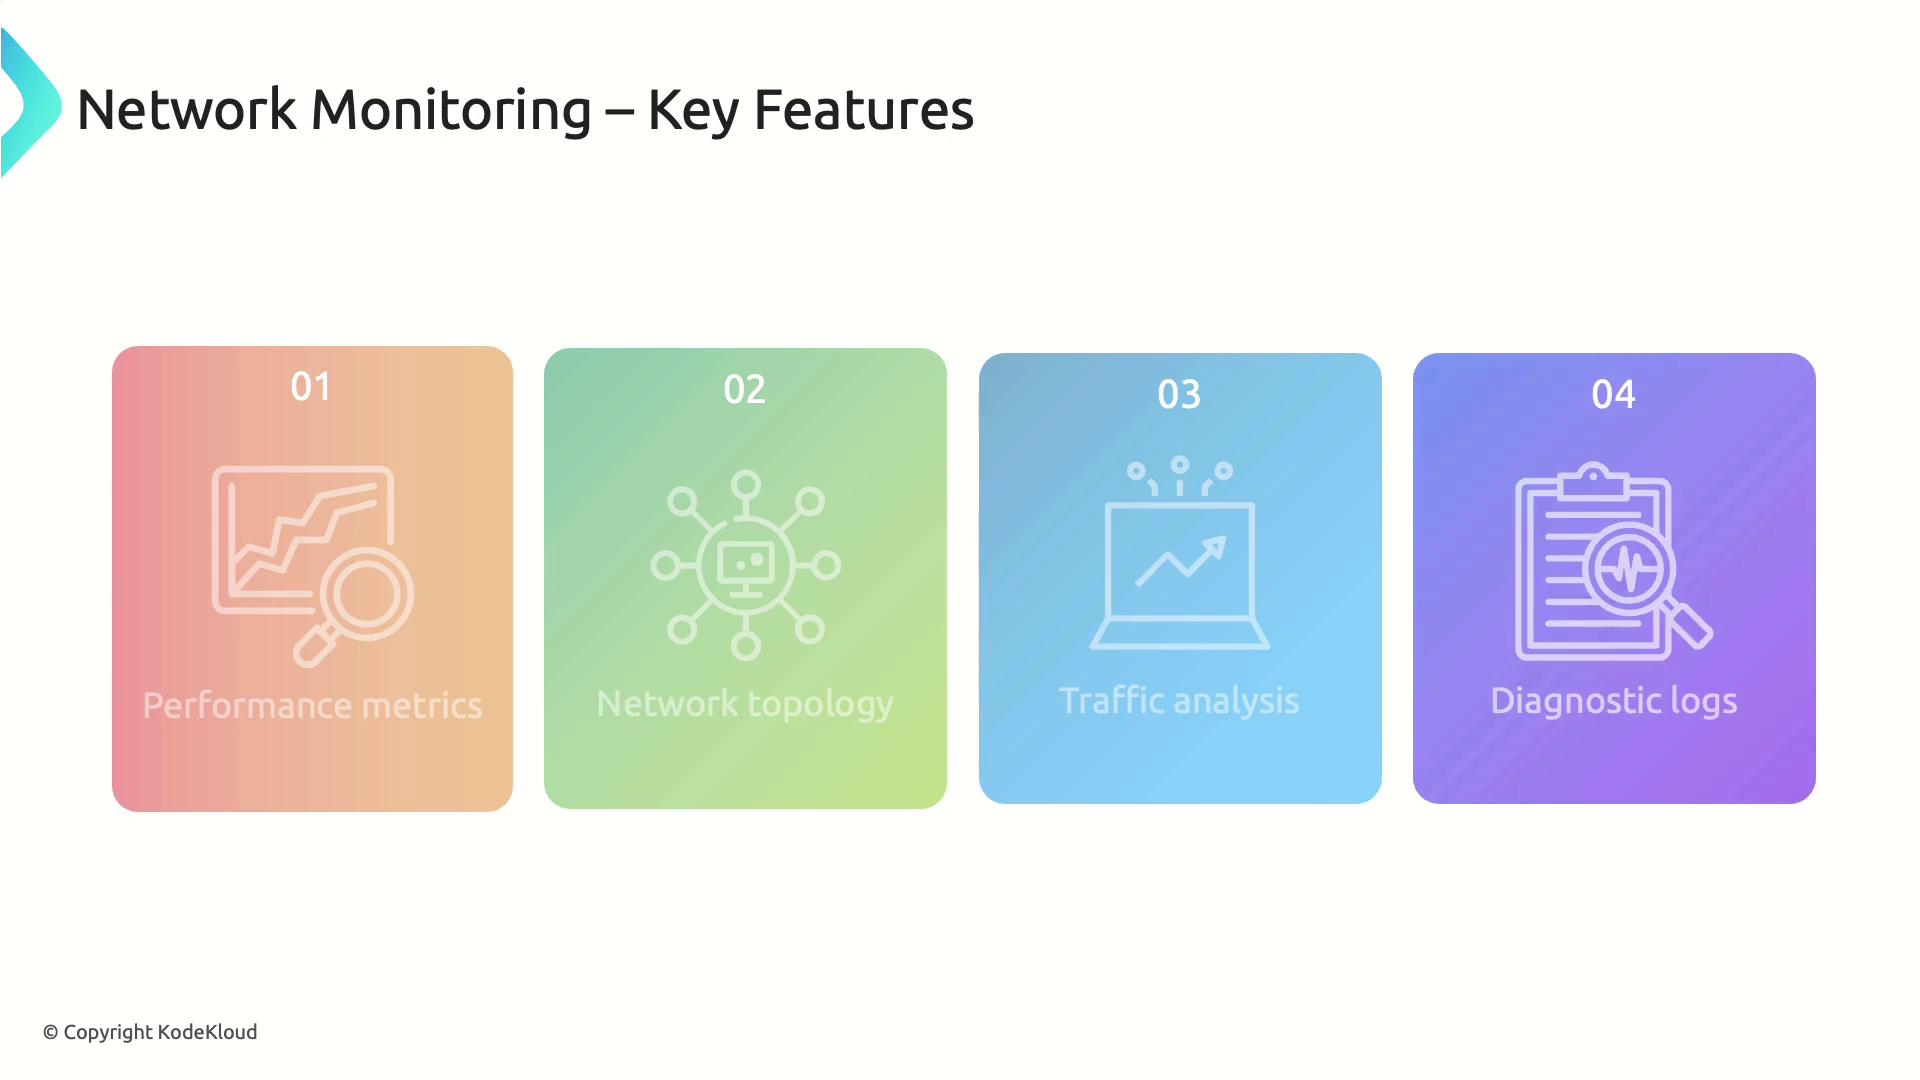
Key Features
- Throughput, latency & packet loss metrics
- Dynamic network topology maps
- Traffic flow and security analysis
- Diagnostic logs for troubleshooting
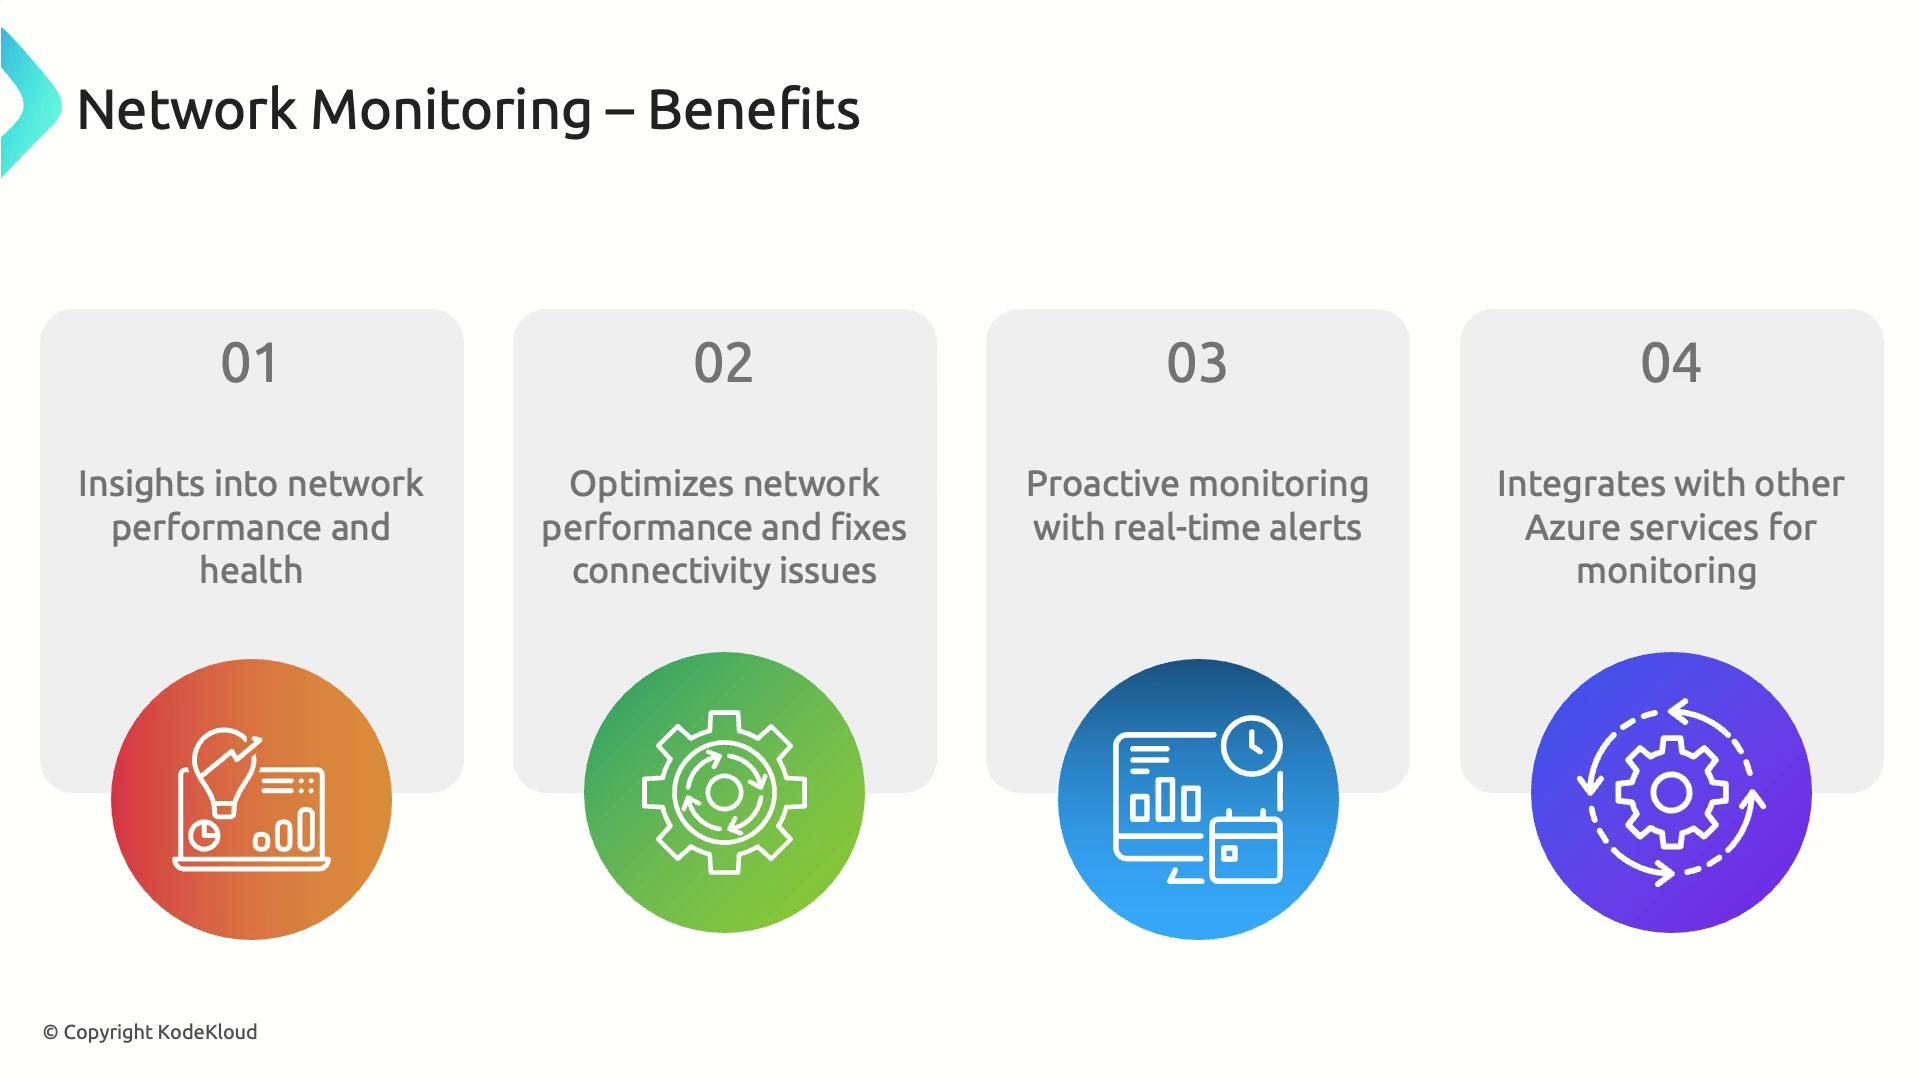
Benefits
- End-to-end visibility into network health
- Rapid isolation of connectivity issues
- Real-time alerts and proactive monitoring
- Seamless integration with Azure Monitor
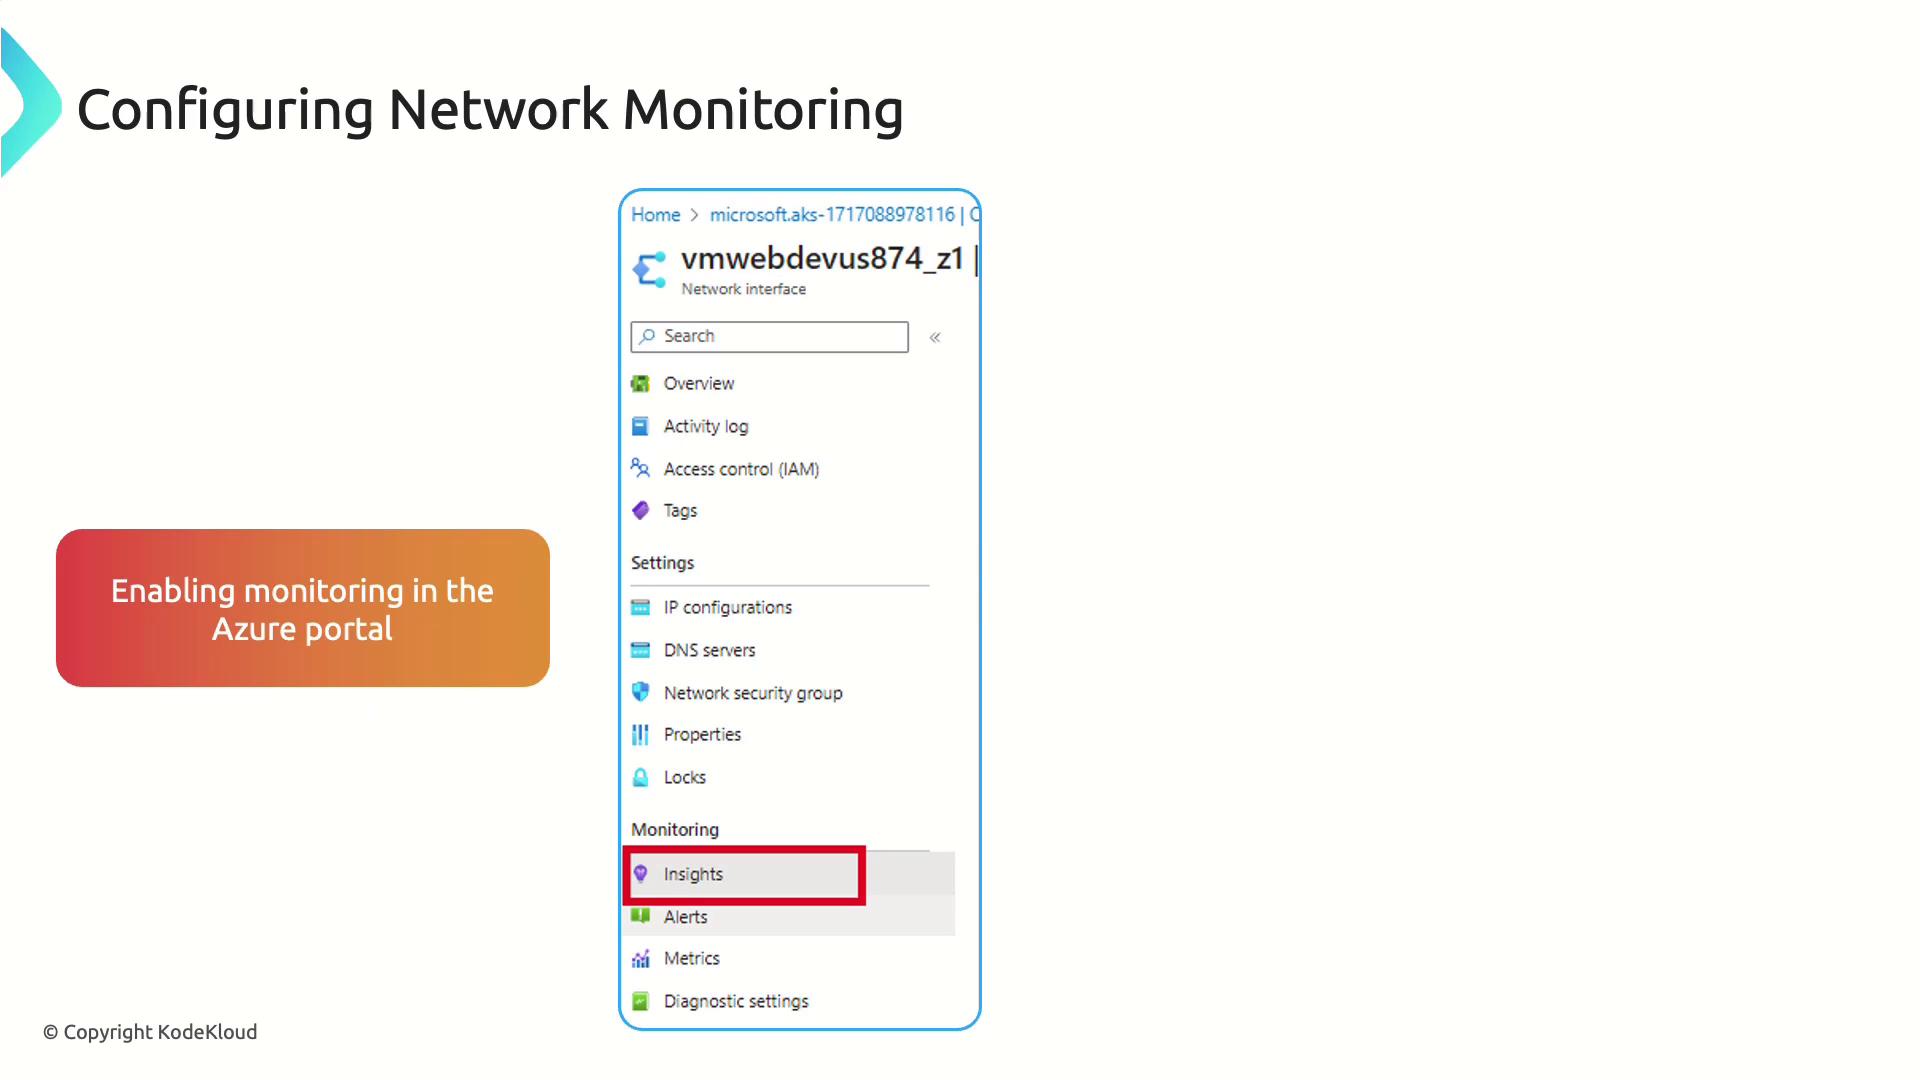
Setup Steps
- In the Azure portal, select a network resource (e.g., NIC, NSG).
- Click Insights > Enable under Monitoring.
- Configure diagnostic settings to forward logs and metrics.
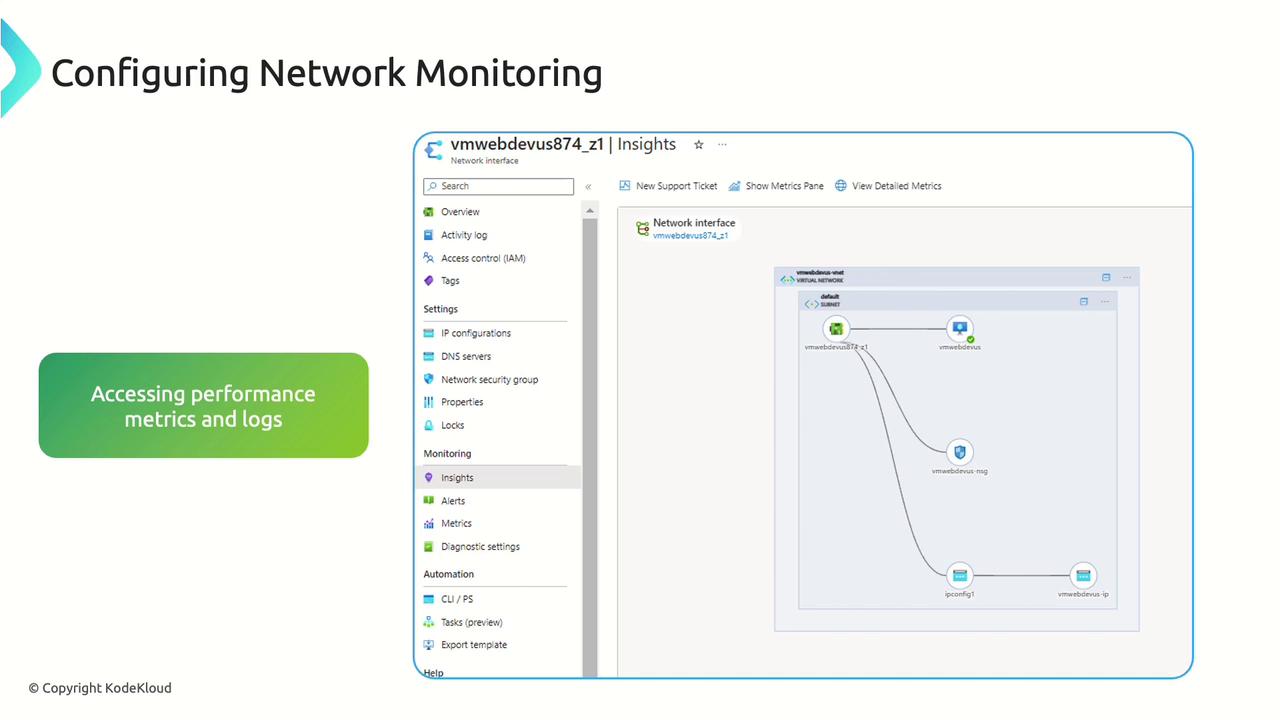
- Link to a Log Analytics workspace.
- Analyze throughput, latency, and packet-loss charts.
By leveraging Application, VM, Container, Storage, and Network Insights, you’ll gain unified visibility across your Azure estate—detect issues faster, optimize performance, and manage costs effectively.