What Is Continuous Monitoring?
Continuous monitoring collects, analyzes, and acts on telemetry data—metrics, logs, and traces—in real time. It helps DevOps teams detect anomalies, prevent outages, and maintain optimal user experience.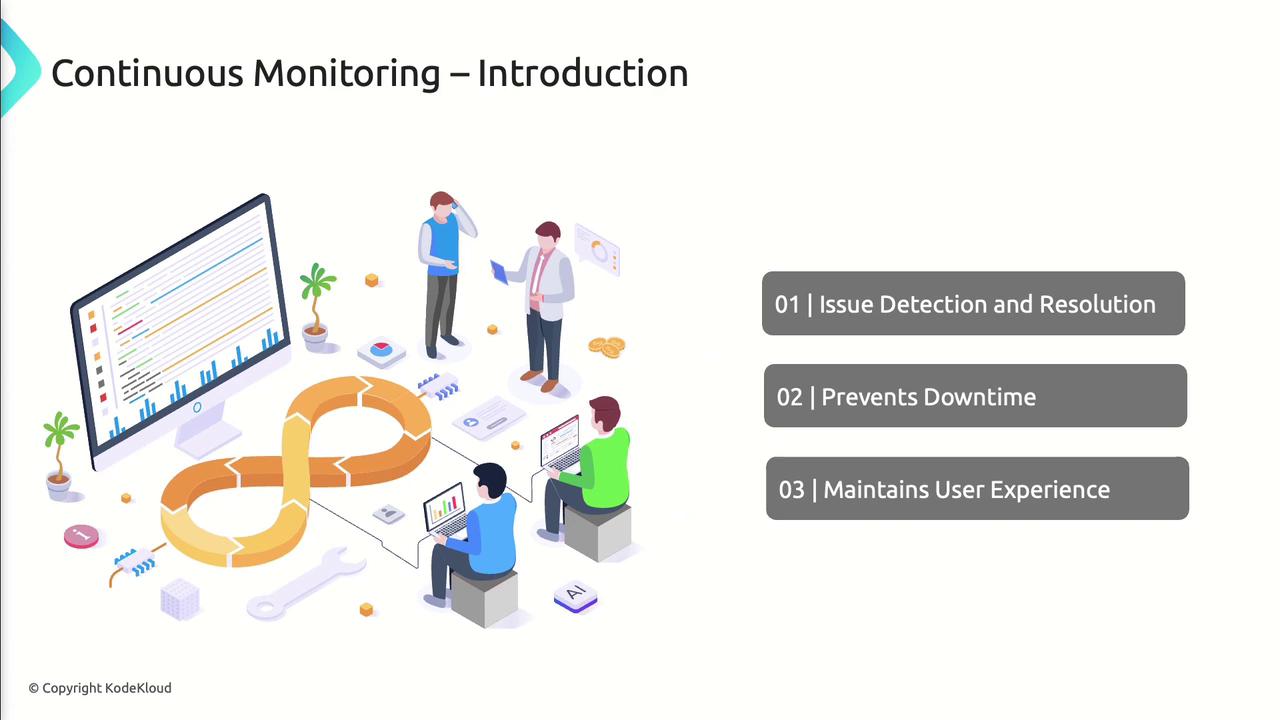
- Early detection of issues before they impact users
- Prevention of downtime through proactive alerts
- Consistent performance for a high-quality user experience
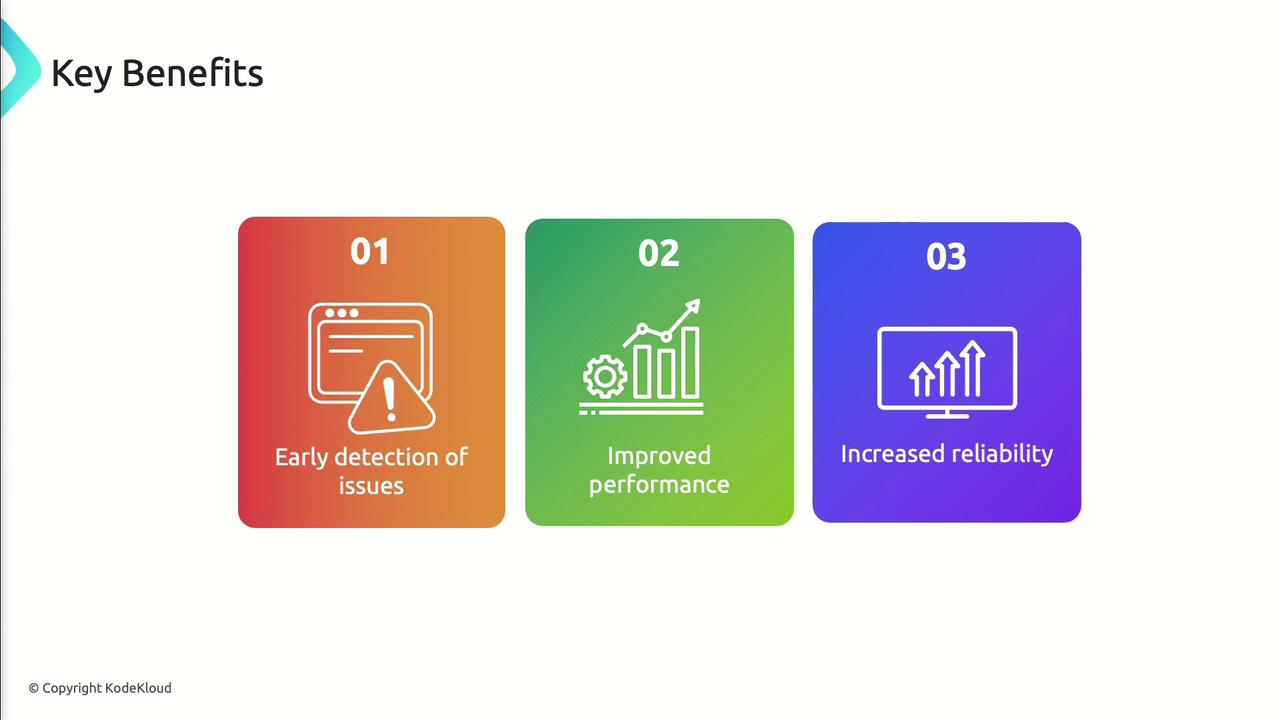
Benefits of Continuous Monitoring
| Benefit | Description |
|---|---|
| Early Issue Detection | Identify failures or performance degradation immediately |
| Performance Optimization | Use telemetry to fine-tune resources and code paths |
| Reliability & Availability Enhancement | Maintain SLAs and reduce unplanned downtime |
Overview of Azure Monitor
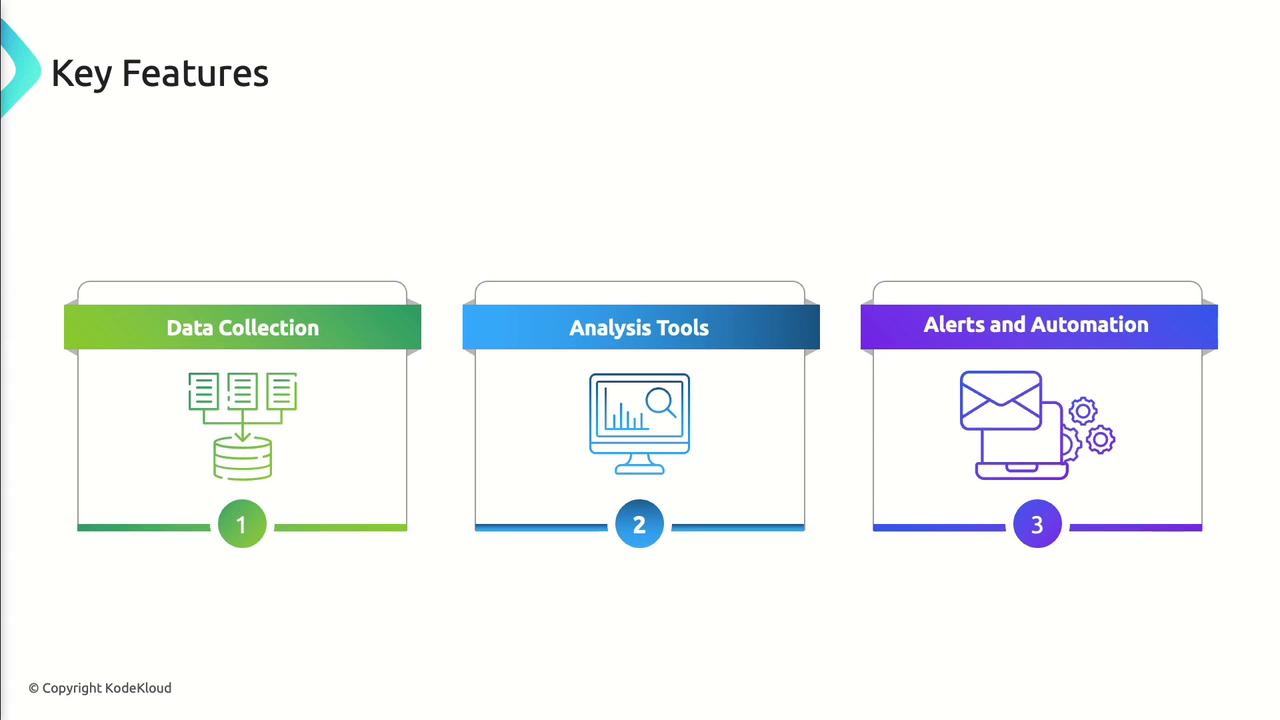
Azure Monitor is the centralized service for collecting, analyzing, and acting on telemetry across cloud and on-premises environments. It ensures your applications and services operate at peak performance. Key features- Data collection: Metrics and logs from applications, OS, Azure resources.
- Analysis tools: Metrics Explorer, Log Analytics workspace, workbooks.
- Alerts & automation: Configurable rules, action groups, and automated runbooks.
Integrations with Other Azure Services
Azure Monitor can route telemetry into services for processing, retention, or automation:| Service | Integration Scenario | Benefits |
|---|---|---|
| Azure Event Hubs | Stream telemetry to analytics platforms | Decouple ingestion and processing pipelines |
| Azure Storage | Archive logs for compliance | Long-term retention and audit readiness |
| Azure Logic Apps | Automate workflows on alerts | Trigger notifications, ticketing, and more |
| Azure Functions | Execute custom preprocessing or actions | Extend telemetry handling using code |
| Azure DevOps & GitHub | Annotate pipelines and create work items | Embed monitoring into your CI/CD workflows |
Introduction to Azure Log Analytics
Azure Log Analytics is the centralized log-management component of Azure Monitor. It uses Kusto Query Language (KQL) to analyze massive volumes of data and generate dashboards or alerts.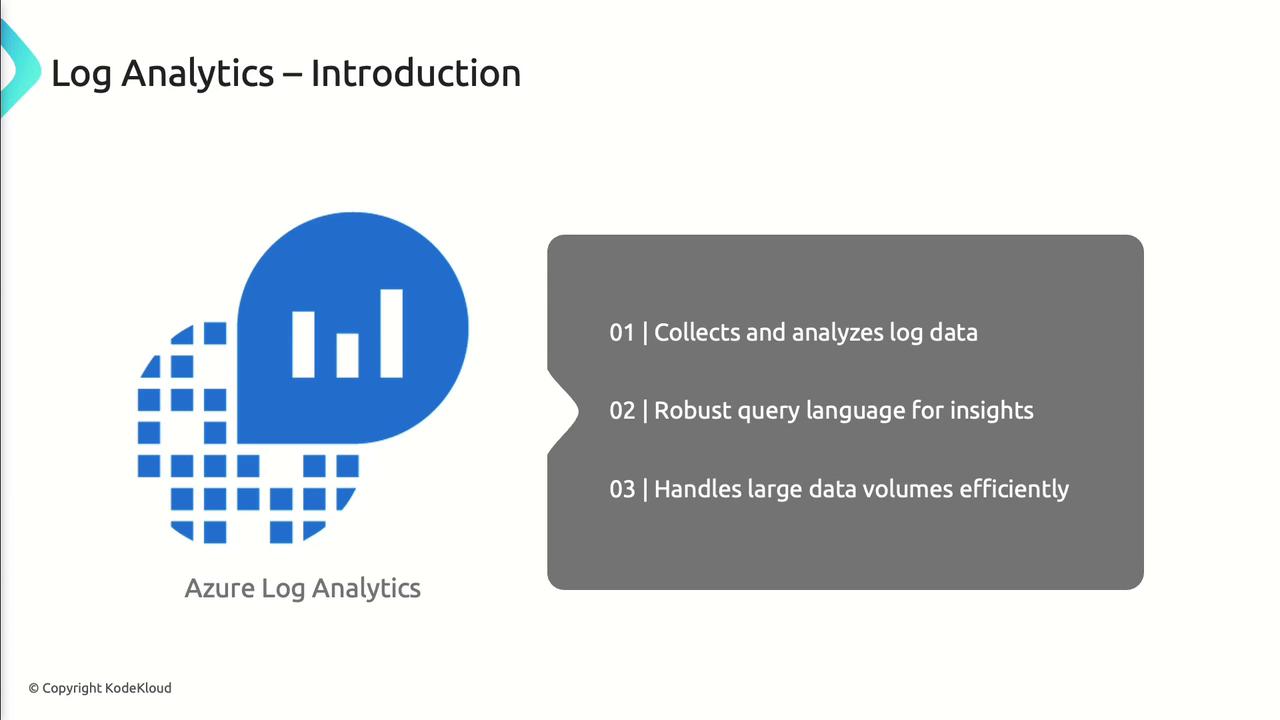
- Data ingestion: Logs from Azure, on-prem servers, and multi-cloud.
- Query & analysis: KQL for real-time filtering, summarization, and charting.
- Visualization: Interactive dashboards, workbooks, and charts for insights.
Integrating Azure Monitor with DevOps Tools
Embed monitoring data directly into your CI/CD pipelines:- Azure DevOps:
- Auto-create work items on alert
- Annotate releases with performance metrics
- GitHub:
- Link alerts to pull requests or issues
- Fail or mark checks based on telemetry thresholds
Configuring Alerts in Azure Monitor
Azure Monitor supports three alert types to keep you informed:
- Metric alerts: Trigger when numeric metrics cross thresholds (e.g., CPU > 80%).
- Log alerts: Fire based on KQL query results matching conditions.
- Activity log alerts: Detect Azure resource changes (creation, deletion, updates).
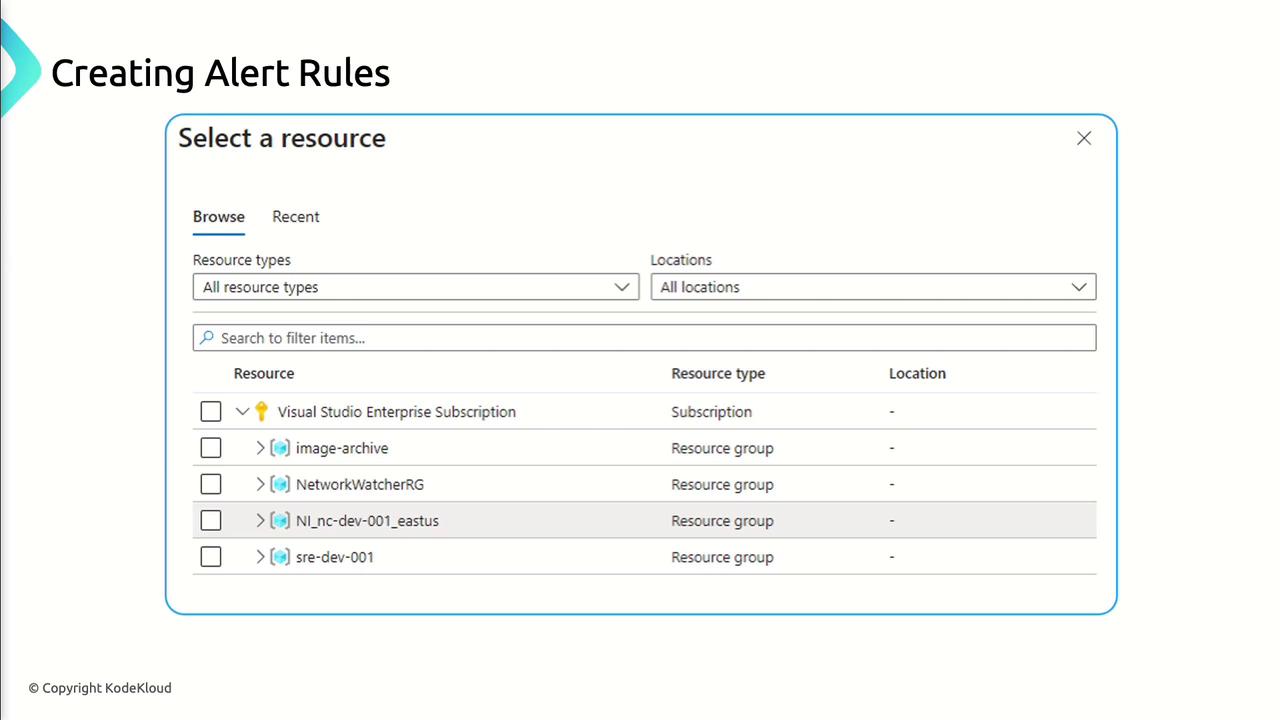
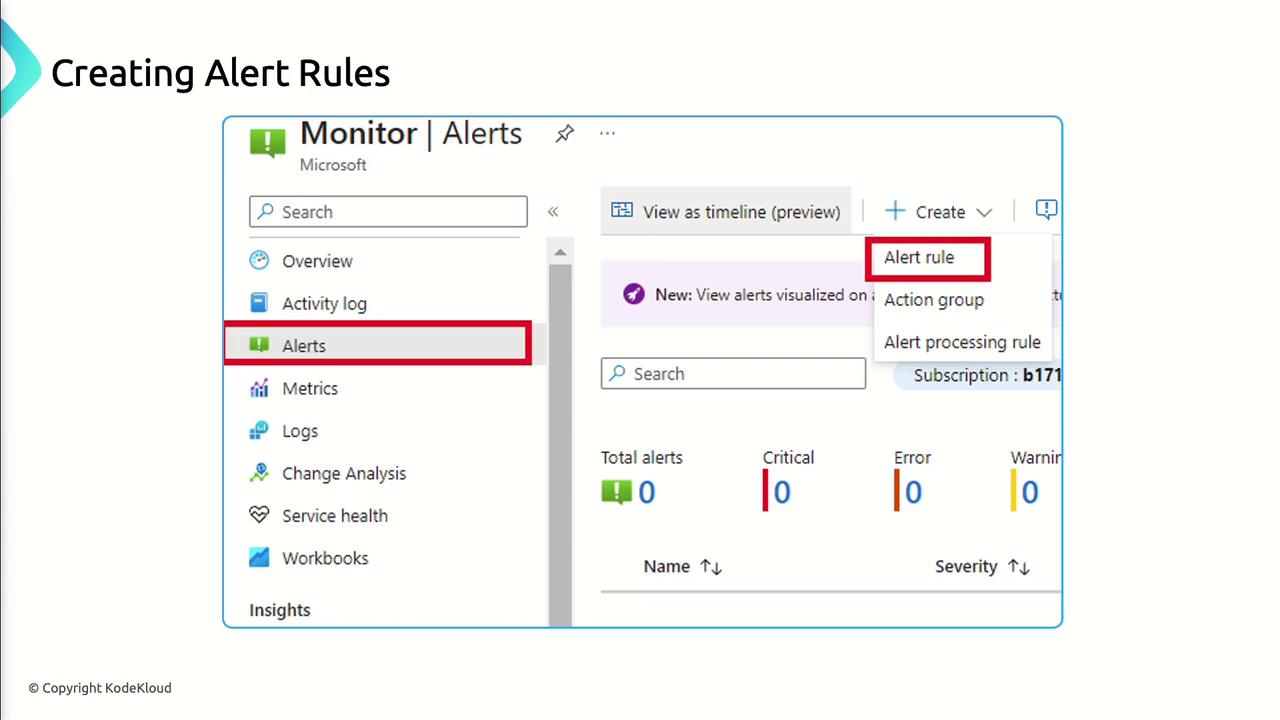
Creating an Alert Rule
- In the Azure portal, go to Azure Monitor > Alerts > New Alert Rule.
- Select the Target Resource (VM, database, etc.).
- Define the Condition (metric threshold or custom log query).
- Choose an Action Group (email, webhook, Logic App, Function).
- Set Severity and Alert Details, then Create.
Managing and Responding to Alerts
- Review Active Alerts in the Azure portal.
- Automate remediation via Logic Apps or Azure Automation.
- Analyze Alert History to identify recurring issues.
Leveraging automated runbooks or Logic Apps for common alerts can drastically reduce mean time to resolution (MTTR).
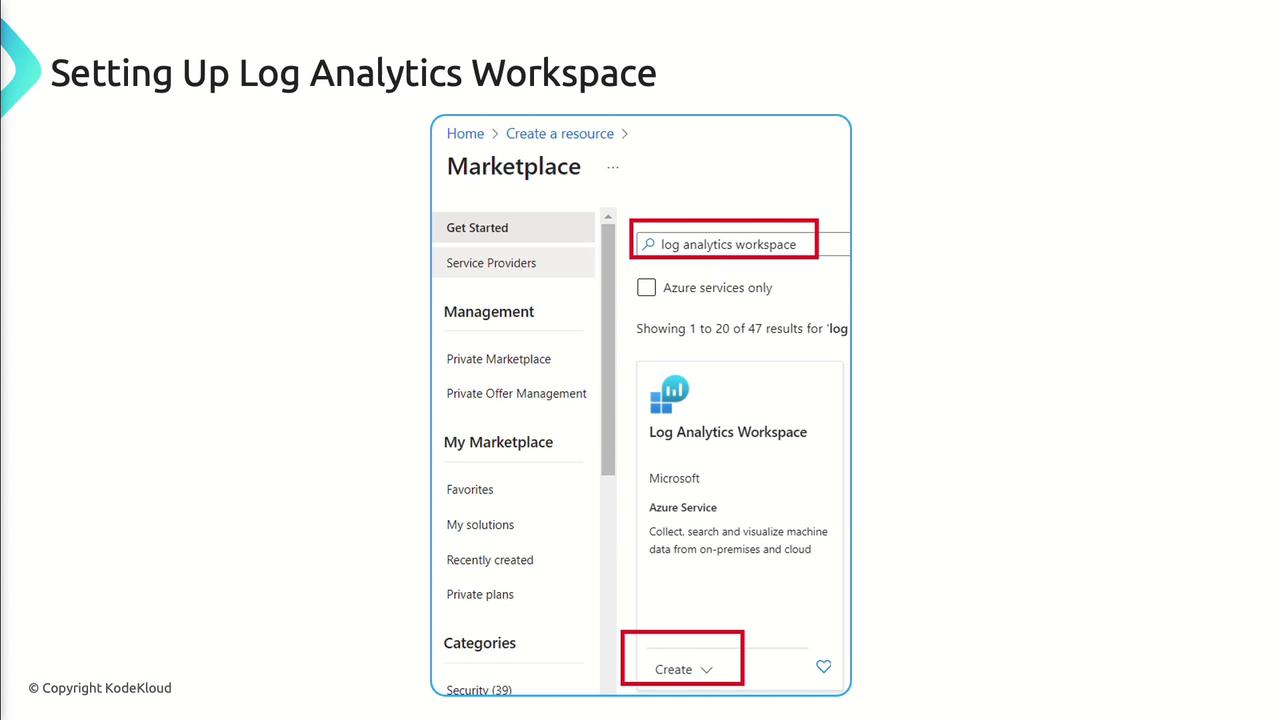
Setting Up a Log Analytics Workspace
- In the Azure portal, search for Log Analytics Workspaces and click Create.
- Enter workspace Name, Subscription, Resource Group, and Region.
- For data collection, opt for Agent-Based Collection and install the Log Analytics agent on your VMs and servers.
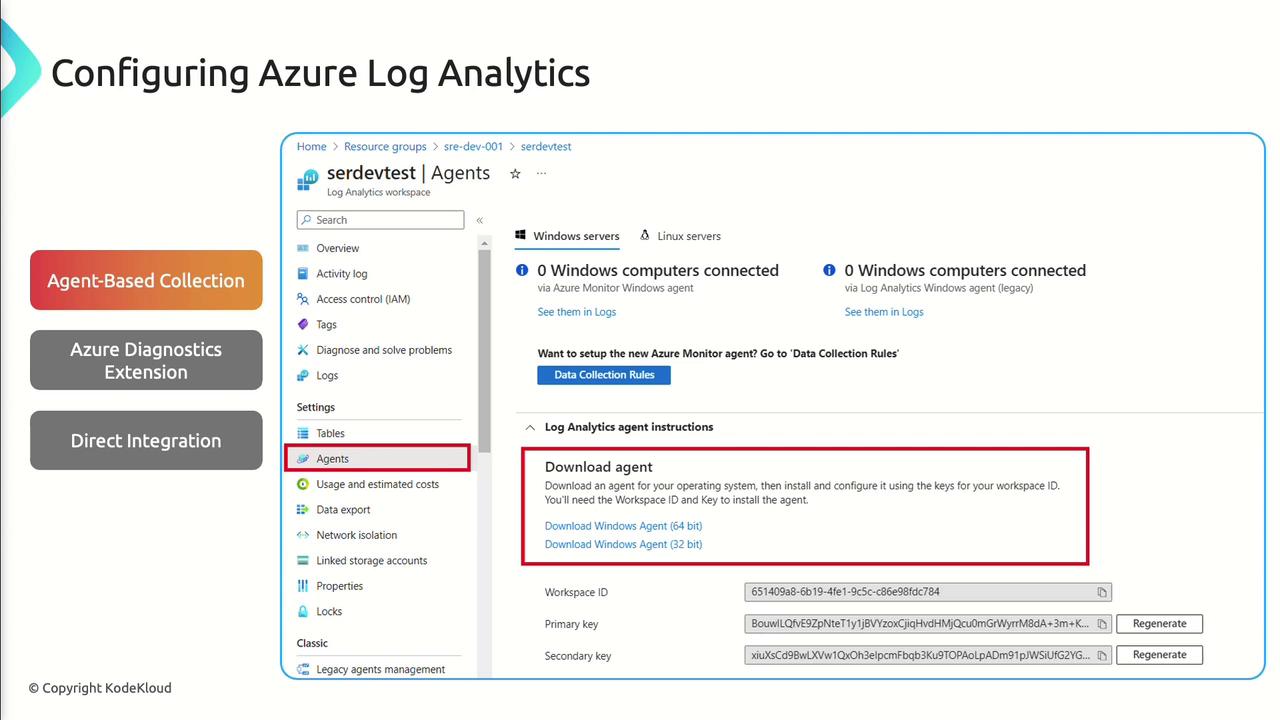
- Optionally enable the Azure Diagnostics Extension to collect platform logs and metrics directly from Azure services.
Installing multiple agents on the same VM can increase resource consumption—monitor agent CPU and memory usage.
Querying Logs with Kusto Query Language (KQL)
KQL is a powerful, read-only language for querying large log datasets. Use it to filter, summarize, and visualize data:Next Steps
You now know how to:- Configure and collect telemetry with Azure Monitor
- Set up a Log Analytics workspace and agents
- Integrate monitoring into Azure DevOps and GitHub pipelines
- Create and manage alerts for proactive DevOps actions
- Query and visualize logs using KQL
Links and References
- Azure Monitor Documentation
- Azure Log Analytics Overview
- Kusto Query Language (KQL) Guide
- Azure DevOps Integrations
- GitHub Actions for Azure