Learn how to download, install, and verify Istio 1.9.0 on a Kubernetes cluster using the demo profile. You’ll also explore built-in add-ons like Kiali, Prometheus, Grafana, and Jaeger for full observability.
Prerequisites
A running Kubernetes cluster (version compatible with Istio 1.9.0)
kubectl configured to interact with your cluster
Step 1: Download and Install Istio 1.1 Download Istio 1.9.0 Fetch the installer script and extract the release:
curl -Ls https://istio.io/downloadIstio | ISTIO_VERSION = 1.9.0 sh - cd istio-1.9.0 export PATH = $PWD / bin : $PATH
1.2 Install the Demo Profile
The demo profile is preconfigured with observability add-ons for testing and learning. It is not recommended for production environments.
Install Istio’s control plane and sample add-ons:
istioctl install --set profile=demo -y
kubectl apply -f samples/addons
1.3 Verify Installation Output After installation, you should see messages similar to:
namespace "istio-system" created
configmap "istio-sidecar-injector" created
customresourcedefinition "virtualservices.networking.istio.io" configured
customresourcedefinition "destinationrules.networking.istio.io" configured
deployment "grafana" created
deployment "kiali" created
service "grafana" created
service "kiali" created
Step 2: Istio Components Overview Once installed, Istio deploys core control-plane components and add-ons. Here’s what you get:
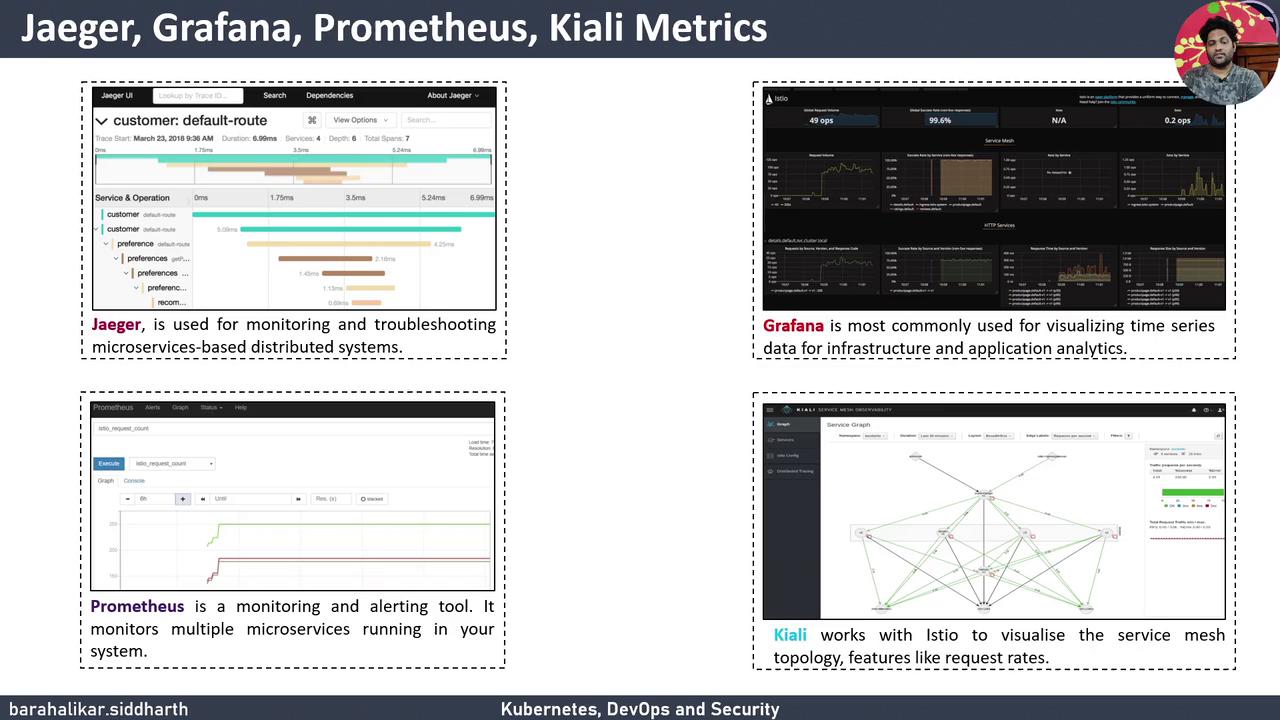
Component Purpose Namespace istio-system Isolates the service mesh control plane ConfigMap istio-sidecar-injector Automates Envoy sidecar injection CRDs (VirtualService, DestinationRule) Define traffic management policies Control Plane (istiod, gateways) Manages configuration and proxies Jaeger Distributed tracing Prometheus Metrics collection and alerting Grafana Visualize time-series data Kiali Service mesh observability and topology maps
Step 3: Verify the Control Plane and Add-ons 3.1 List All Istio Resources Run:
kubectl -n istio-system get all
Expected output:
NAME                                    READY   STATUS    RESTARTS   AGE
pod/istiod-xxxxxx-xxxxx                1/1     Running   0          1m
pod/istio-ingressgateway-xxxxx-xxxxx   1/1     Running   0          1m
pod/istio-egressgateway-xxxxx-xxxxx    1/1     Running   0          1m
pod/prometheus-xxxxx-xxxxx             1/2     Running   0          1m
pod/grafana-xxxxx-xxxxx                1/1     Running   0          1m
pod/jaeger-xxxxx-xxxxx                 1/1     Running   0          1m
pod/kiali-xxxxx-xxxxx                  1/1     Running   0          1m

NAME                         TYPE           CLUSTER-IP        EXTERNAL-IP   PORT(S)
service/istiod               ClusterIP      10.0.0.123        <none>        15012/TCP,443/TCP
service/istio-ingressgateway LoadBalancer   10.0.0.124        <pending>     80:31500/TCP,443:31501/TCP
service/prometheus           ClusterIP      10.0.0.125        <none>        9090/TCP
service/grafana              ClusterIP      10.0.0.126        <none>        3000/TCP
service/jaeger-collector     ClusterIP      10.0.0.127        <none>        14250/TCP,14268/TCP
service/kiali                ClusterIP      10.0.0.128        <none>        20001/TCP
Step 4: Enable Automatic Sidecar Injection Label your application namespace to inject Envoy sidecars automatically:
kubectl label namespace default istio-injection=enabled
Enabling sidecar injection will add an Envoy proxy to every pod in the default namespace. Ensure your workloads are compatible.
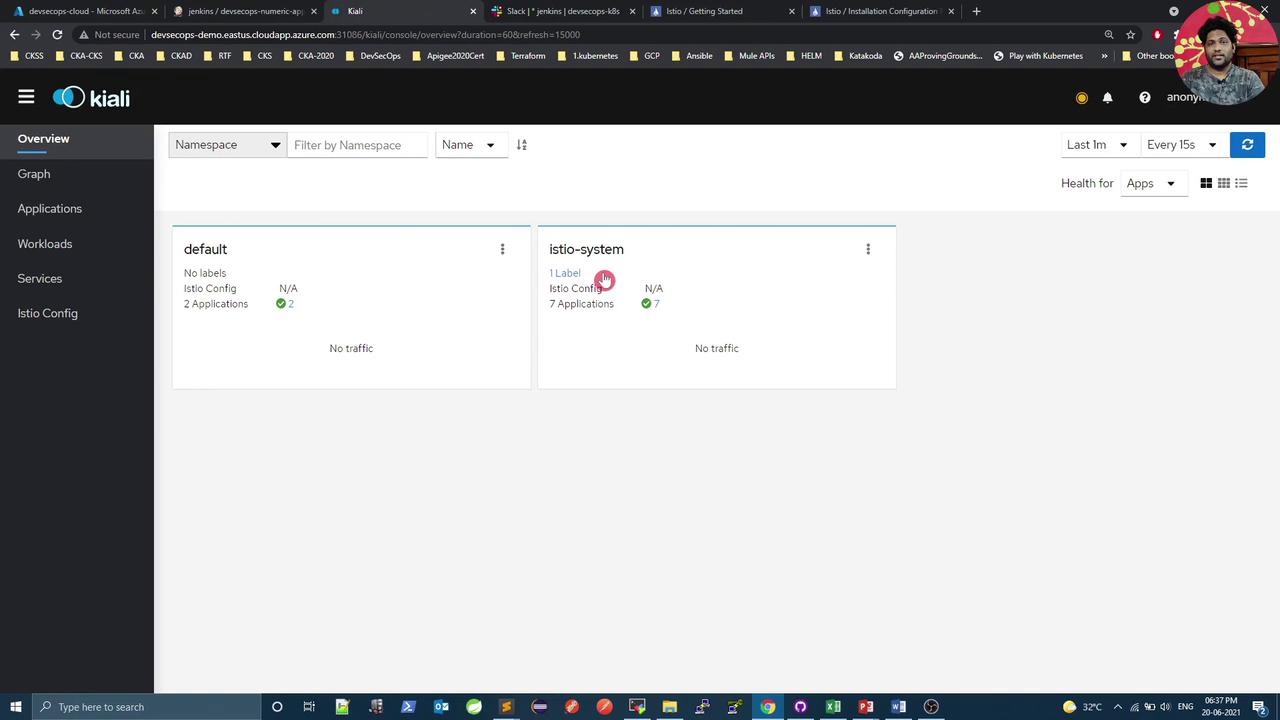
Step 5: Access the Kiali Dashboard By default, Kiali’s service is ClusterIP. To expose it on a NodePort:
5.1 Change Service Type kubectl edit service kiali -n istio-system
In the editor, update:
Save and exit.
5.2 Retrieve and Use the NodePort kubectl get service kiali -n istio-system
Sample output:
NAME    TYPE       CLUSTER-IP     EXTERNAL-IP   PORT(S)                         AGE
kiali   NodePort   10.0.0.128     <none>        20001:32001/TCP,9090:32002/TCP   2m
Point your browser to:
to open the Kiali UI.
Links and References