GitLab CI/CD: Architecting, Deploying, and Optimizing Pipelines
Auto DevOps
Switch to ULTIMATE Tier
Unlock the full power of GitLab with the Ultimate subscription. In this guide, we’ll walk through activating a 30-day Ultimate trial and exploring key Ultimate-only features:
- Environment Dashboard
- Operations Dashboard
- Security Dashboard
- Protected Environments
Each section includes step-by-step instructions, screenshots, and best practices.
Activate Your 30-Day Ultimate Trial
By default, the Environment, Operations, and Security dashboards are exclusive to Premium and Ultimate tiers. To test them on a Free account, start a 30-day Ultimate trial:
Note
Starting a trial does not commit you to a paid plan—your account reverts to Free when the trial ends.
- Go to Help → Documentation in the top menu.
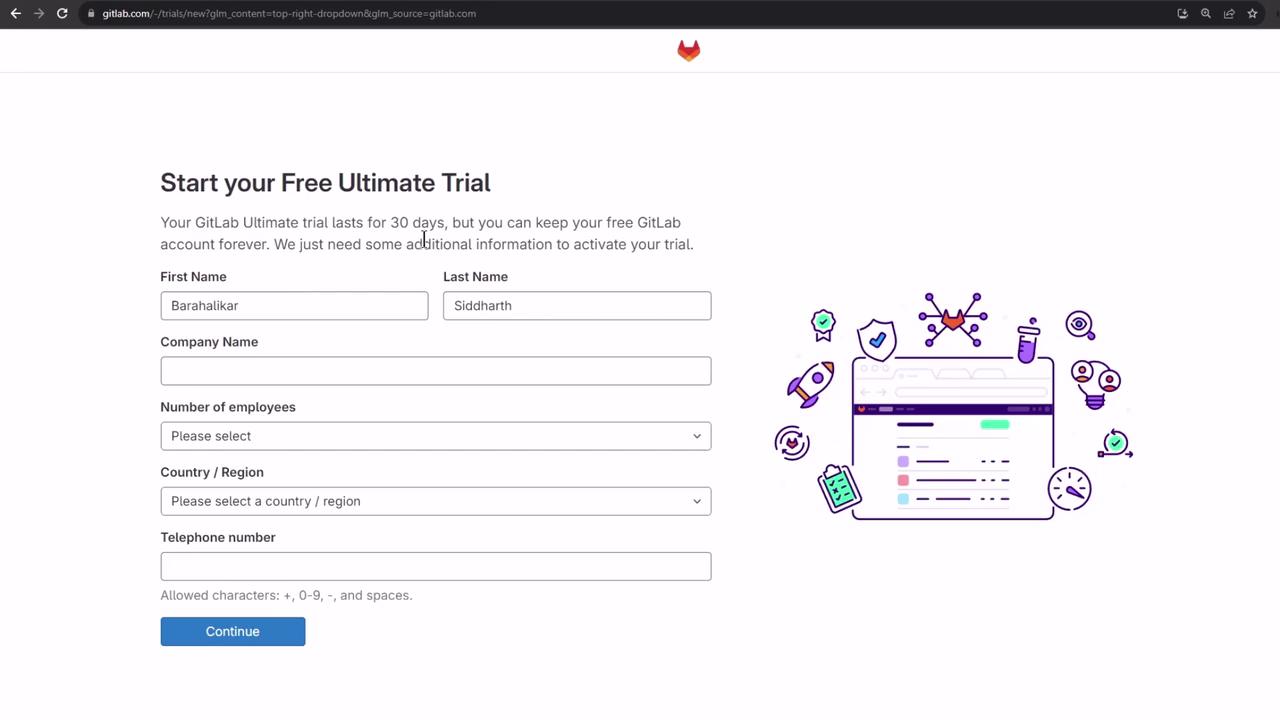
- Click Start an Ultimate trial and fill in your details: name, company, employee count, country, and phone.
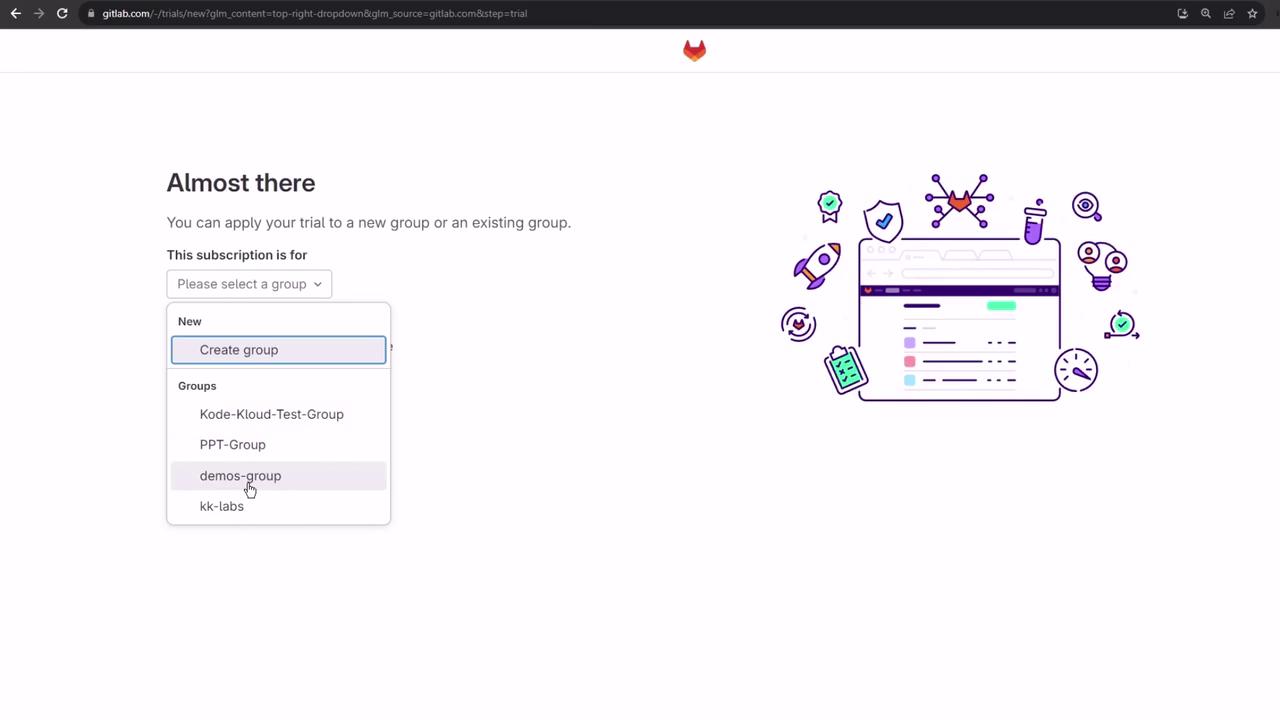
- Choose the group for the trial, for example,
demos-group. - Submit the form.
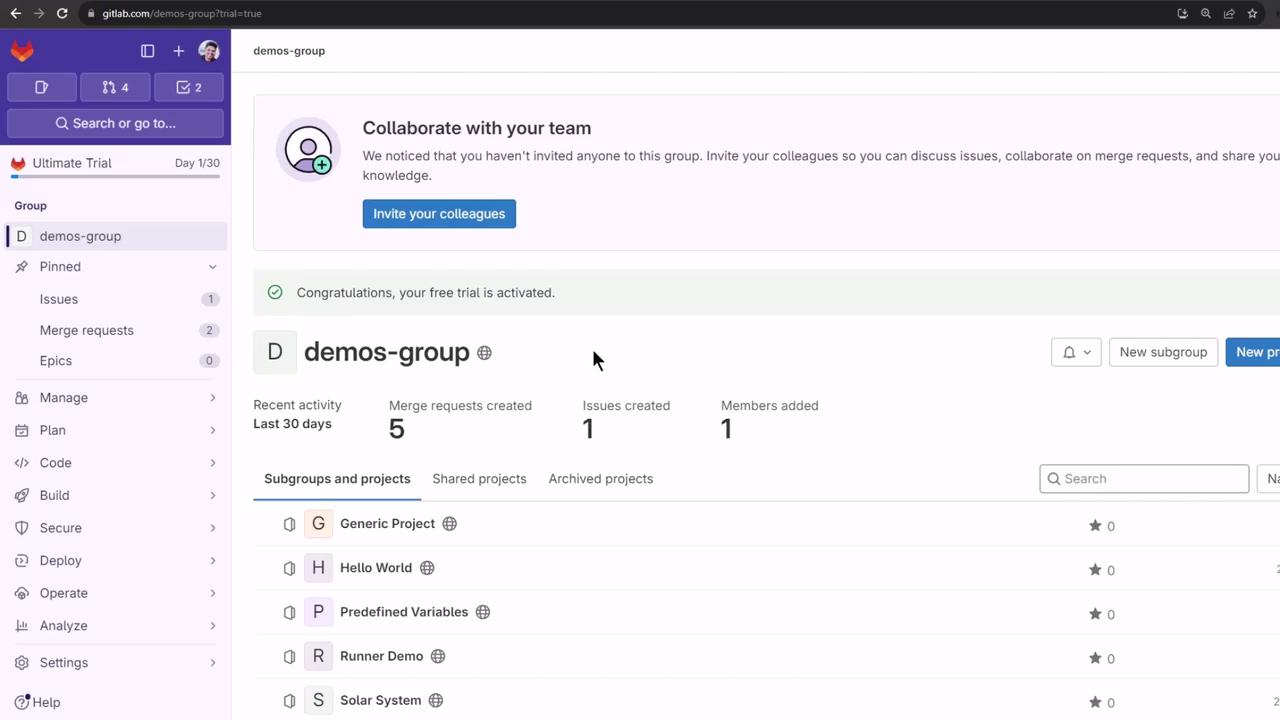
Once the trial is active, a confirmation dialog displays your start and end dates.
Navigate the Demos Group Dashboard
After activation, head back to Groups → demos-group to see the new dashboards and features.
Ultimate-Tier Dashboards at a Glance
| Dashboard | Purpose | Location |
|---|---|---|
| Environment Dashboard | Cross-project deployment status overview | Group → Environments |
| Operations Dashboard | Pipeline health, alerts, and metrics | Group → Operations → Dashboard |
| Security Dashboard | Vulnerability tracking and compliance status | Security & Compliance → Dashboard |
| Protected Environments | Deployment approval and access control | Project → Settings → CI/CD → Protected Environments |
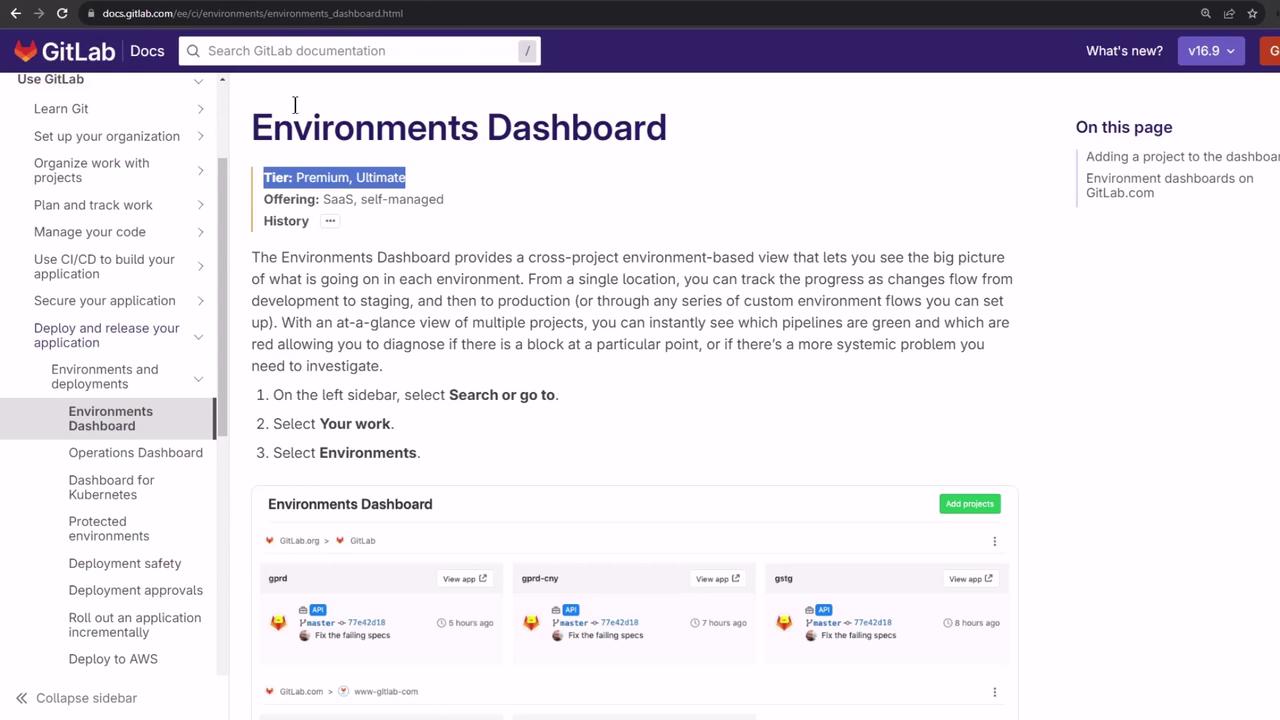
Environment Dashboard
The Environment Dashboard aggregates deployments across all your projects:
- In the group view, click Manage Environments.
- Select projects (e.g.,
solar-system,solar-system-auto-devops). - Click Add.
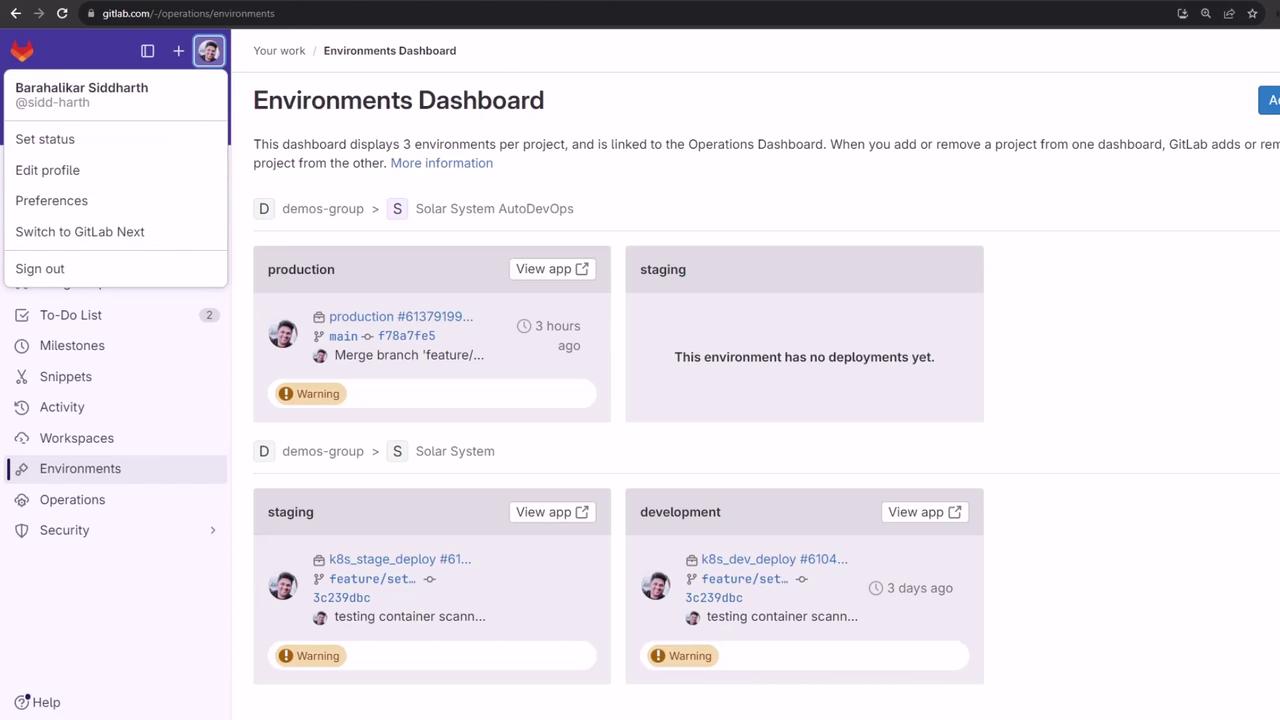
You’ll see the latest production, staging, and development deployments in one place.
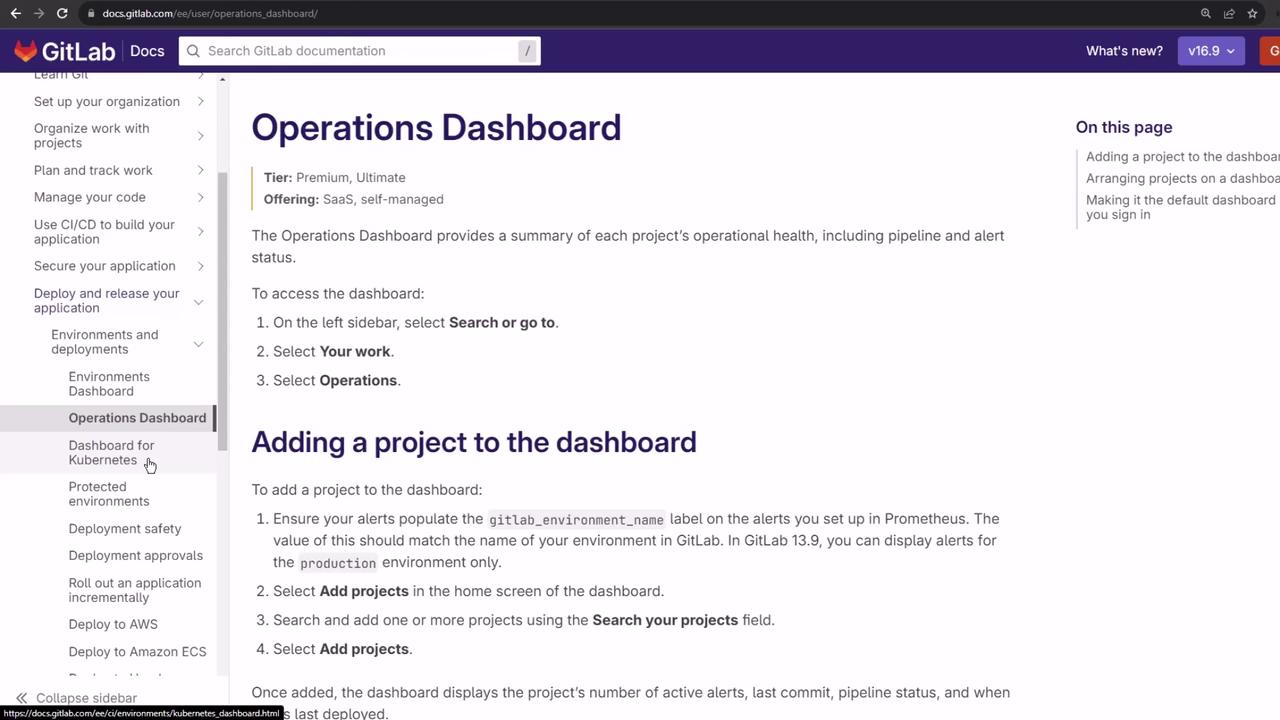
Operations Dashboard
Monitor operational health, pipeline status, and incident alerts for each project:
- Navigate to Operations → Dashboard in your group.
- Click Add projects and choose the ones you want to track.
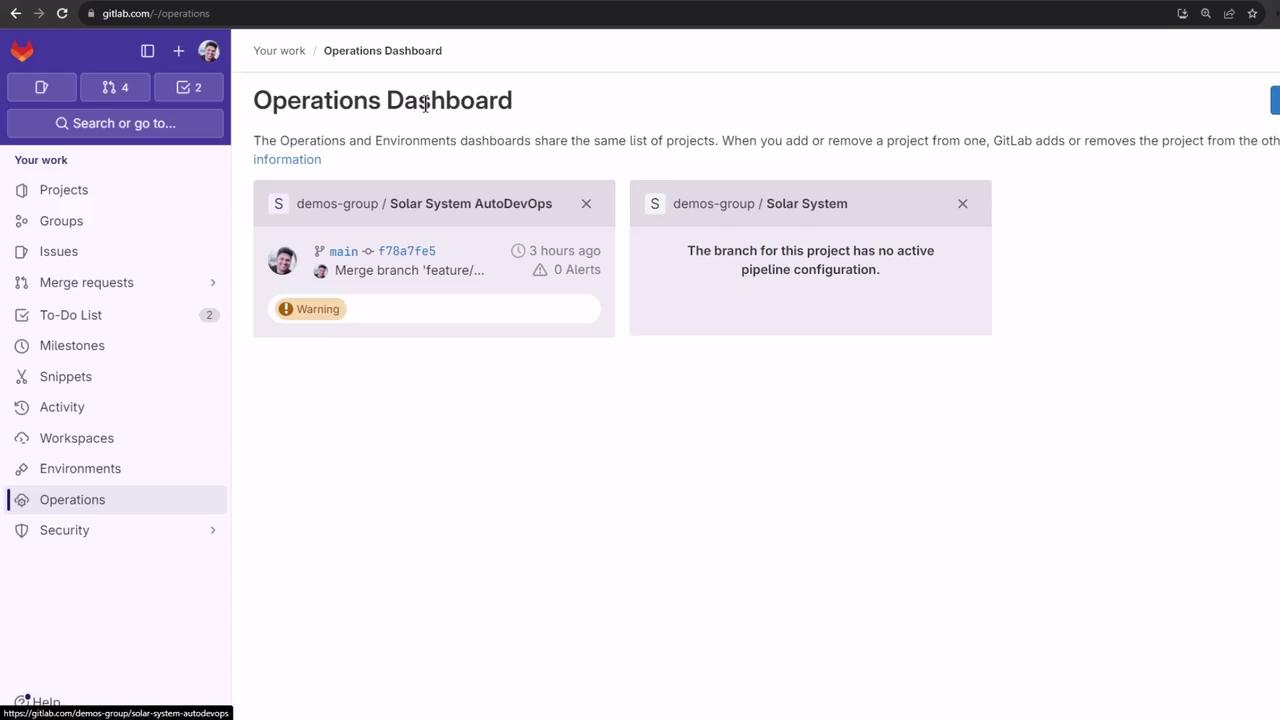
Security Dashboard
Track vulnerabilities and compliance status across projects:
- Go to Security & Compliance → Dashboard.
- Add your projects (e.g.,
solar-system,solar-system-auto-devops). - Run a pipeline with security scanning enabled.
After the pipeline completes, this view updates with any findings from the last 30 days.
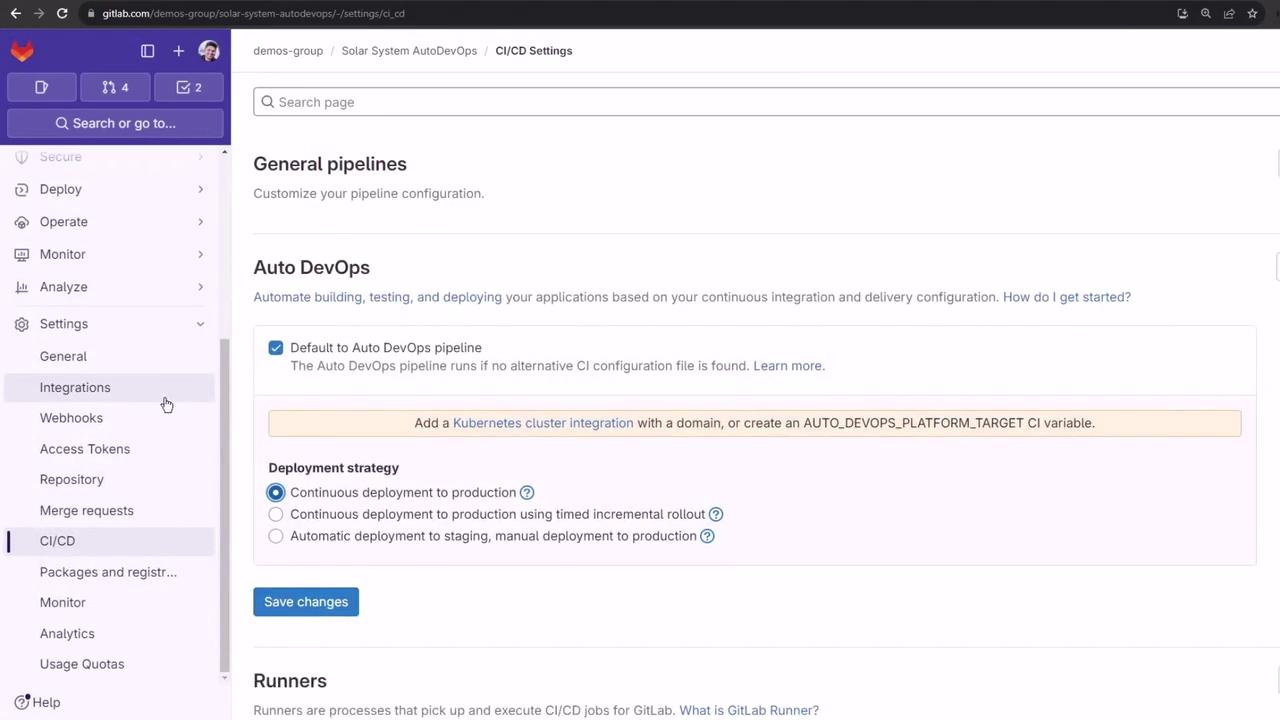
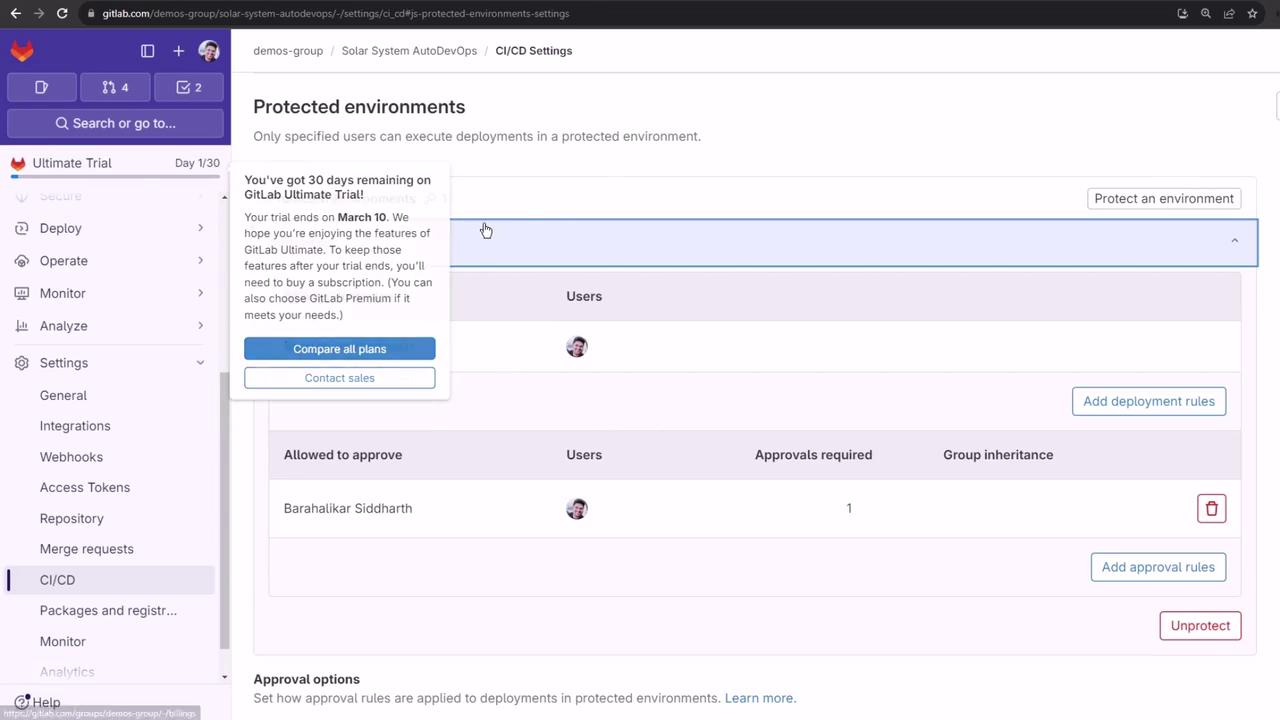
Protected Environments in CI/CD
Give only specific users or approvers the right to deploy to sensitive environments:
- Open your project (e.g., solar-system-auto-devops).
- Go to Settings → CI/CD and expand Protected Environments.
Warning
Protecting an environment is irreversible without removing rules—be cautious when specifying approvers.
Refer to the official documentation for full details:
Protected Environments Documentation
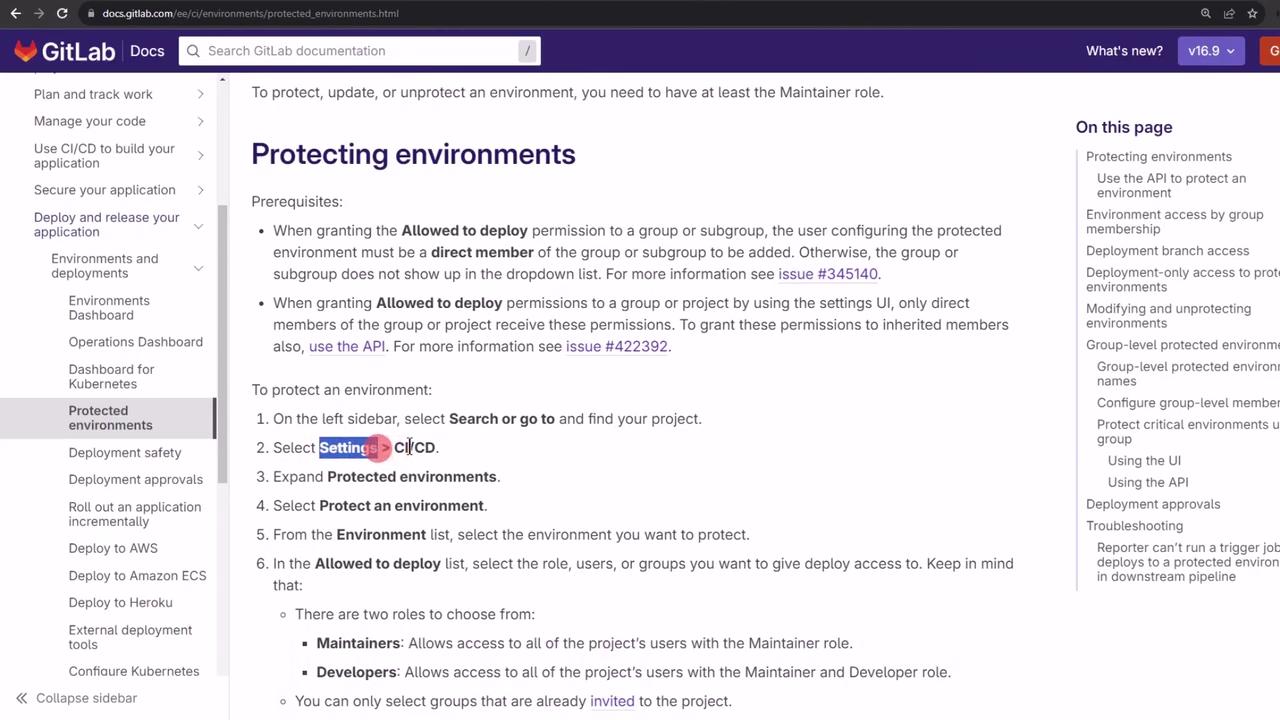
If Protected Environments doesn’t appear, refresh the page. Then click Protect to set a rule:
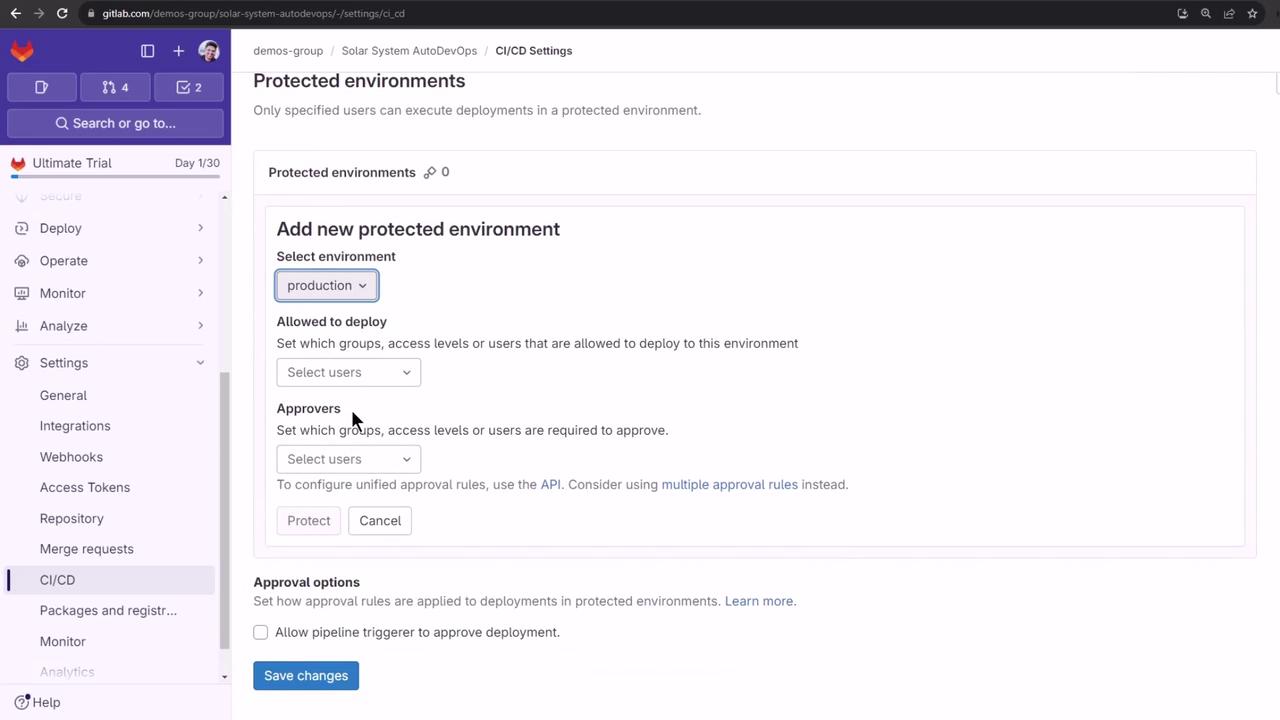
- Select environment (e.g.,
production). - Define who can deploy.
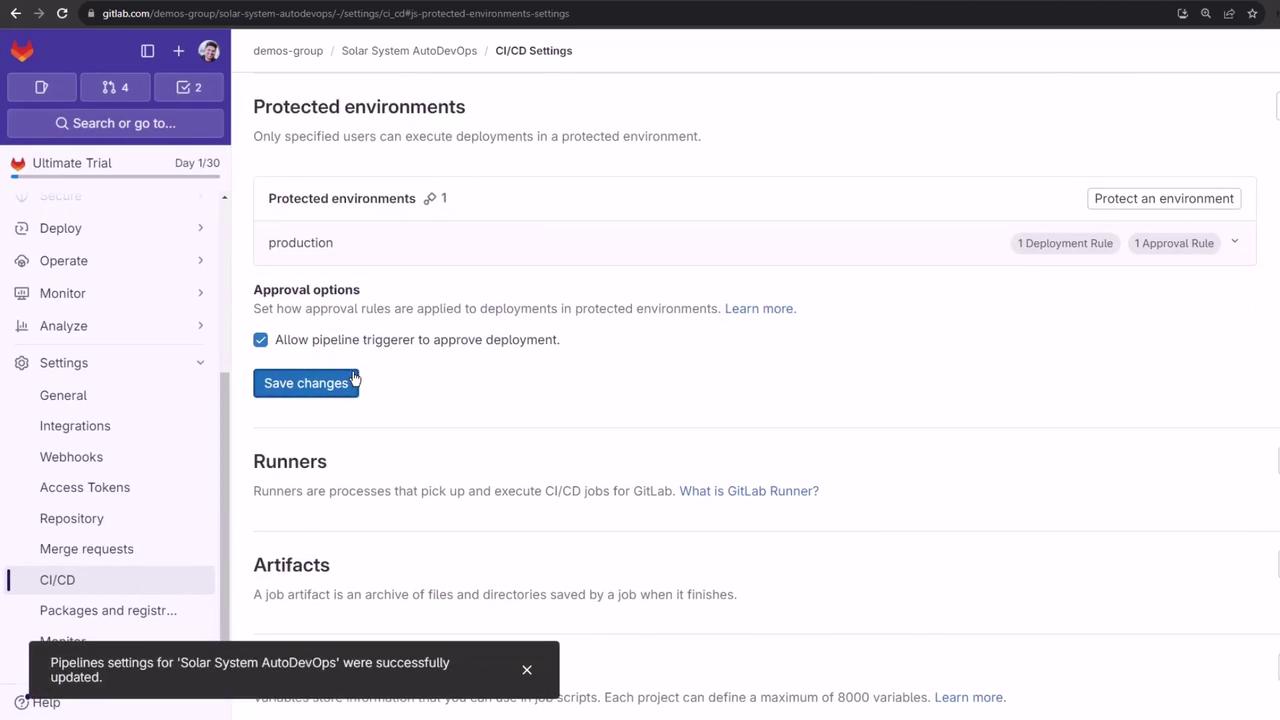
- Assign approvers and disable “Allow the person who triggered the pipeline to approve the deployment” for stricter controls.
After saving, you’ll see your deployment and approval rules listed:
Next Steps
Trigger another Auto DevOps pipeline to explore additional Ultimate-tier features and integrations. Stay tuned for guides on advanced security scanning, compliance reports, and performance insights.
Links and References
Watch Video
Watch video content