production environment by merging a feature branch into main. Previously, we ran the pipeline in the feature branch and verified deployment to the review stage using Auto DevOps. Now, accepting the merge request will trigger a new pipeline on main.
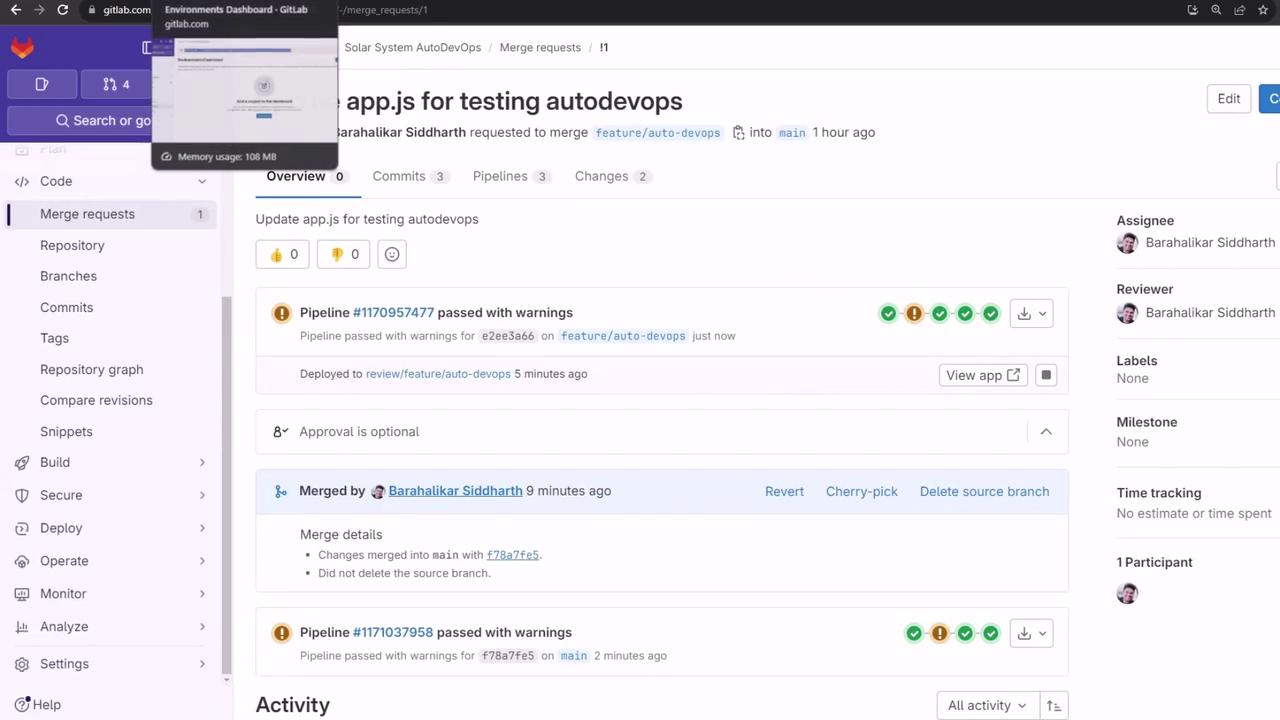
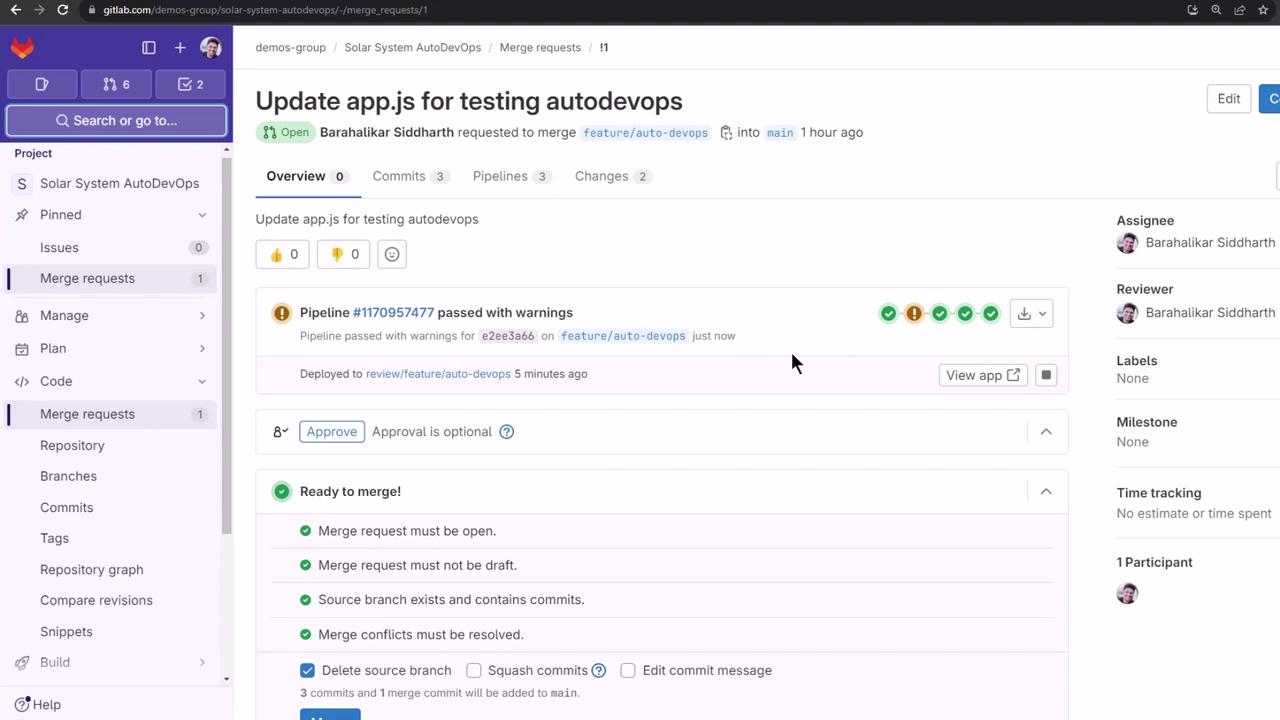
1. Merge Feature Branch into Main
First, confirm that all review jobs have passed:
main:
2. Monitor the Pipeline on Main
Navigate to CI/CD > Pipelines to see the new run: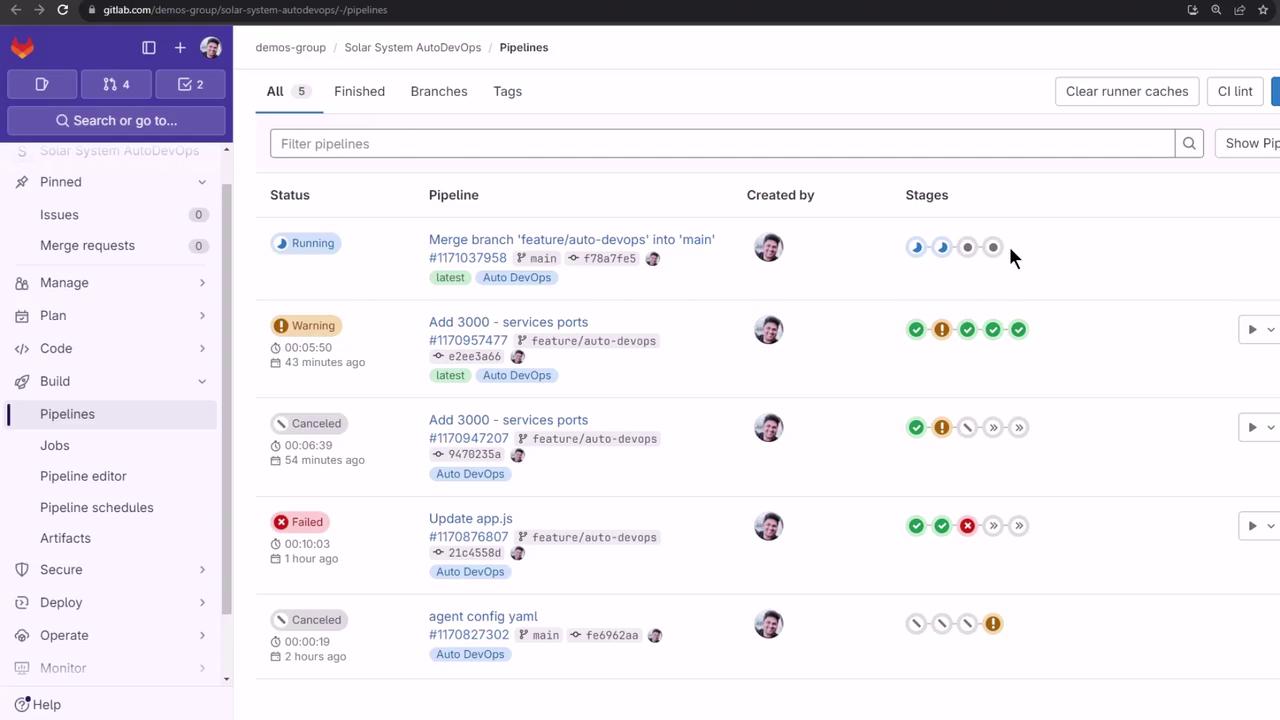
main pipeline executes the following stages:
| Stage | Purpose |
|---|---|
| build | Compile code and build artifacts |
| test | Run unit and integration tests |
| production | Deploy to the production namespace |
| performance | Execute browser performance tests |
To speed up demos, cancel the test jobs manually once they start.
3. Validate Production Deployment
Ensure that theproduction namespace is empty before deployment:
The warnings above show that your
KUBECONFIG file has overly permissive access. Restrict file permissions to prevent security issues.4. Test Load Balancing
Confirm traffic distribution across all replicas by curling the/os endpoint repeatedly:
5. Performance Testing
After production, the pipeline automatically runs browser performance benchmarks and archives the results:
6. Reviewing Auto DevOps Settings
In your project, go to Settings > CI/CD, then expand Auto DevOps to review deployment strategies. We used Continuous Deployment to production in this lesson: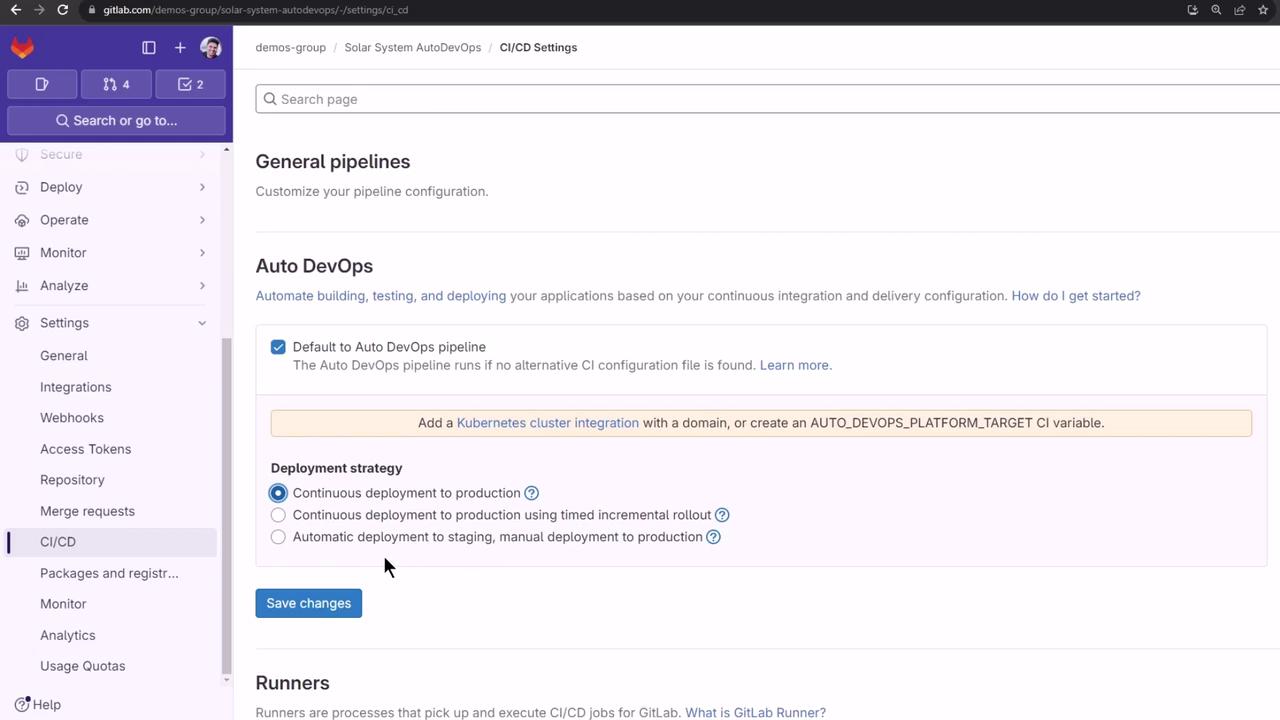
7. Exploring Dashboards and Reports
Auto DevOps generates code quality, SAST, and secret detection artifacts. On the free tier, download these from Job Artifacts. With Premium/Ultimate plans, you can view reports directly:- Security Dashboard: Aggregated vulnerability findings
- Operations Dashboard: Live environment and deployment status
Vulnerability Report
From the top menu, choose Security & Compliance > Vulnerability report: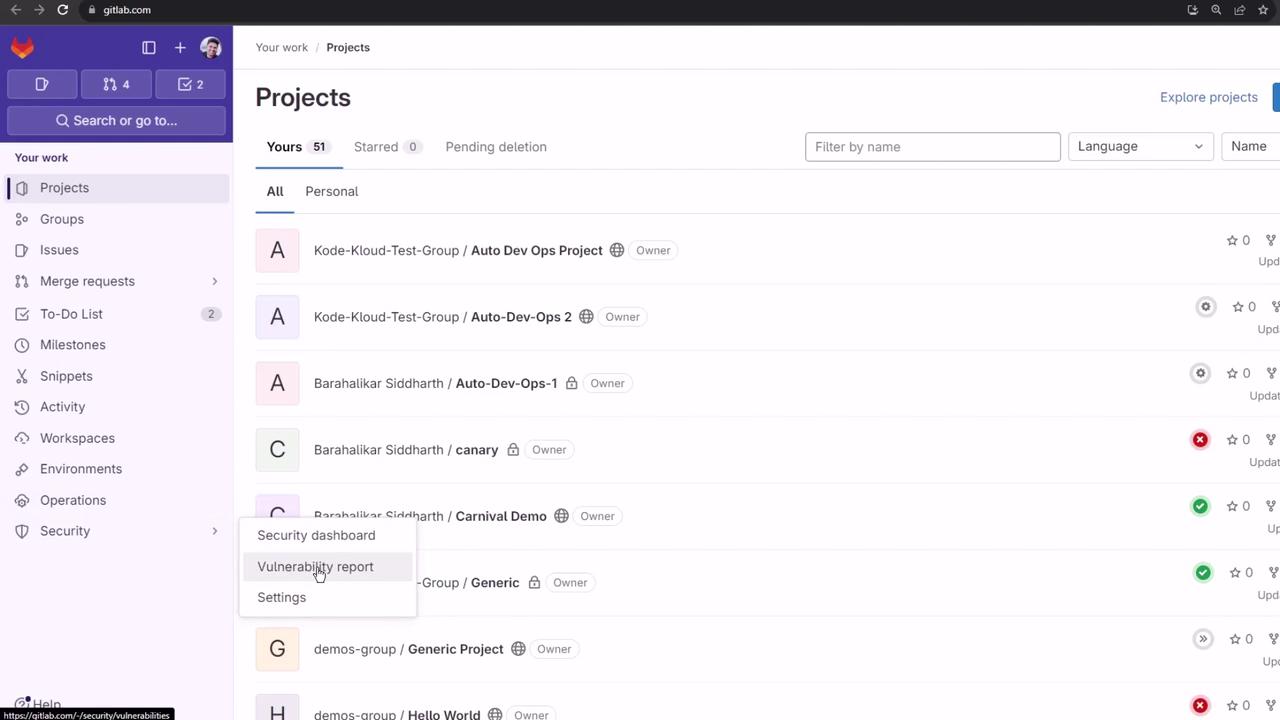
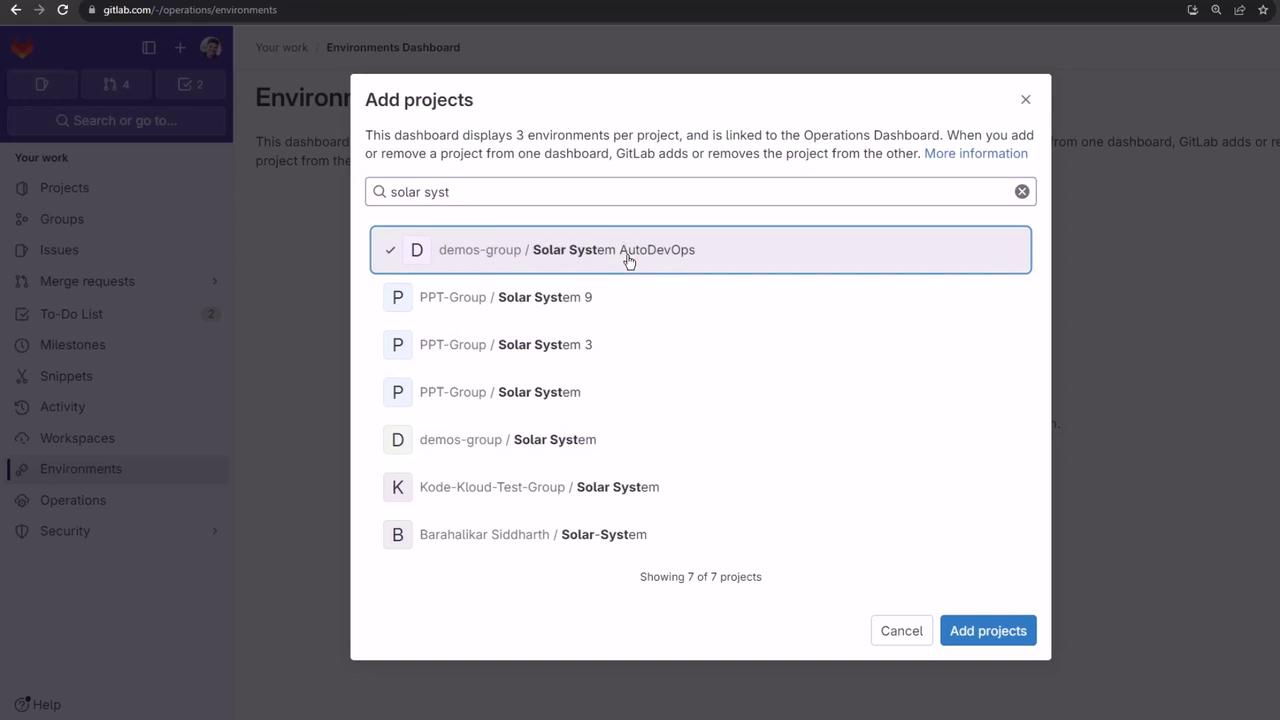
Environments Dashboard
Add multiple projects to an Environments Dashboard (Premium/Ultimate only):