This article discusses disaster recovery models, focusing on designing for reliability and the importance of RPO and RTO in business continuity planning.
Welcome back, students.This article, presented by Michael Forrester from KodeKloud, delves into designing for reliability within disaster recovery—a critical topic for both the AWS Solutions Architect exam and real-world implementations.Disaster recovery, often referred to as business continuity, is essential because the ability to recover from service disruptions is at the heart of system reliability. Think of reliability and disaster recovery as peanut butter and chocolate—each enhances the other. Without a strong resiliency and recovery strategy, your workloads become vulnerable when disasters strike.
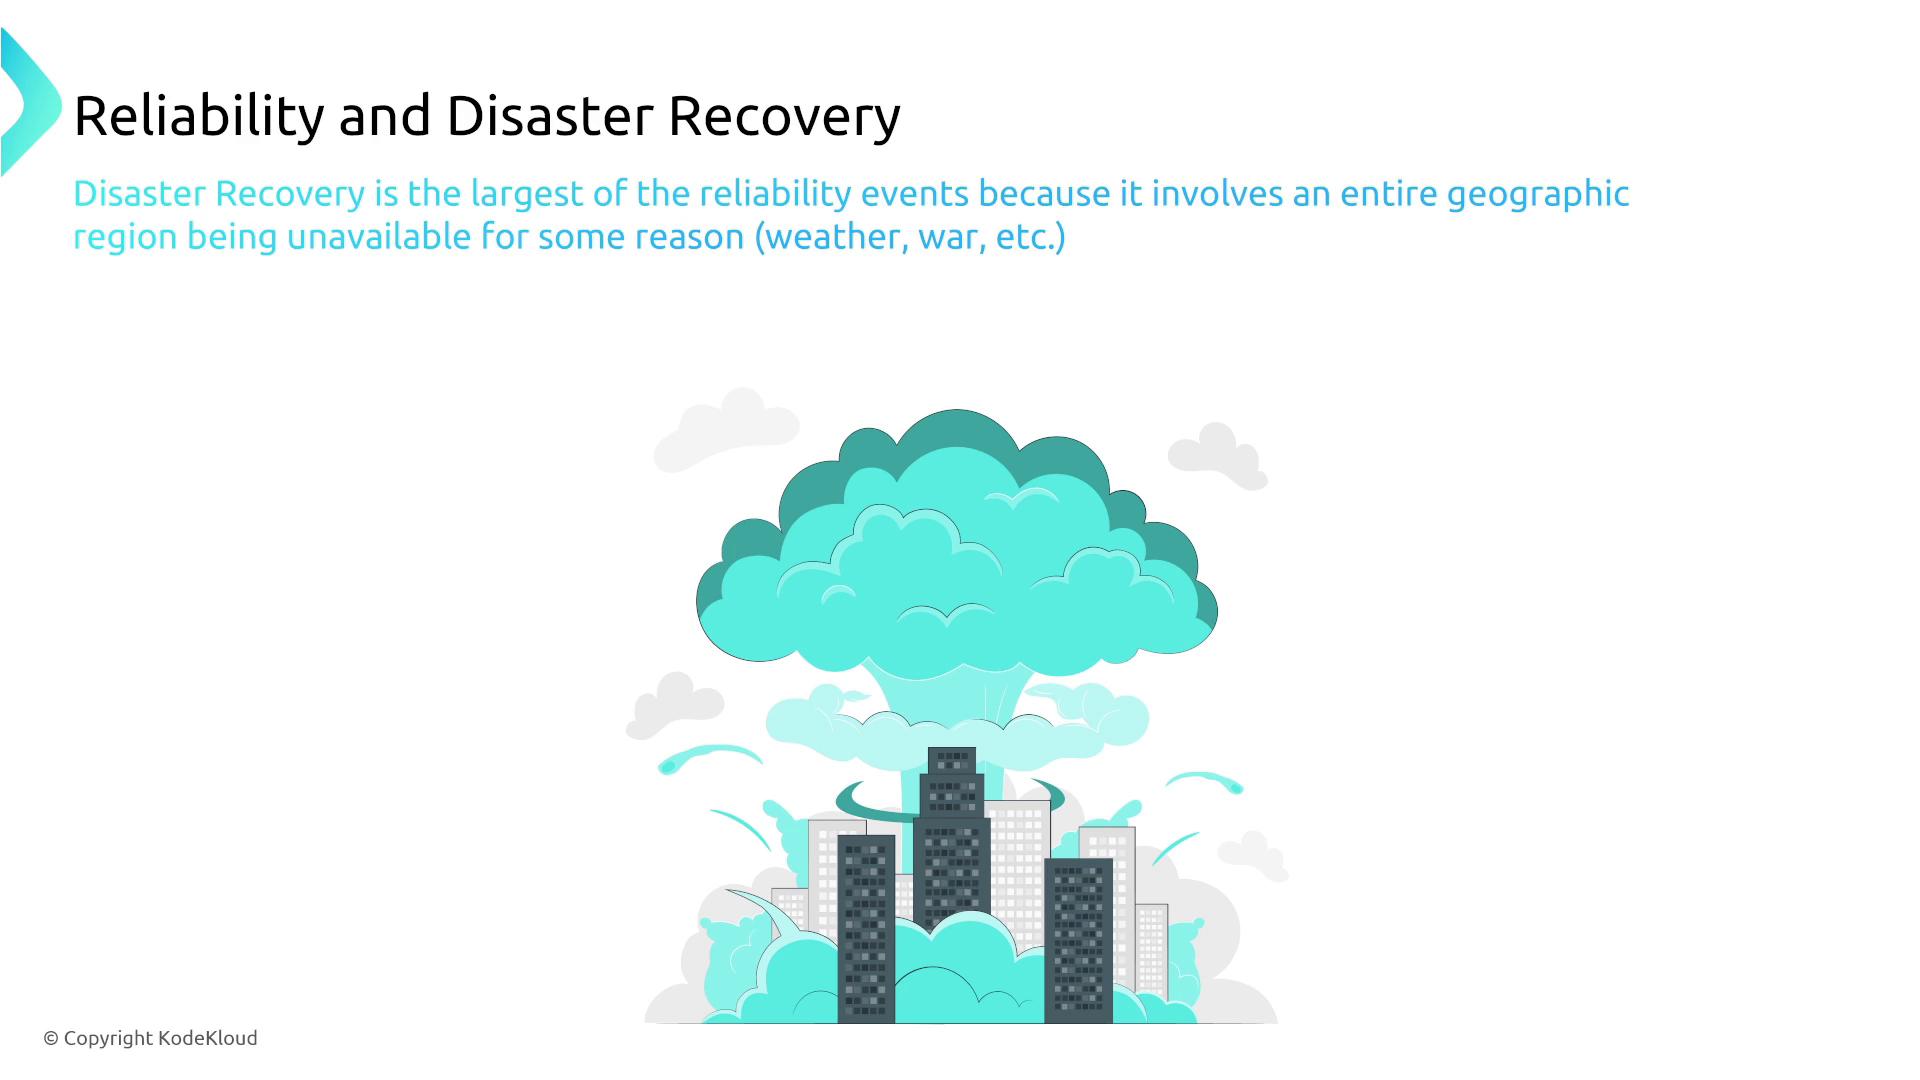
To design robust systems, always ensure you have a clear resiliency/recovery plan detailing how your workloads respond during outages—whether due to natural disasters, technical failures, or other unexpected events. It is important to plan for scenarios where an entire geographic region might be lost.Key concepts of disaster recovery planning include:
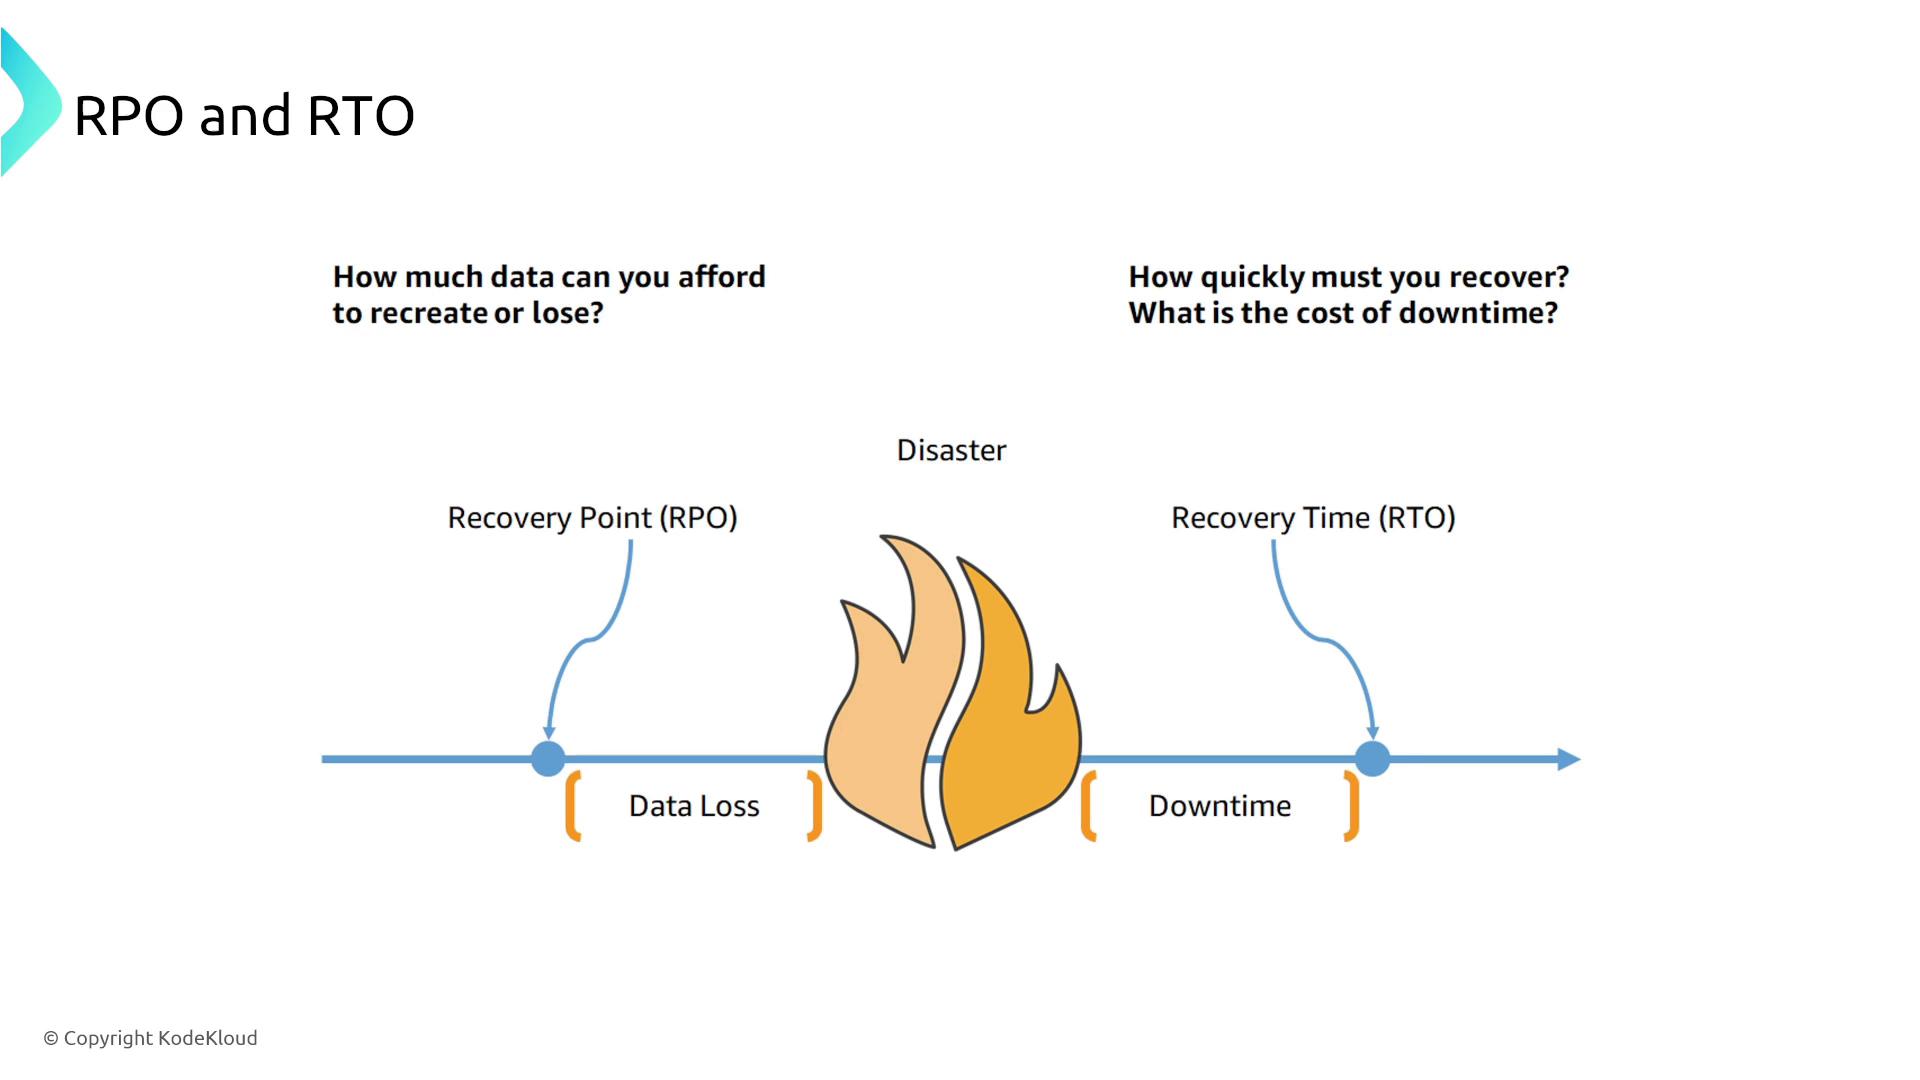
Recovery Point Objective (RPO): The amount of data you are willing to lose, defined by your backup frequency. Essentially, it answers the question, “At what point in time was your last backup?”
Recovery Time Objective (RTO): The maximum acceptable time to restore service, incorporating the time needed to restore data and reactivate systems.
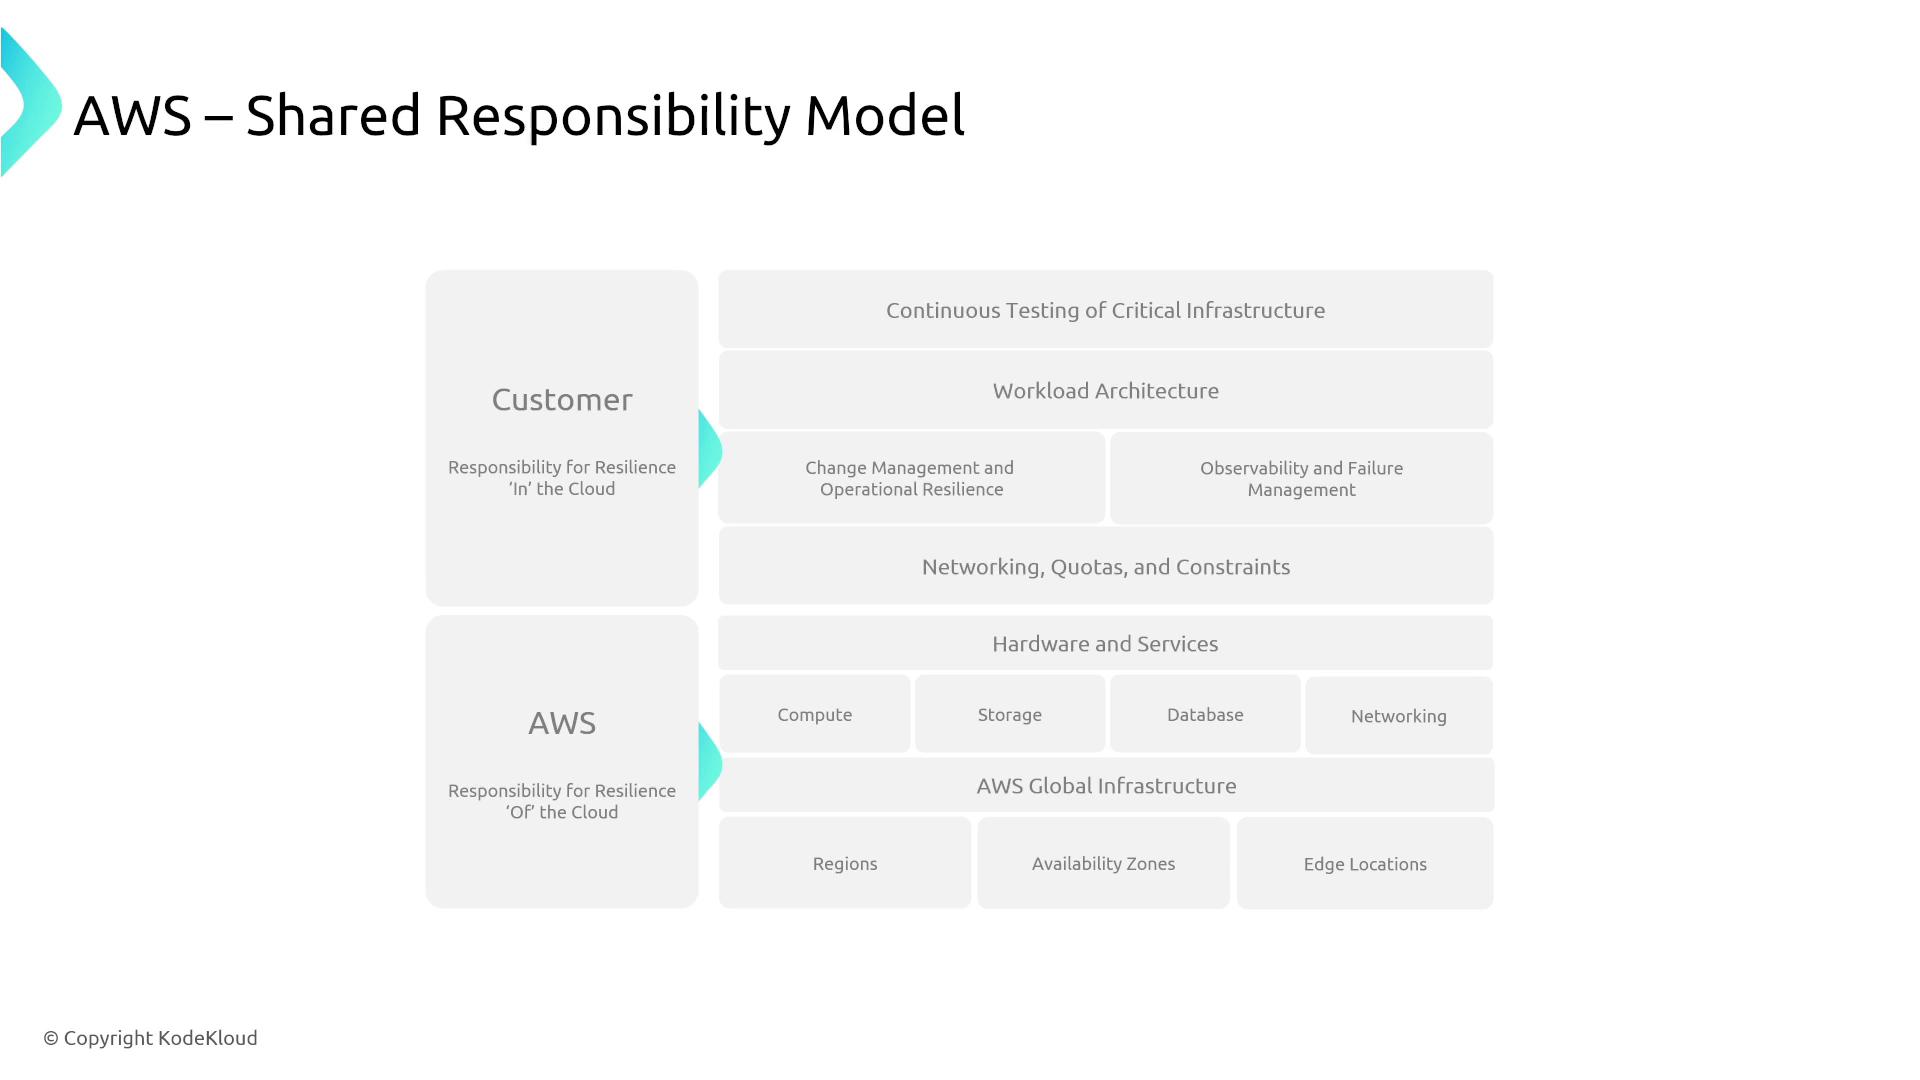
Together, these metrics are integral to your Business Continuity Planning (BCP). Keep in mind AWS’s Shared Responsibility Model: while AWS offers services that help enable resiliency (such as replication features), you are responsible for configuring and managing these services. AWS does not directly manage your disaster recovery strategy at the availability zone level, though some highly managed services come with built-in resiliency.
RPO: Answers the question, “How much data can you afford to lose?” For instance, if backups run hourly and it takes four hours to restore a database, even a one-hour data loss can result in extended downtime due to recovery processes.
RTO: Answers, “How long does it take to fully restore the service?” If it takes several hours to bring a database back online, that period determines your RTO.
RTO focuses on service availability, while RPO is primarily concerned with data loss.
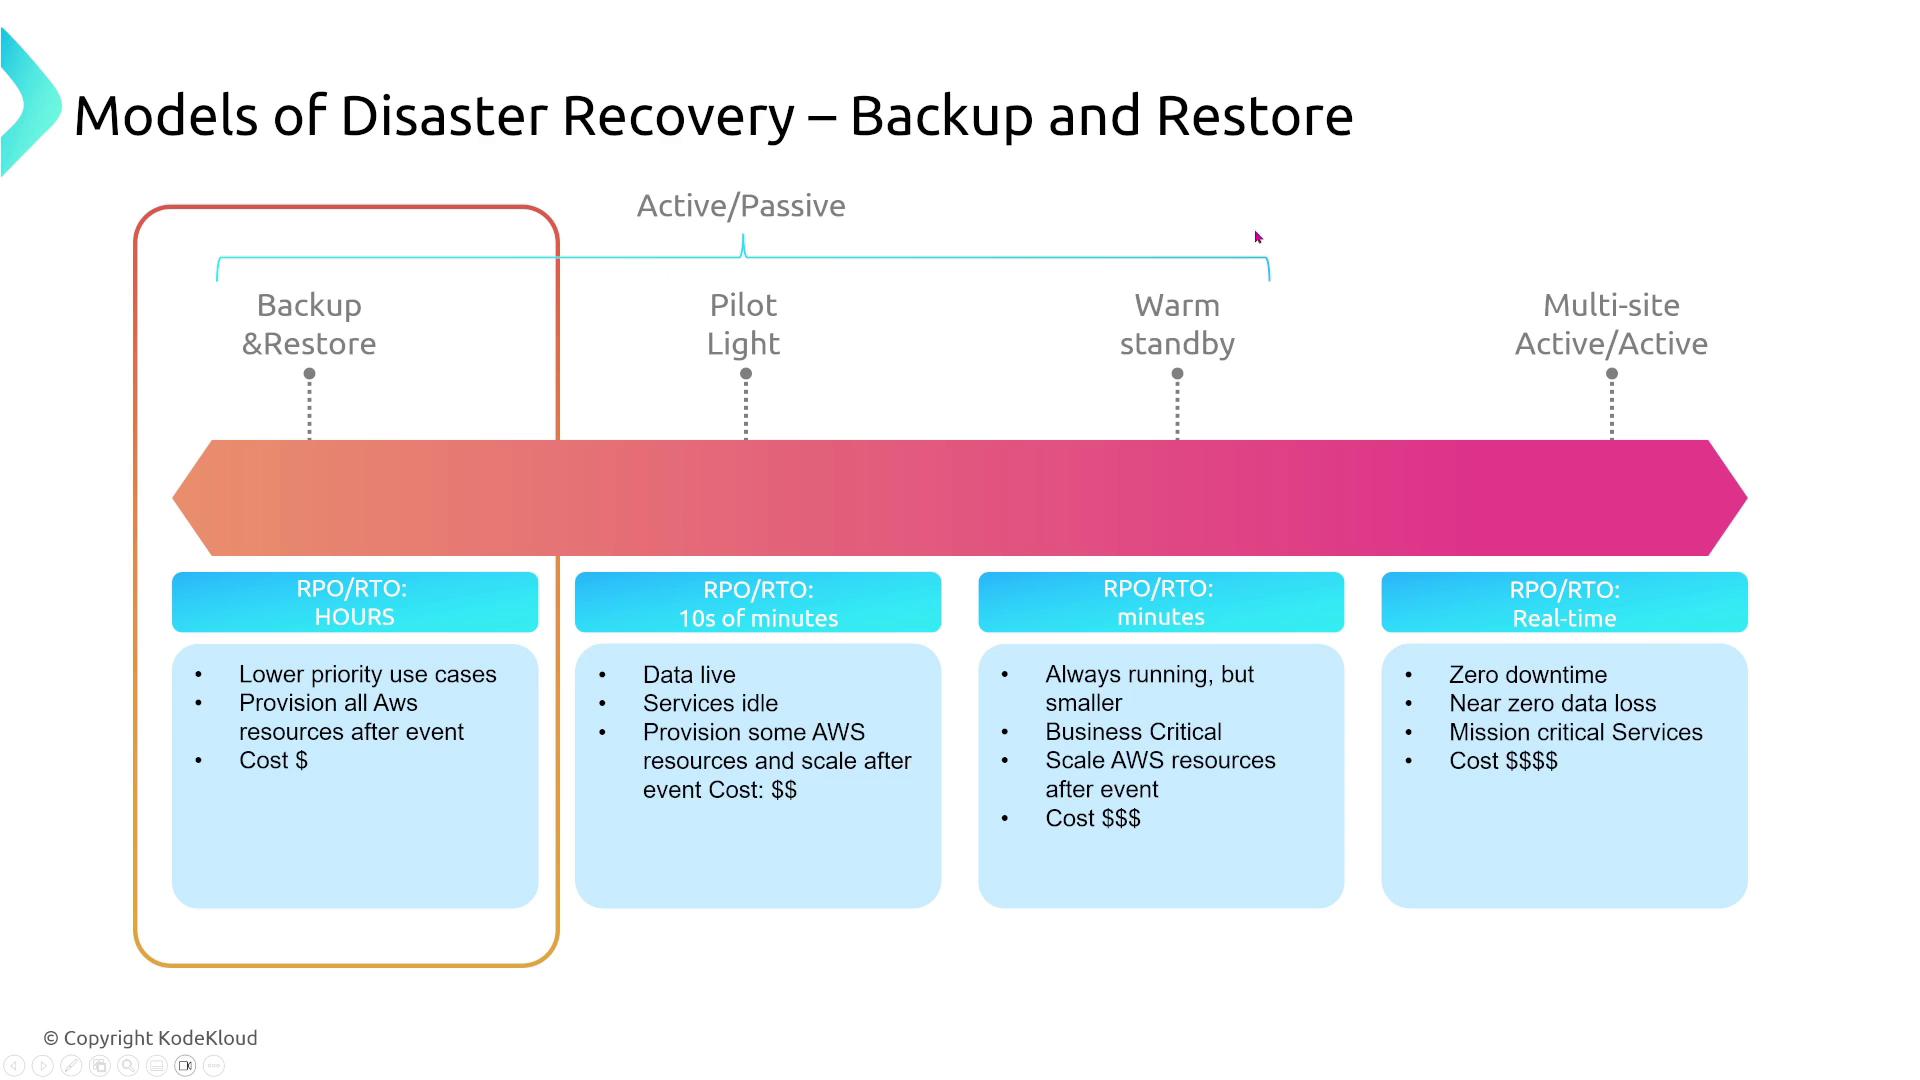
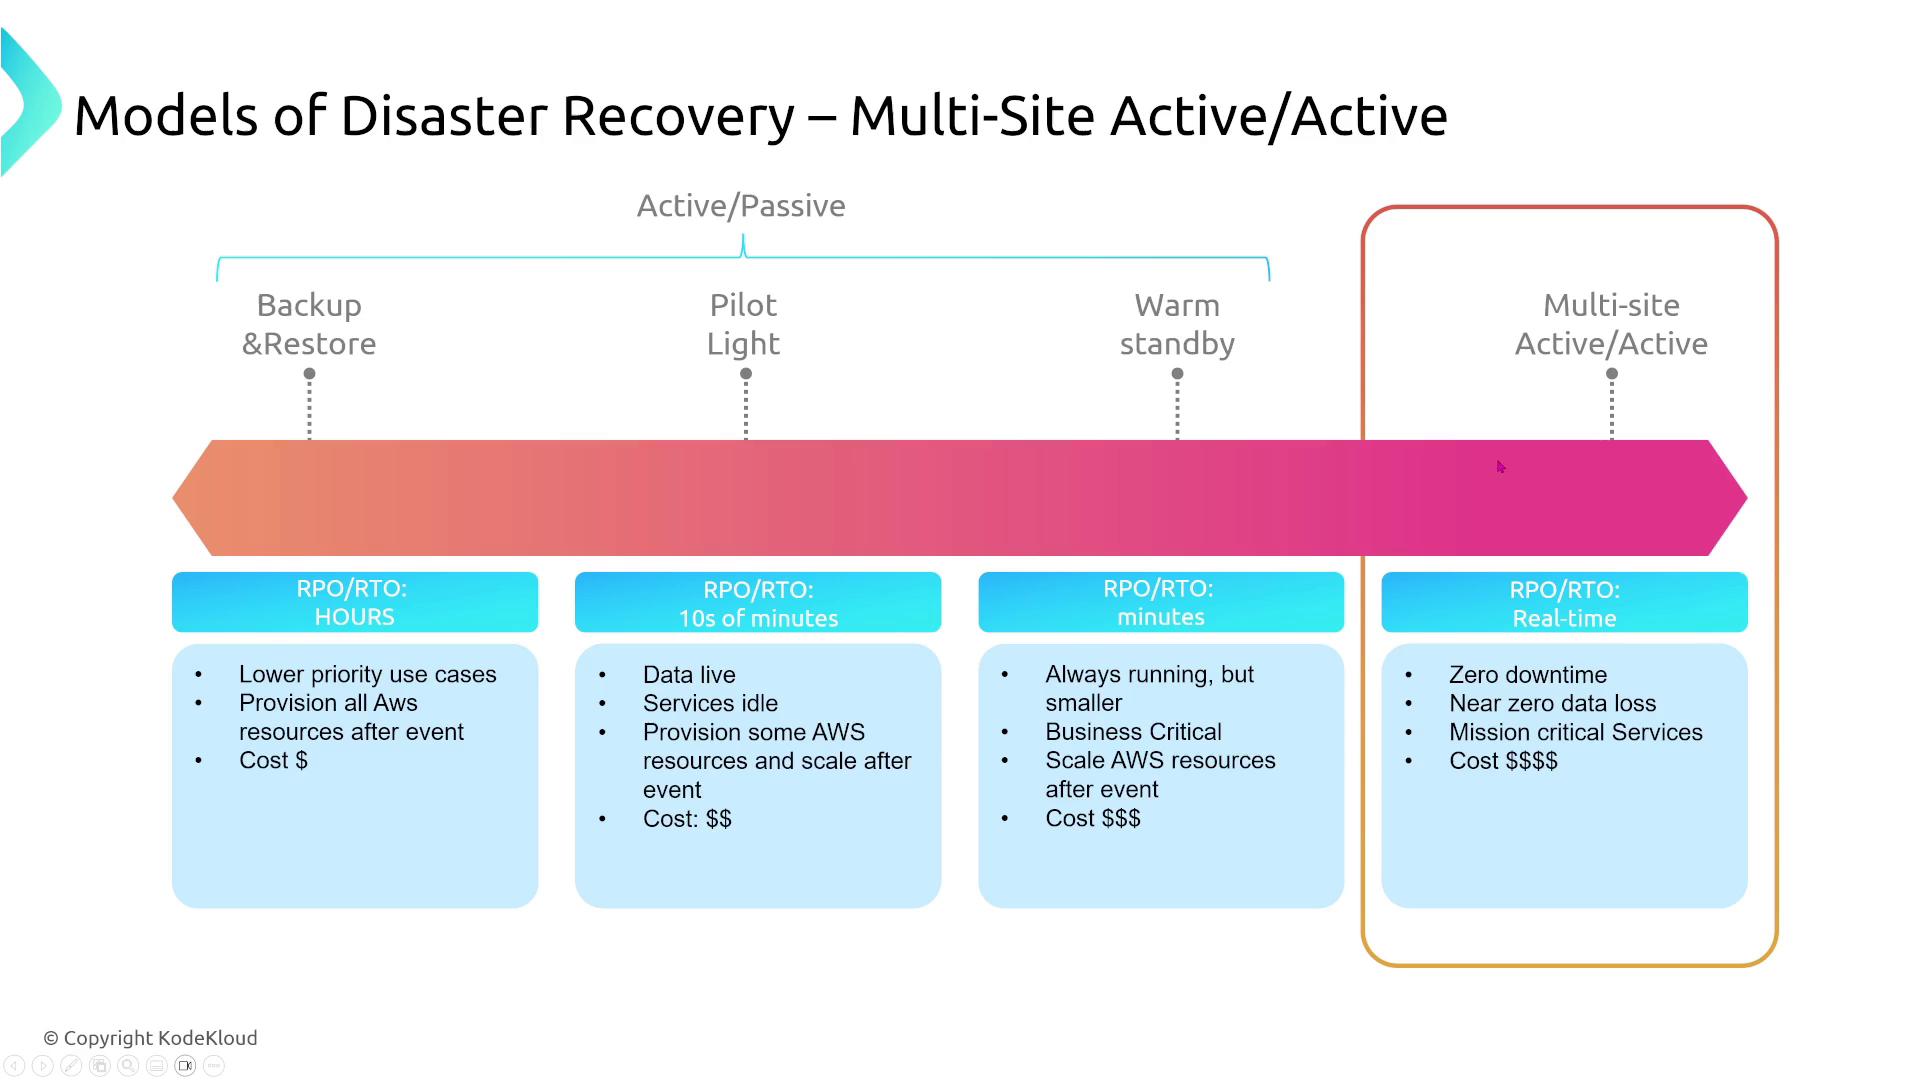
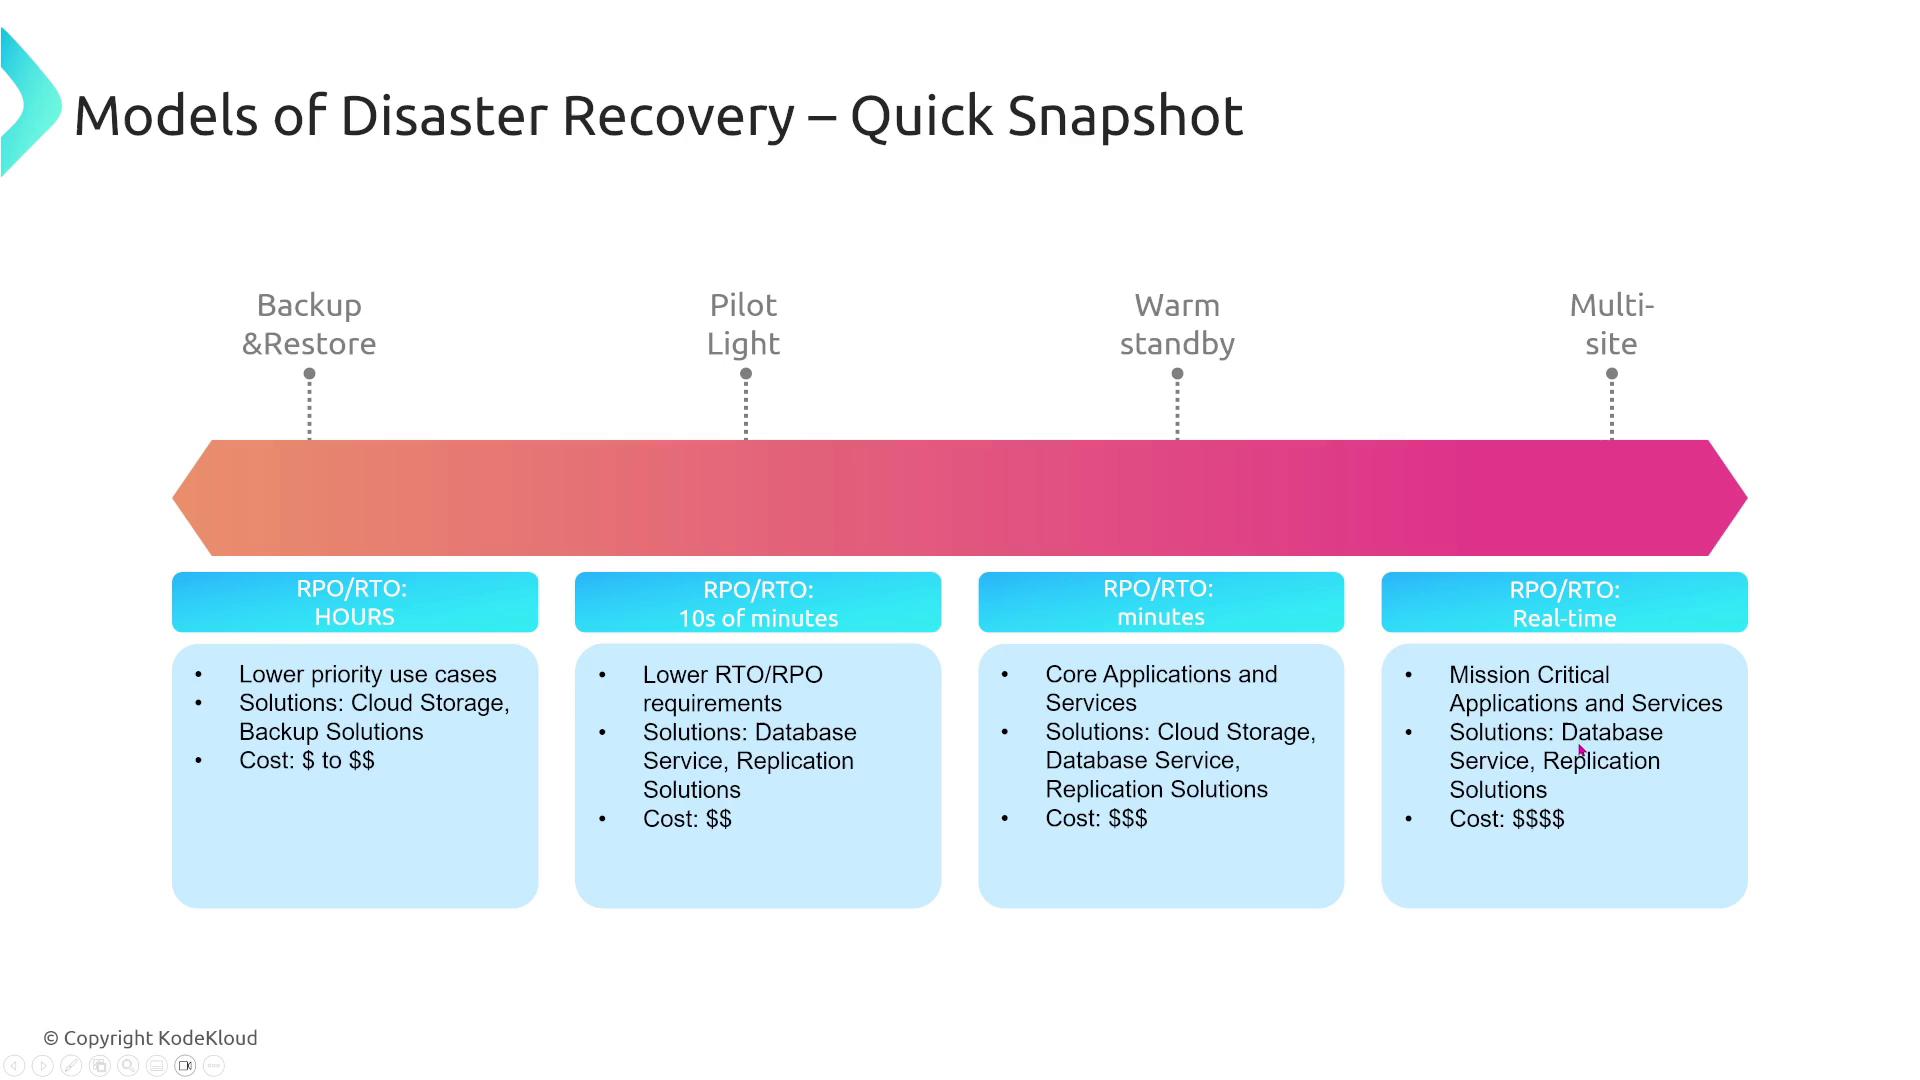
For example, if restoring a database takes four hours with hourly backups, your RPO is one hour (representing the most recent backup), but your overall RTO is four hours plus any additional time needed for service startup.AWS outlines four primary disaster recovery (DR) strategies that span from basic backup and restore to fully active-active architectures. Each model differs in RPOs, RTOs, and cost implications.
Below is an overview of the disaster recovery models arranged from the simplest to the most sophisticated:
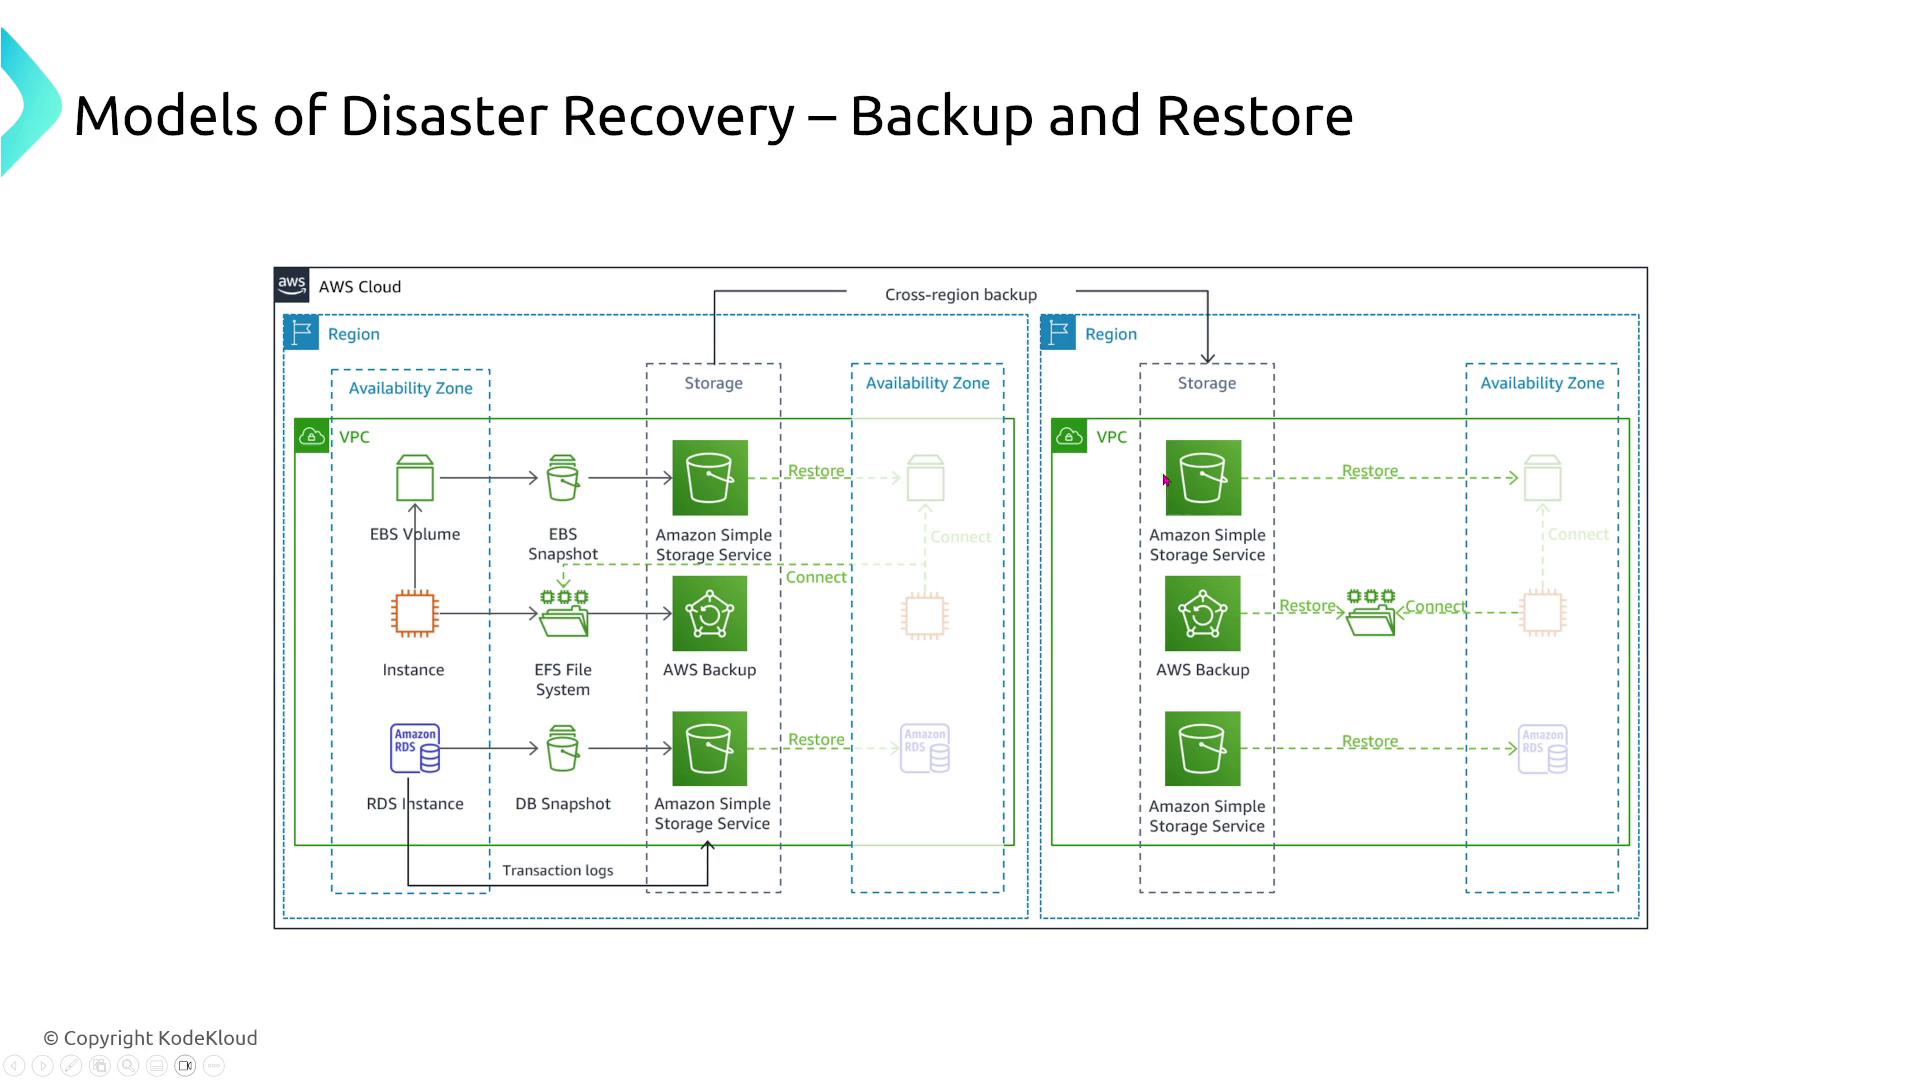
Backup and Restore
Your on-premises data is backed up and, during a disaster, restored in the cloud. While straightforward and cost-effective, this method can lead to longer downtimes.
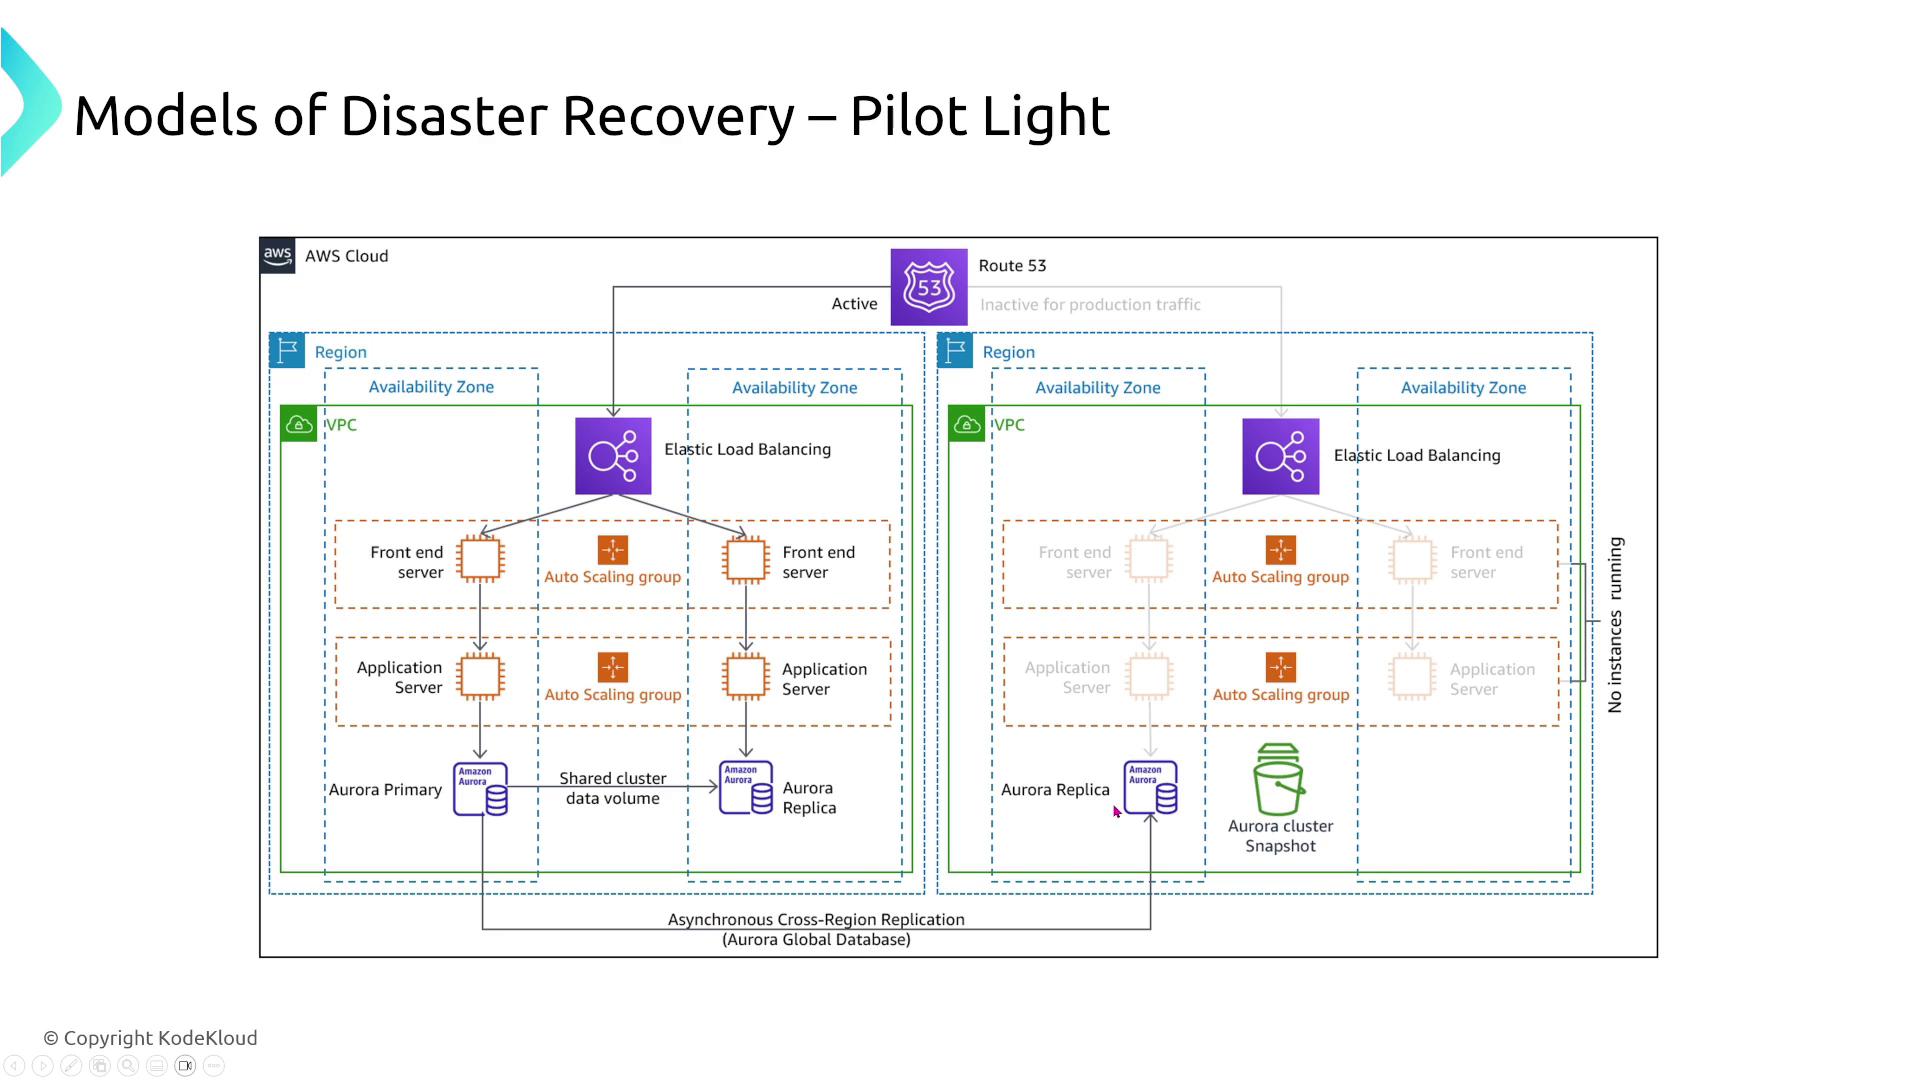
Pilot Light
This model maintains a minimal version of your environment (typically just the database) in the cloud. In the event of a disaster, you quickly scale up the remaining components (e.g., application and frontend servers). Although recovery is faster than backup and restore, the process might take tens of minutes to fully restore service.
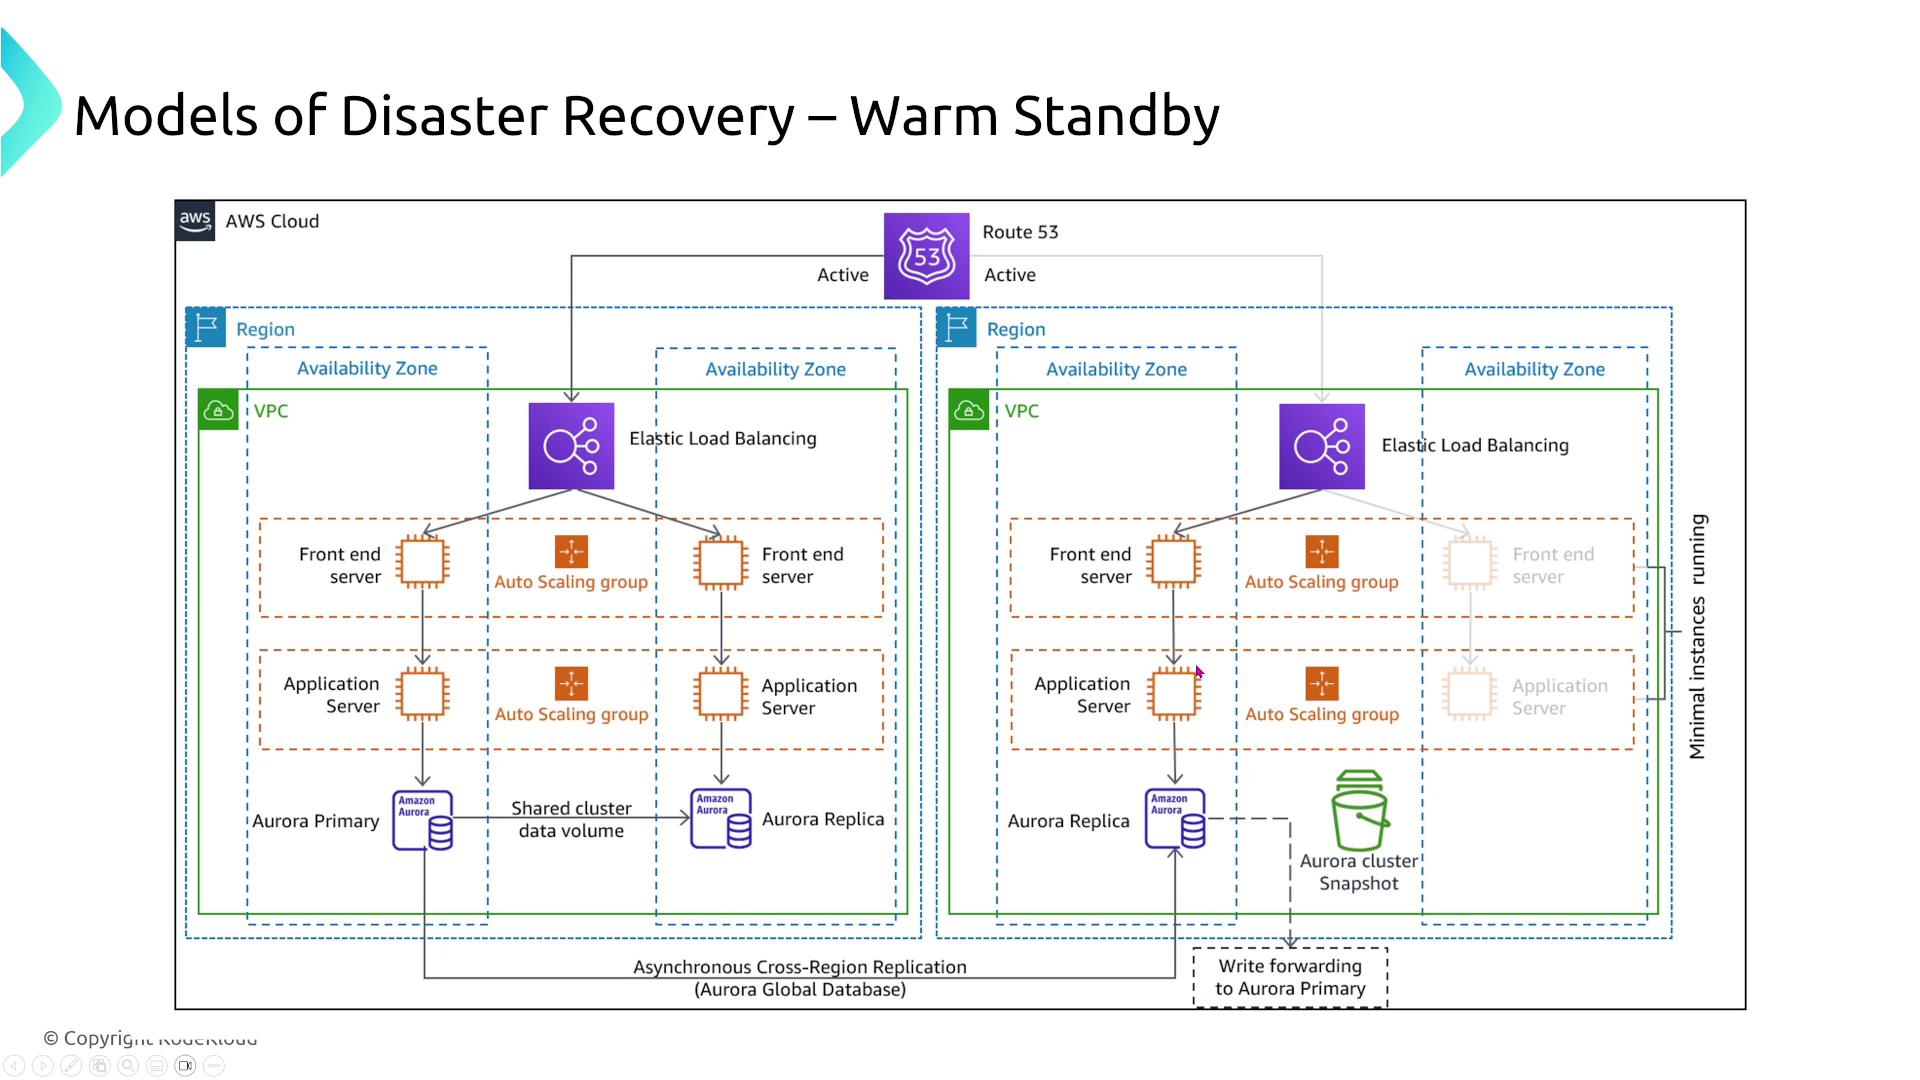
Warm Standby
In this model, a scaled-down but fully functional version of your production environment runs in the cloud, handling a small portion of production traffic. In a disaster, this standby system scales up quickly to manage full production load.
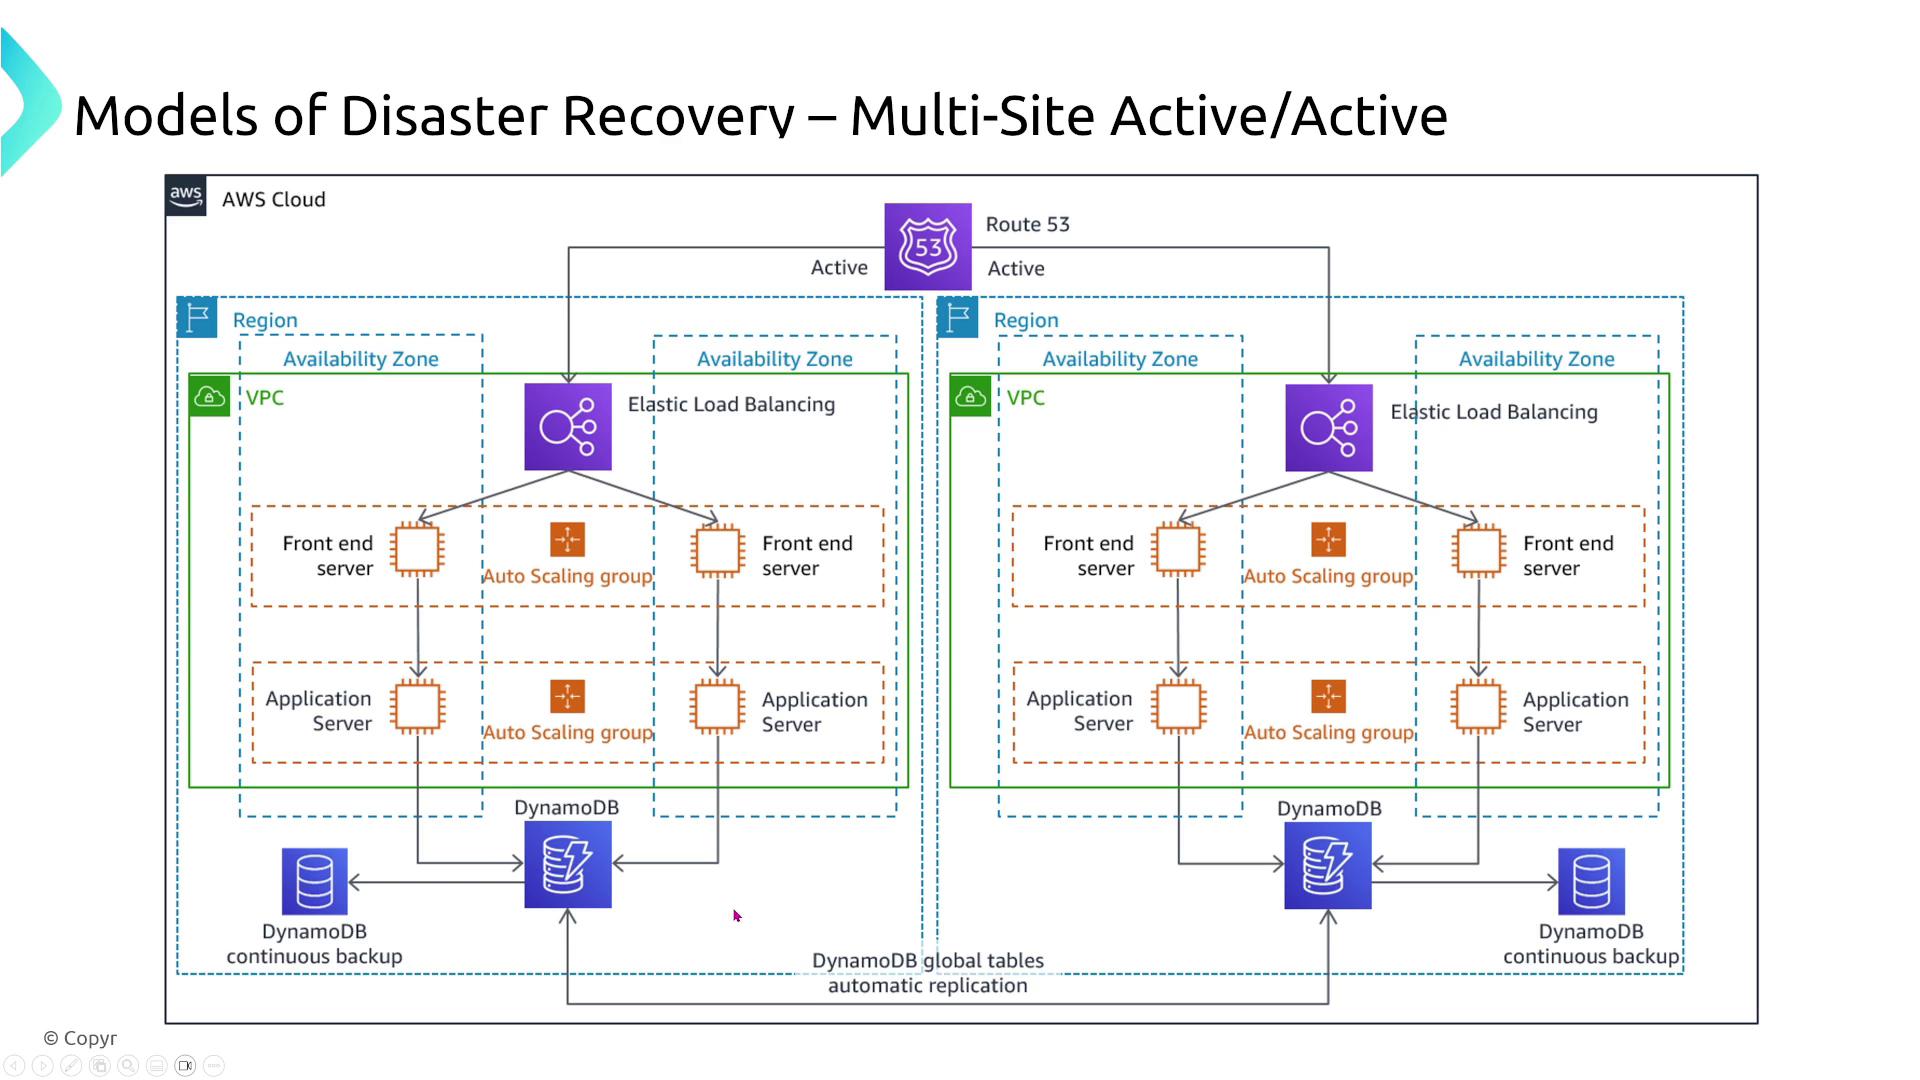
Active-Active (Multi-site)
In this strategy, traffic is distributed across two or more active sites (such as multiple regions or a hybrid of on-premises and cloud environments). If one site fails, another takes over instantly with virtually no downtime. This approach offers near-zero RPO (aside from replication delays) and minimal RTO, but it comes with increased complexity and higher costs.
Additionally, leveraging services like DynamoDB with global tables enables near real-time replication across regions, with failover handled automatically by Route 53. Regular testing of this setup is essential.
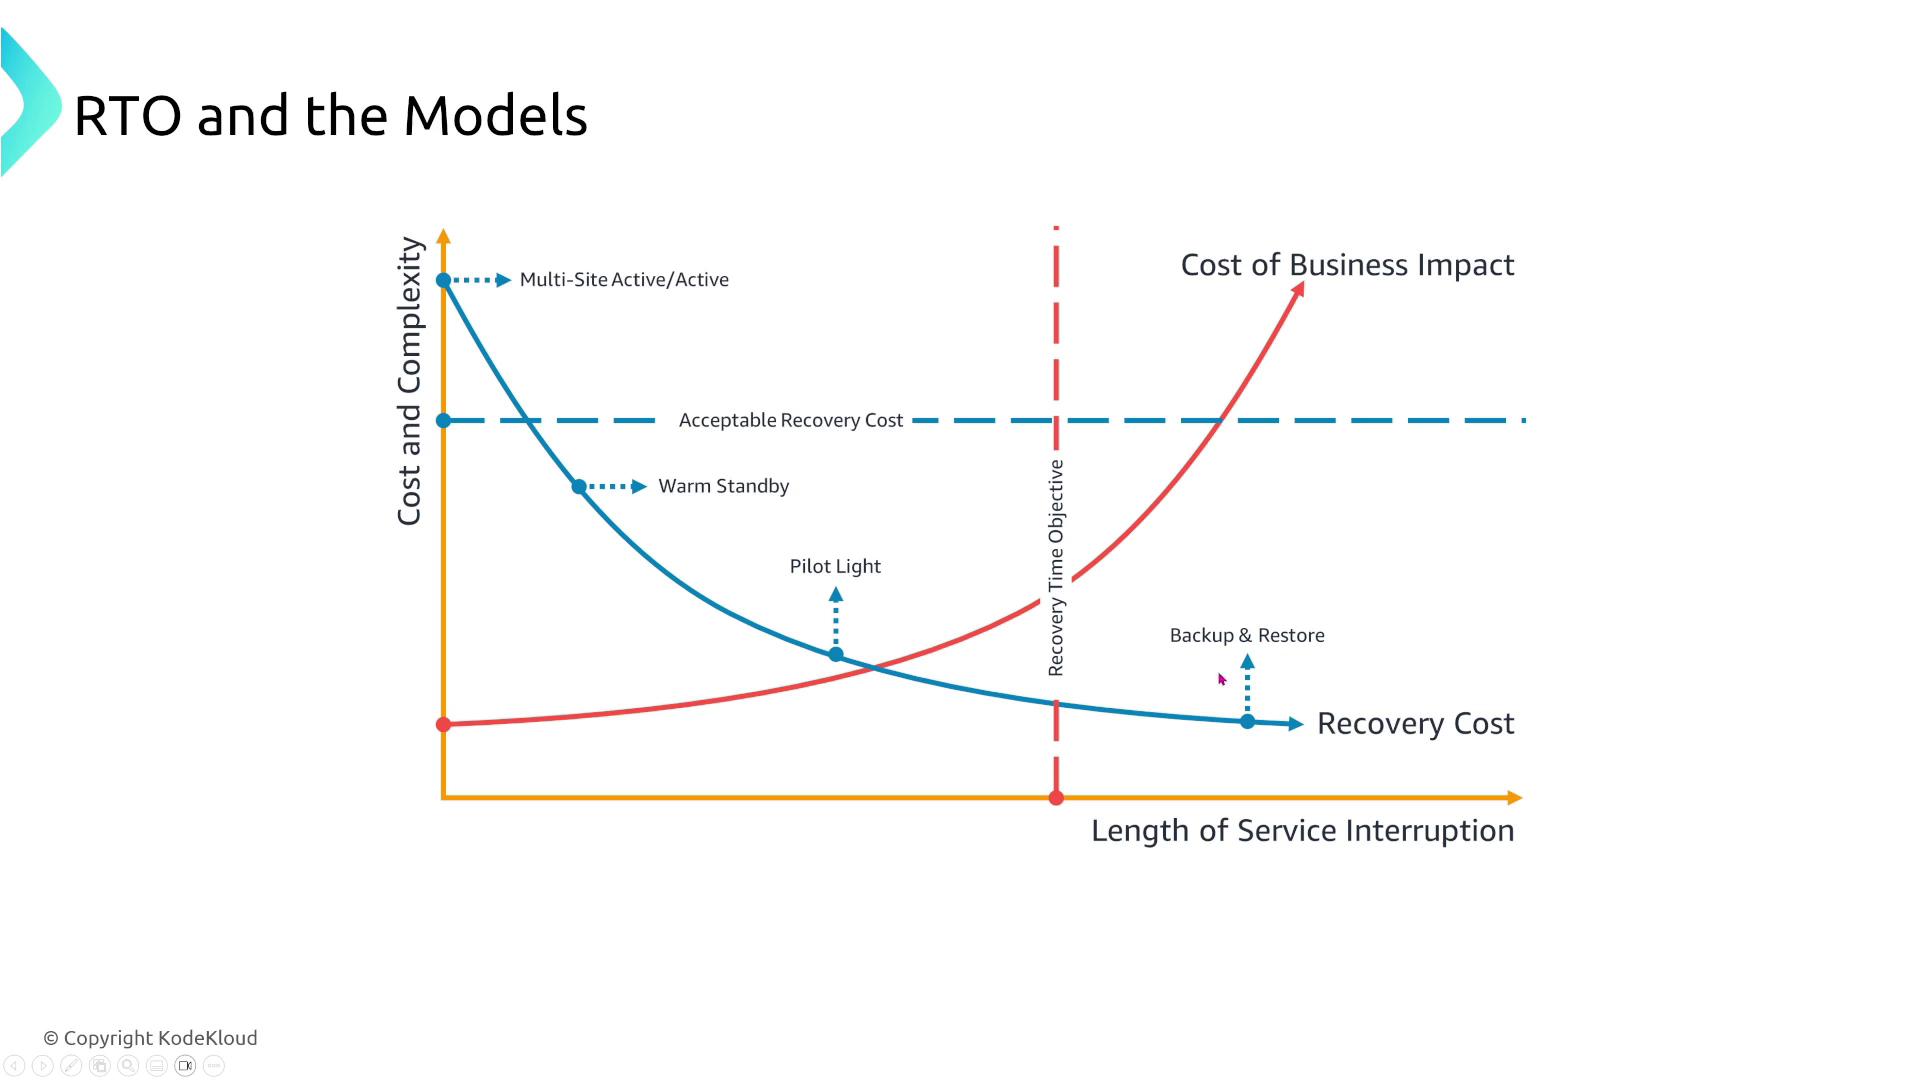
When comparing these models, consider the trade-offs between cost, complexity, recovery duration, and potential data loss. For instance, backup and restore is economical but slower, whereas active-active offers minimal downtime at a premium.
Cost and complexity are critical factors in selecting a DR strategy. Active-active may provide the fastest restoration but is the most expensive option, while backup and restore offers lower ongoing costs but increased downtime and potential data loss based on your backup frequency.
Disaster recovery planning is an essential component of your overall business continuity strategy. Balancing acceptable downtime (RTO) with acceptable data loss (RPO) while remaining within budget constraints is key. The models discussed—from backup and restore to active-active—define not only the technical approach to disaster recovery but also the associated costs and business impacts.
RTO determines the allowable downtime.
RPO determines the maximum acceptable data loss.
As you progress from backup and restore to active-active, recovery times improve while data loss minimizes—albeit at a higher cost and increased system complexity.
Your role as an architect is to balance these considerations based on acceptable risks and cost constraints. Understanding these disaster recovery models is vital not only for achieving certification but also for designing robust and resilient systems.I’m Michael Forrester. Thank you for reading, and I look forward to seeing you in the next article.