1. Agent Types and Pools in Azure Pipelines
Azure Pipelines agents execute your jobs. There are two primary types:- Microsoft-hosted agents: Preconfigured and maintained by Microsoft, but limited in customization.
- Self-hosted agents: Fully under your control—OS updates, scaling, and security are your responsibility.
Self-hosted agents offer greater flexibility but require you to handle maintenance, OS patches, and infrastructure scaling.
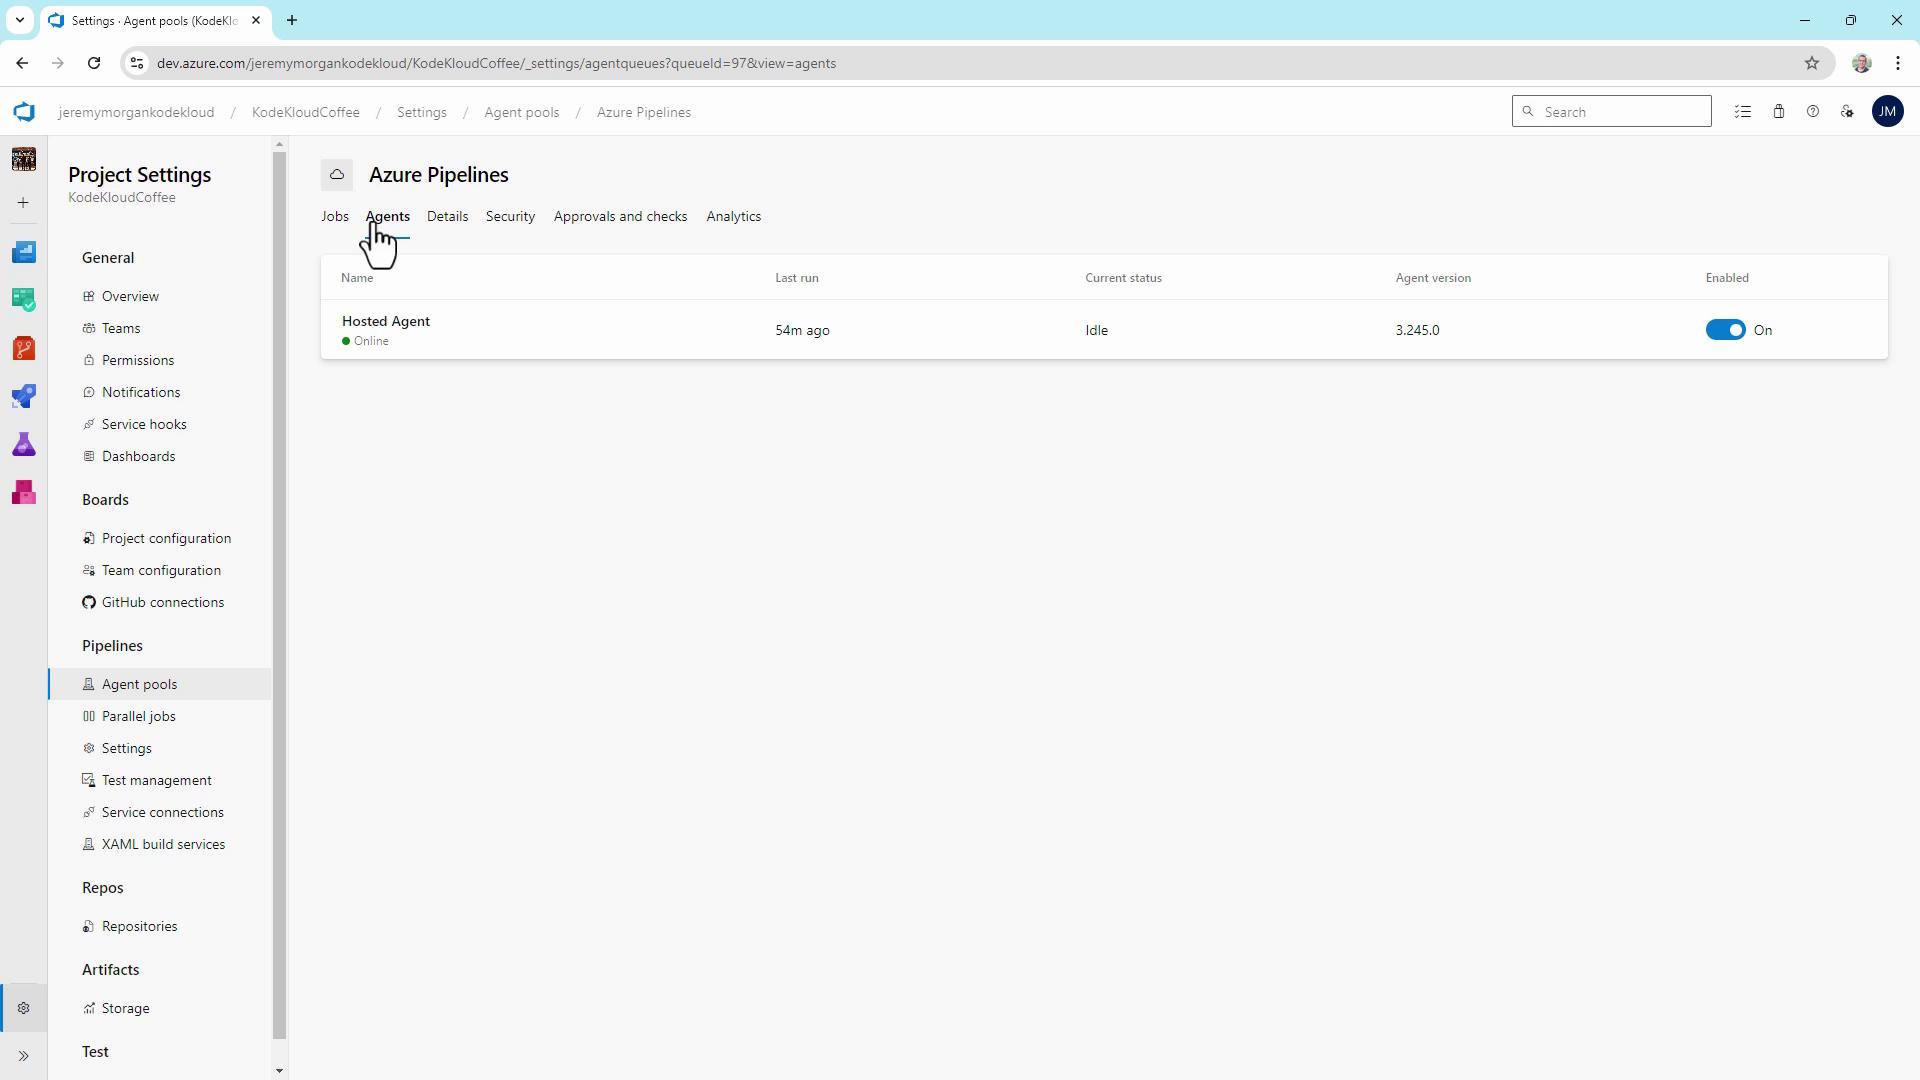
Viewing Agent Pools
- In Azure DevOps, navigate to Project Settings > Agent pools.
- Review each pool’s agents and their status (online, idle, offline).
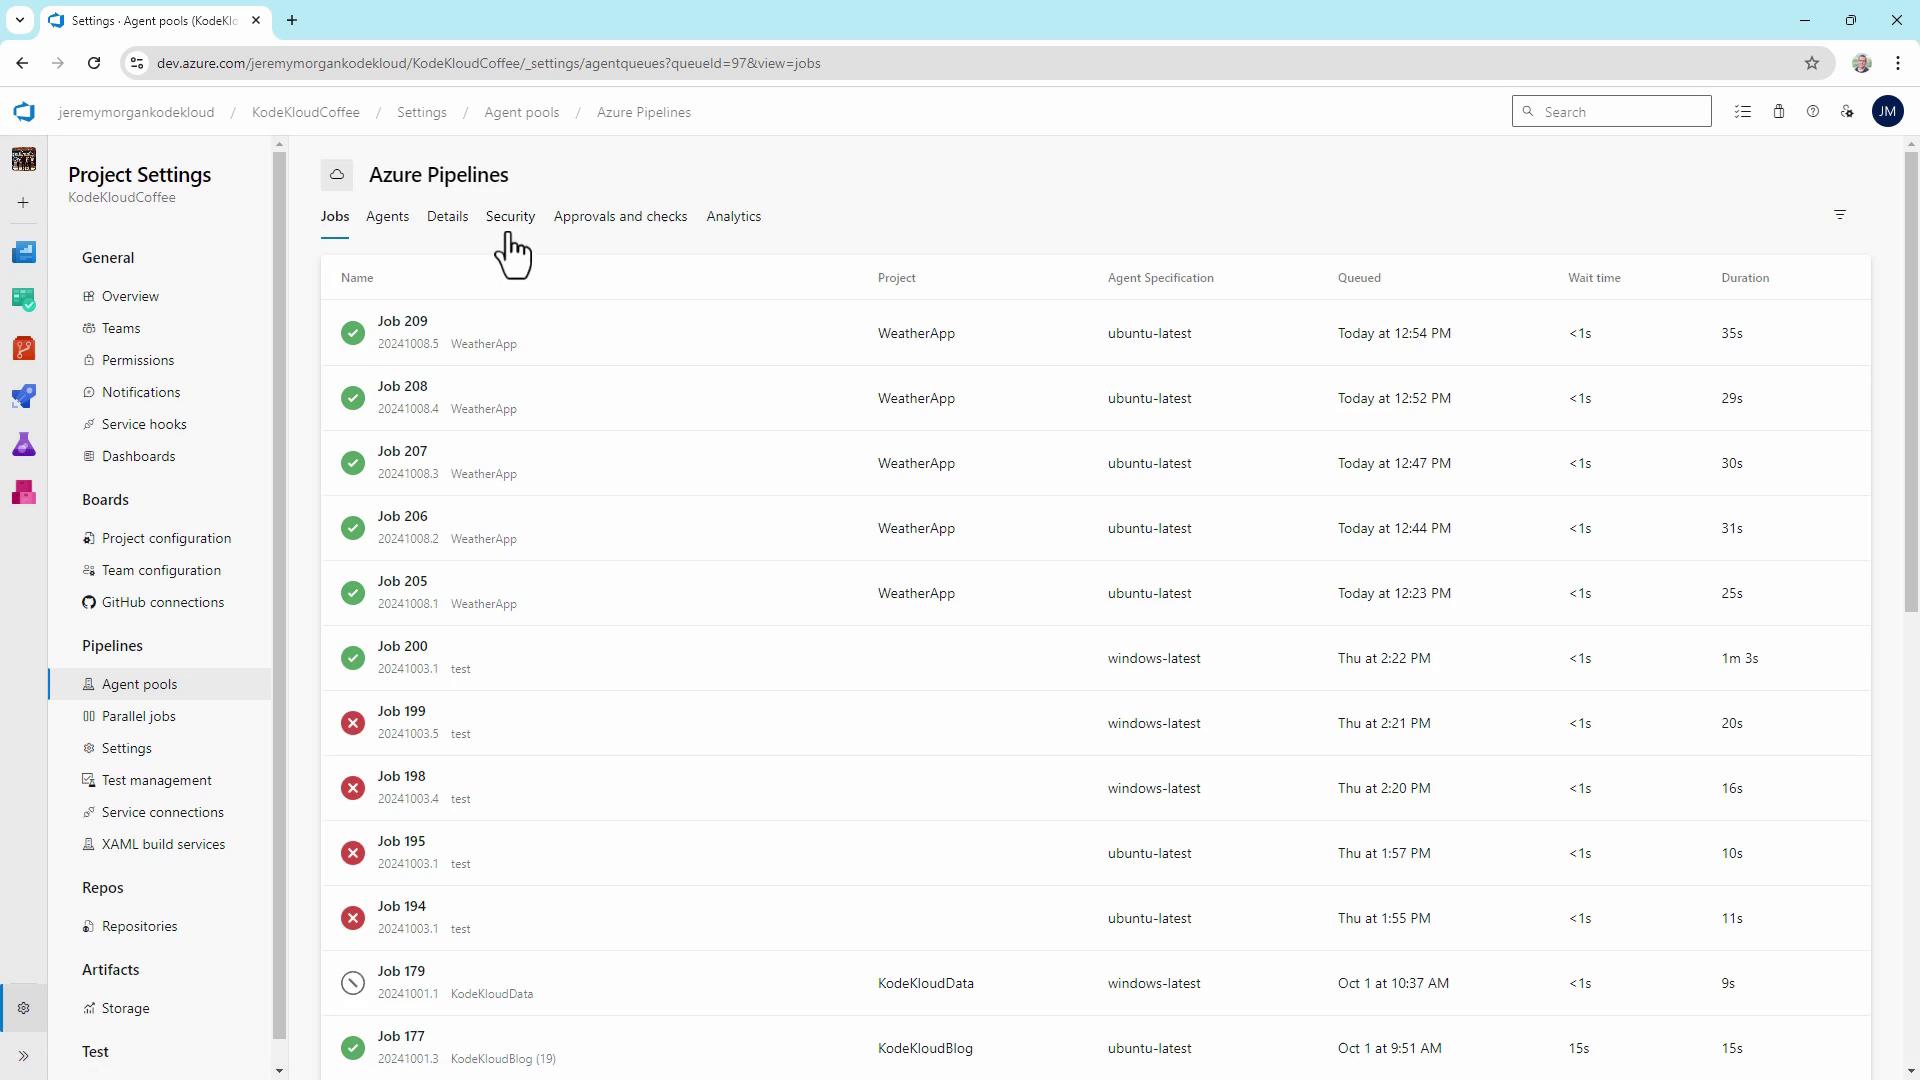
2. Analyzing Microsoft-hosted Agent Usage
To inspect Microsoft-hosted agent performance:- Go to Pipelines > Jobs.
- Examine queue time, wait time, and duration for each job.
3. Monitoring Pool Consumption and Concurrency
The Pool consumption dashboard provides insight into concurrent job usage, queued jobs, and running jobs. More concurrency reduces queue time but increases cost.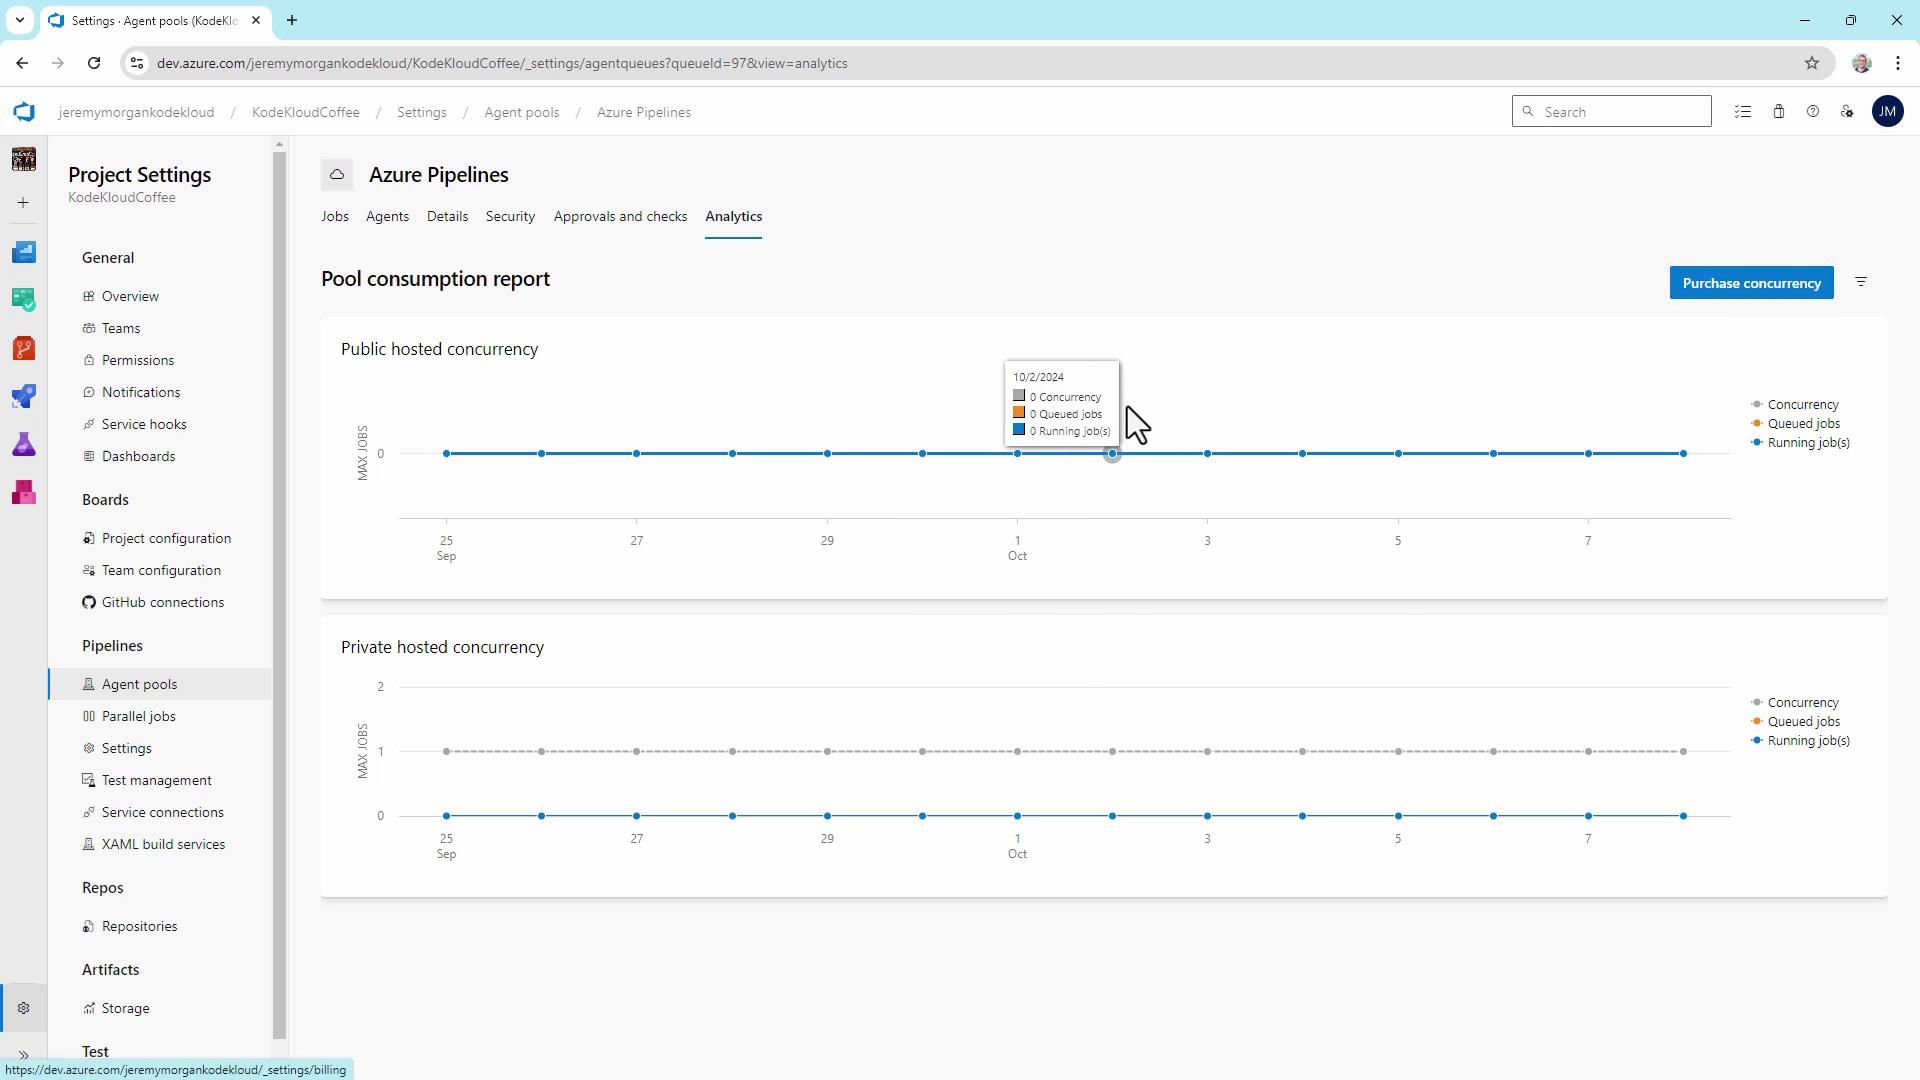
4. Using Self-hosted Agents
Under Agent pools > Default, register your own Windows, Linux, or container-based agents. These can run on-premises or in any cloud subscription, giving you full control over VM size and software dependencies.5. Key Pipeline Performance Metrics
Track these metrics to right-size your agents and pipelines:| Metric | Definition | Benefit |
|---|---|---|
| Queue time | Time a job waits before an agent picks it up | Spot peak-load bottlenecks |
| Job execution time | Duration from job start to completion | Identify slow build or test steps |
| Parallel builds | Number of jobs running simultaneously | Optimize agent utilization |
6. Viewing Pipeline Analytics
Navigate to Pipelines > [Your Pipeline] > Analytics for:- Pipeline Pass Rate
- Test Pass Rate
- Pipeline Duration
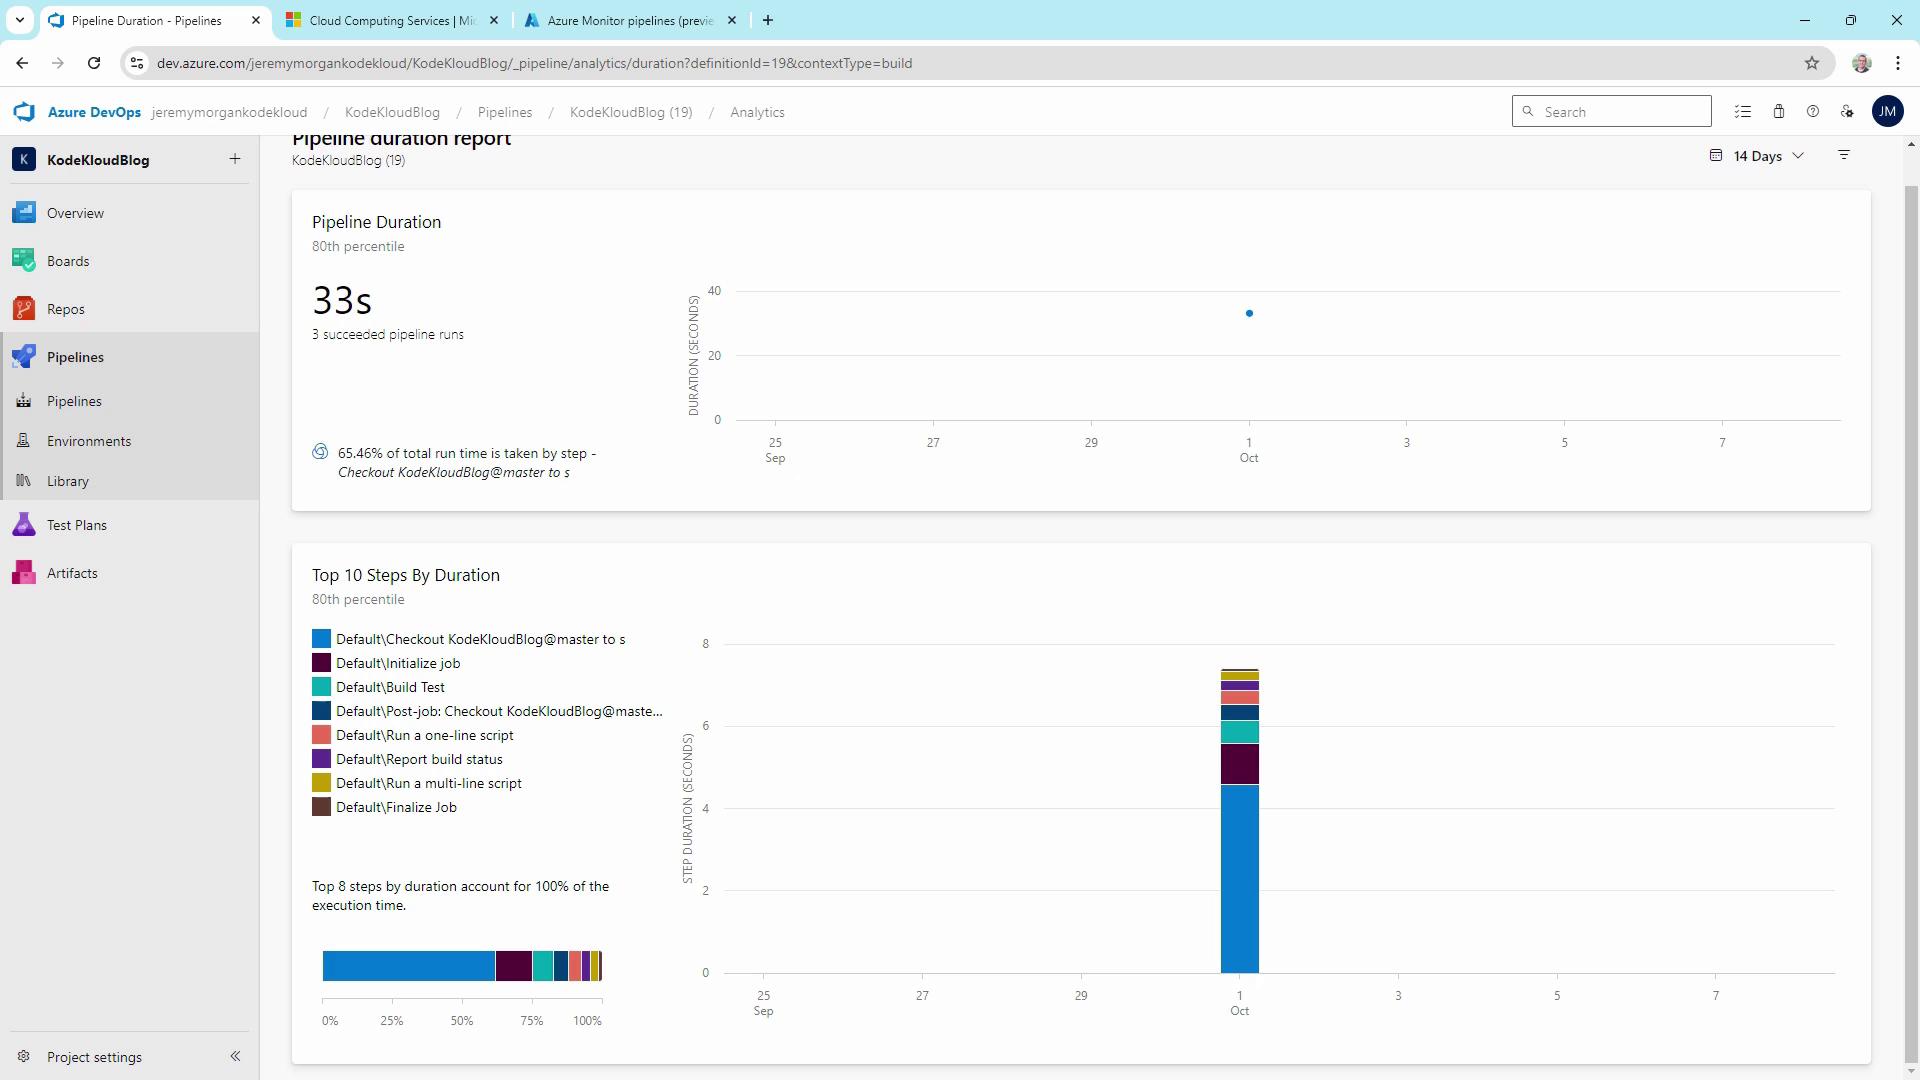
7. Comparing Pipeline Step Durations
Compare multiple pipelines to spot heavy tasks like VSTest or VSBuild.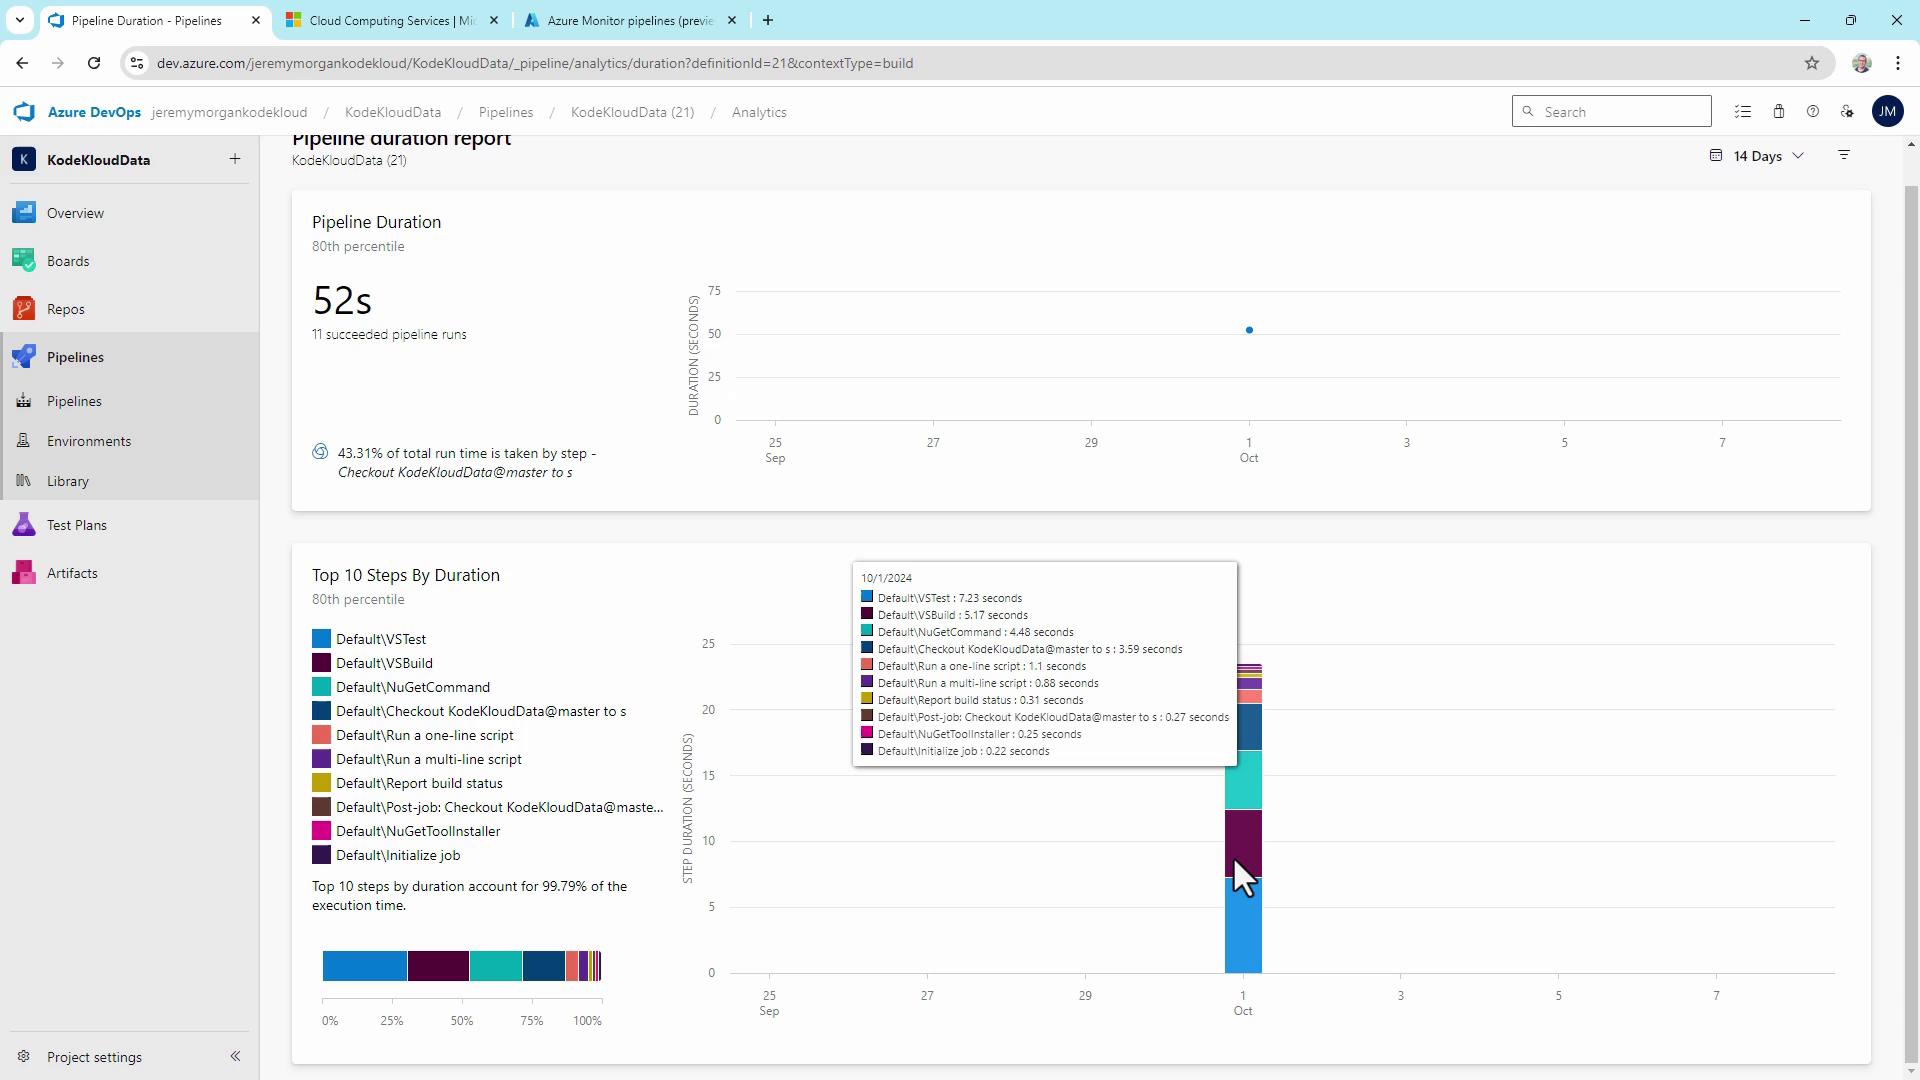
8. Managing Parallel Jobs and Capacity
Under Project Settings > Parallel jobs, view your subscription’s limits:| Tier | Parallel jobs | Free minutes/month | Notes |
|---|---|---|---|
| Free | 1 | 1,800 | Suited for individual developers |
| Paid | Up to 10+ | Unlimited | Scale with purchased concurrency |
| Self-hosted | Unlimited | N/A | Only limited by your hardware |
Hitting your parallel job or minute quota will pause pipeline execution. Plan upgrades or add self-hosted agents proactively.
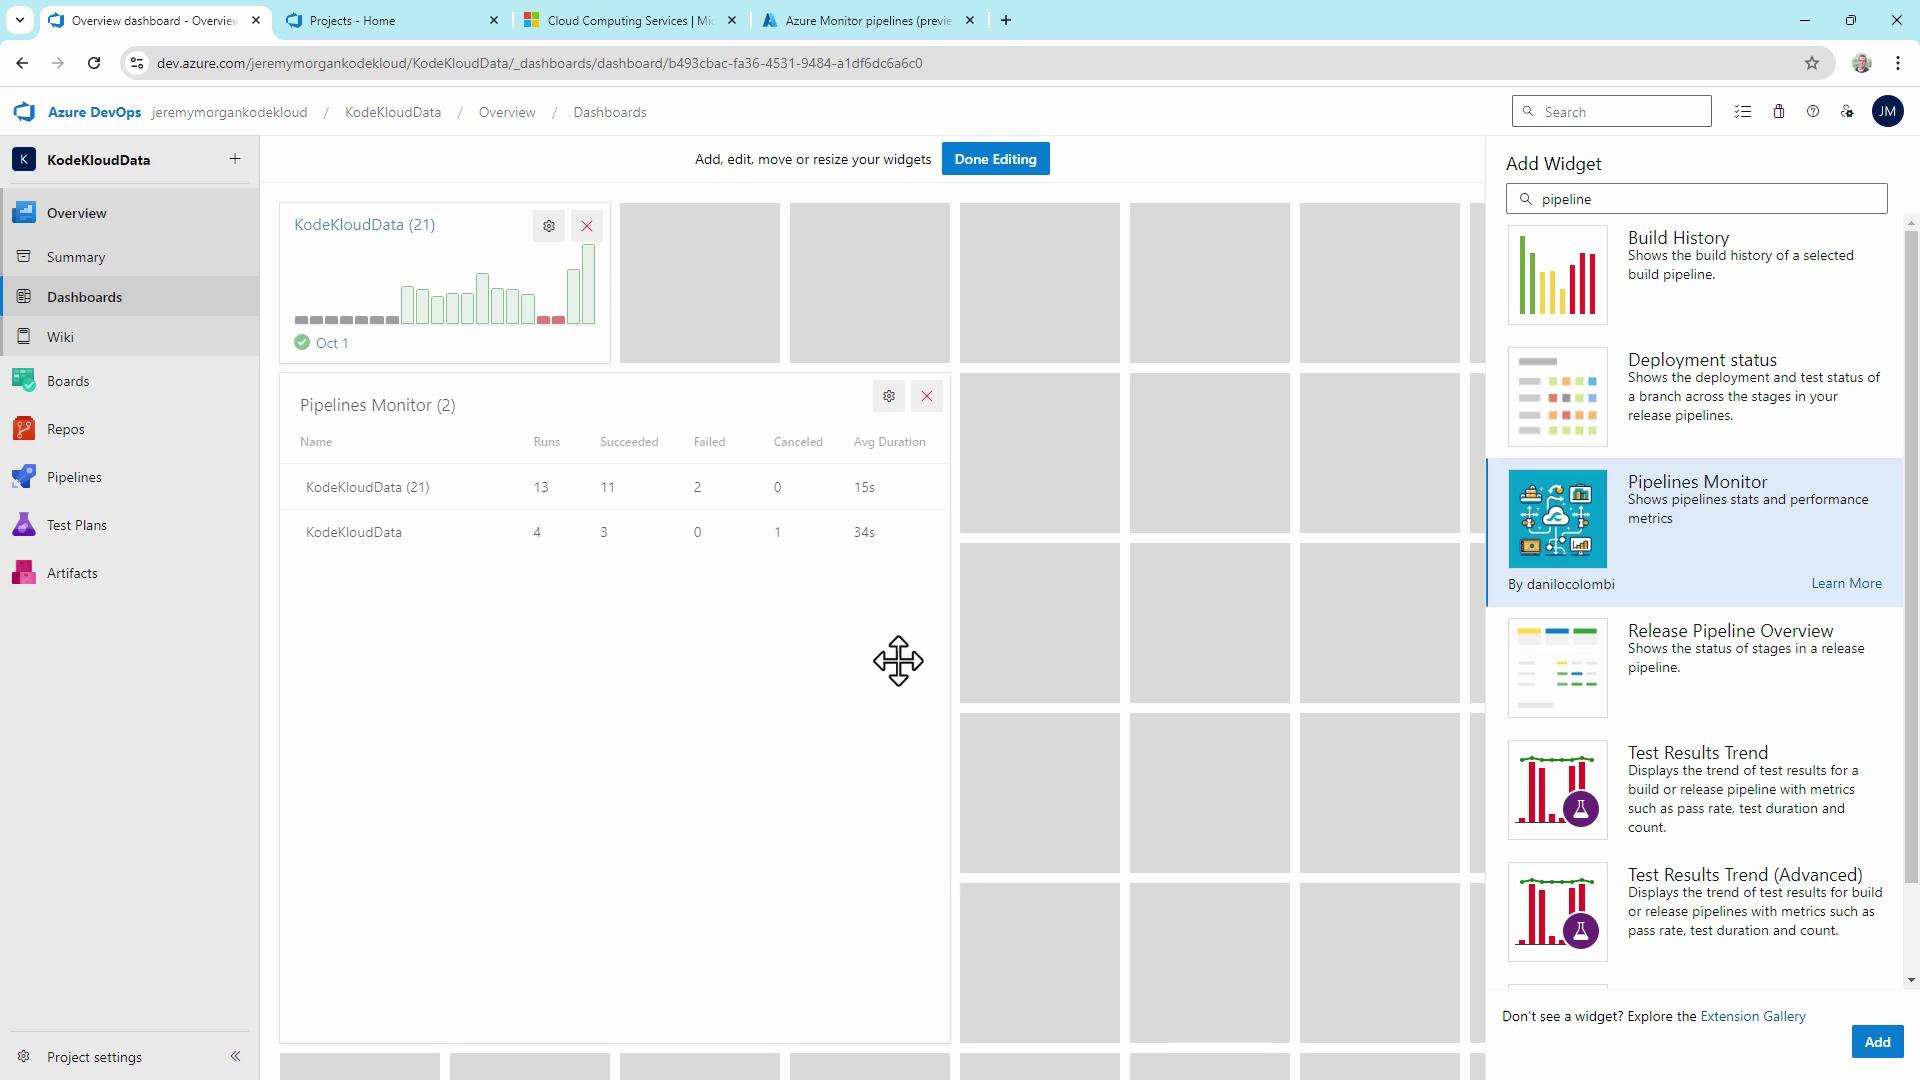
9. Custom Dashboards and Widgets
Aggregate metrics on a single pane:- Go to Overview > Dashboards.
- Click Add widget, search for “Pipeline.”
- Add Build History, Release Pipeline Overview, or community widgets from the Extension Marketplace.
10. Integrating with Azure Log Analytics
For advanced telemetry, stream pipeline logs to an Azure Log Analytics workspace. Query build and release metrics over time for root-cause analysis.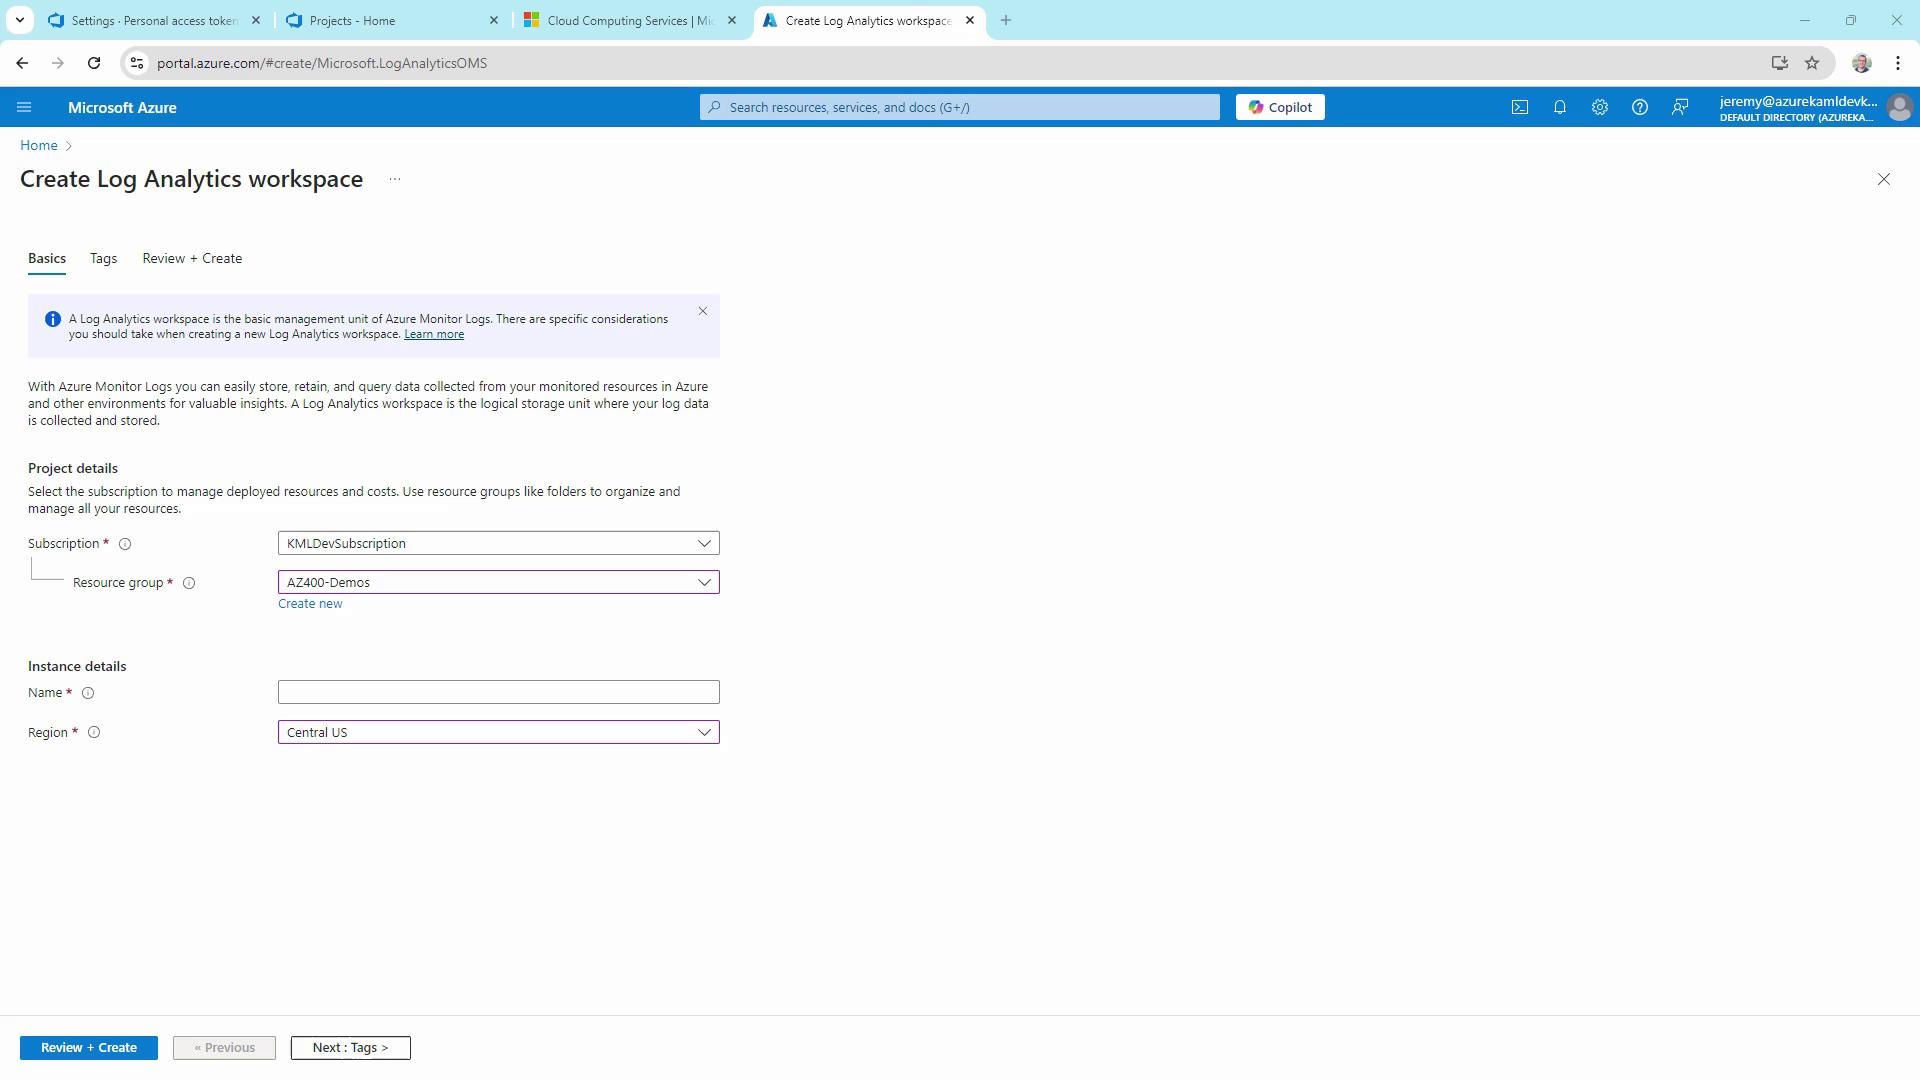
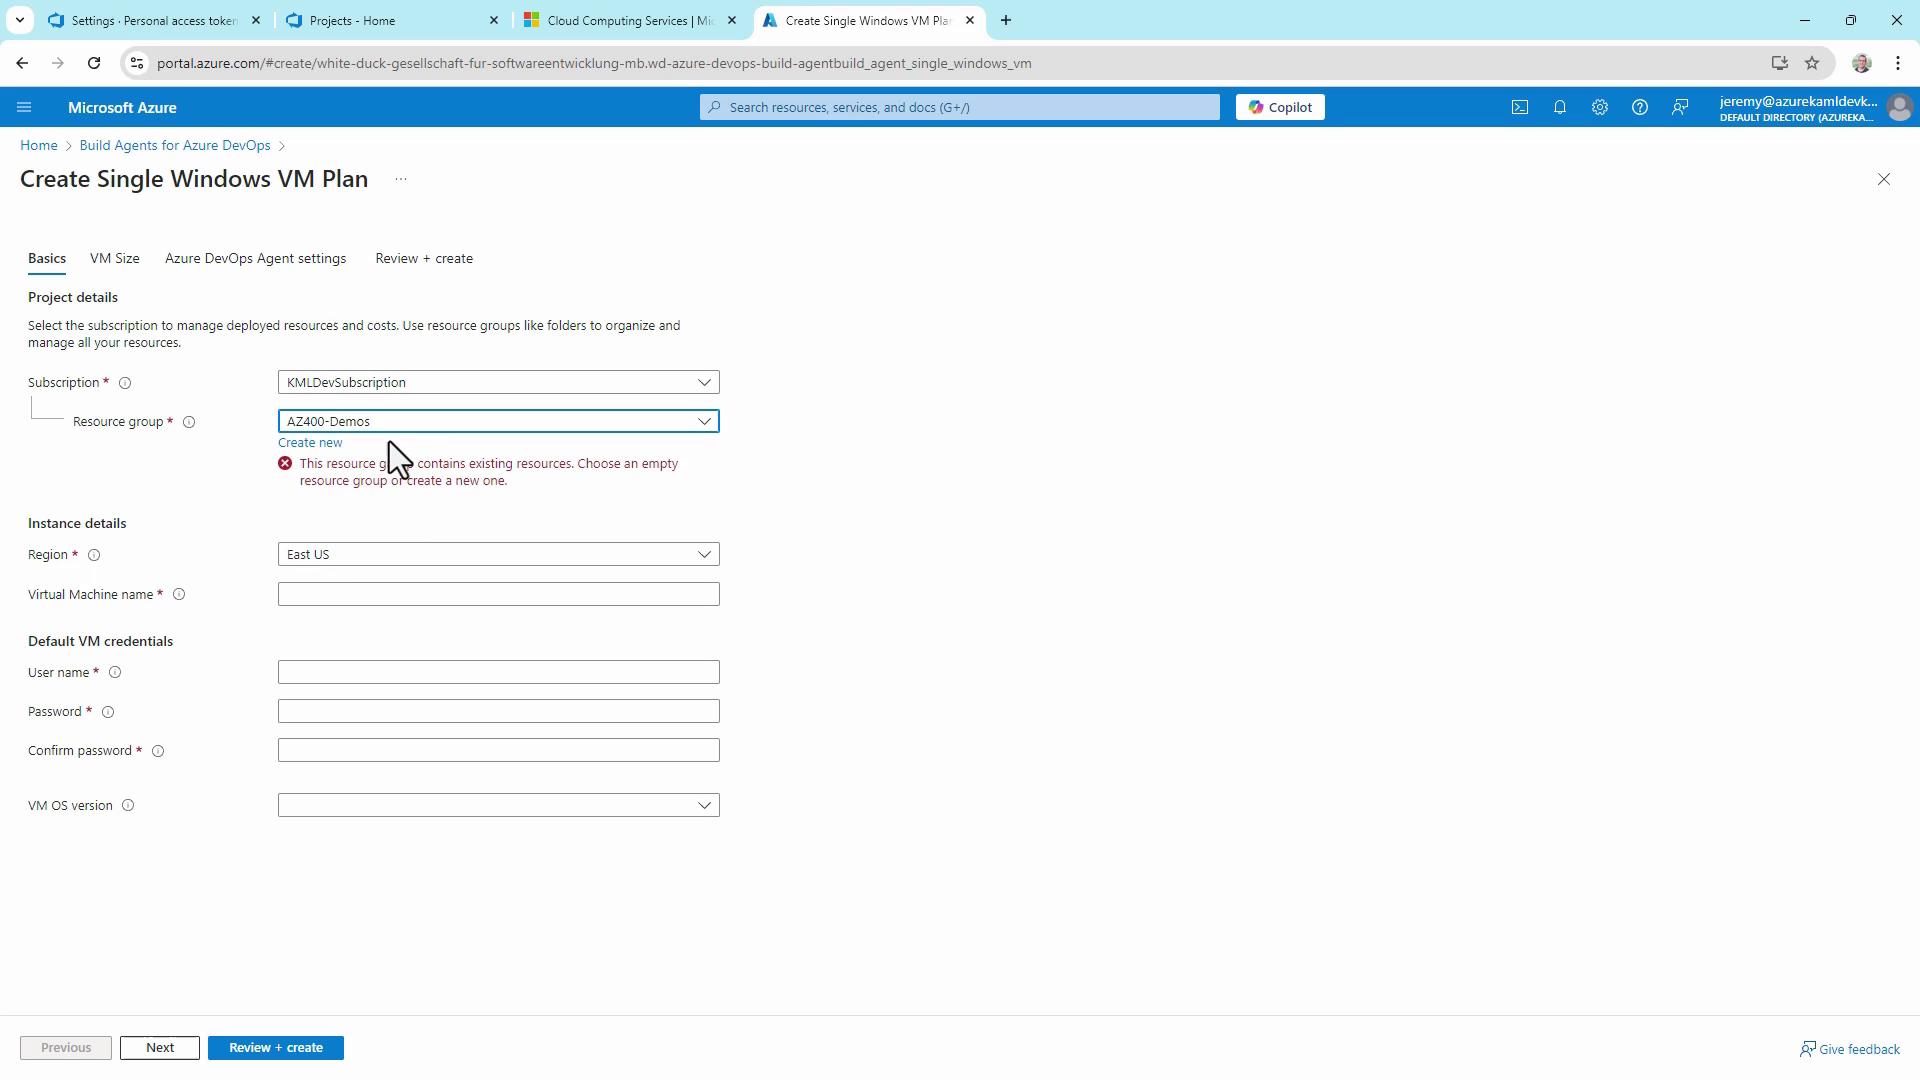
11. Provisioning Additional Build Agents
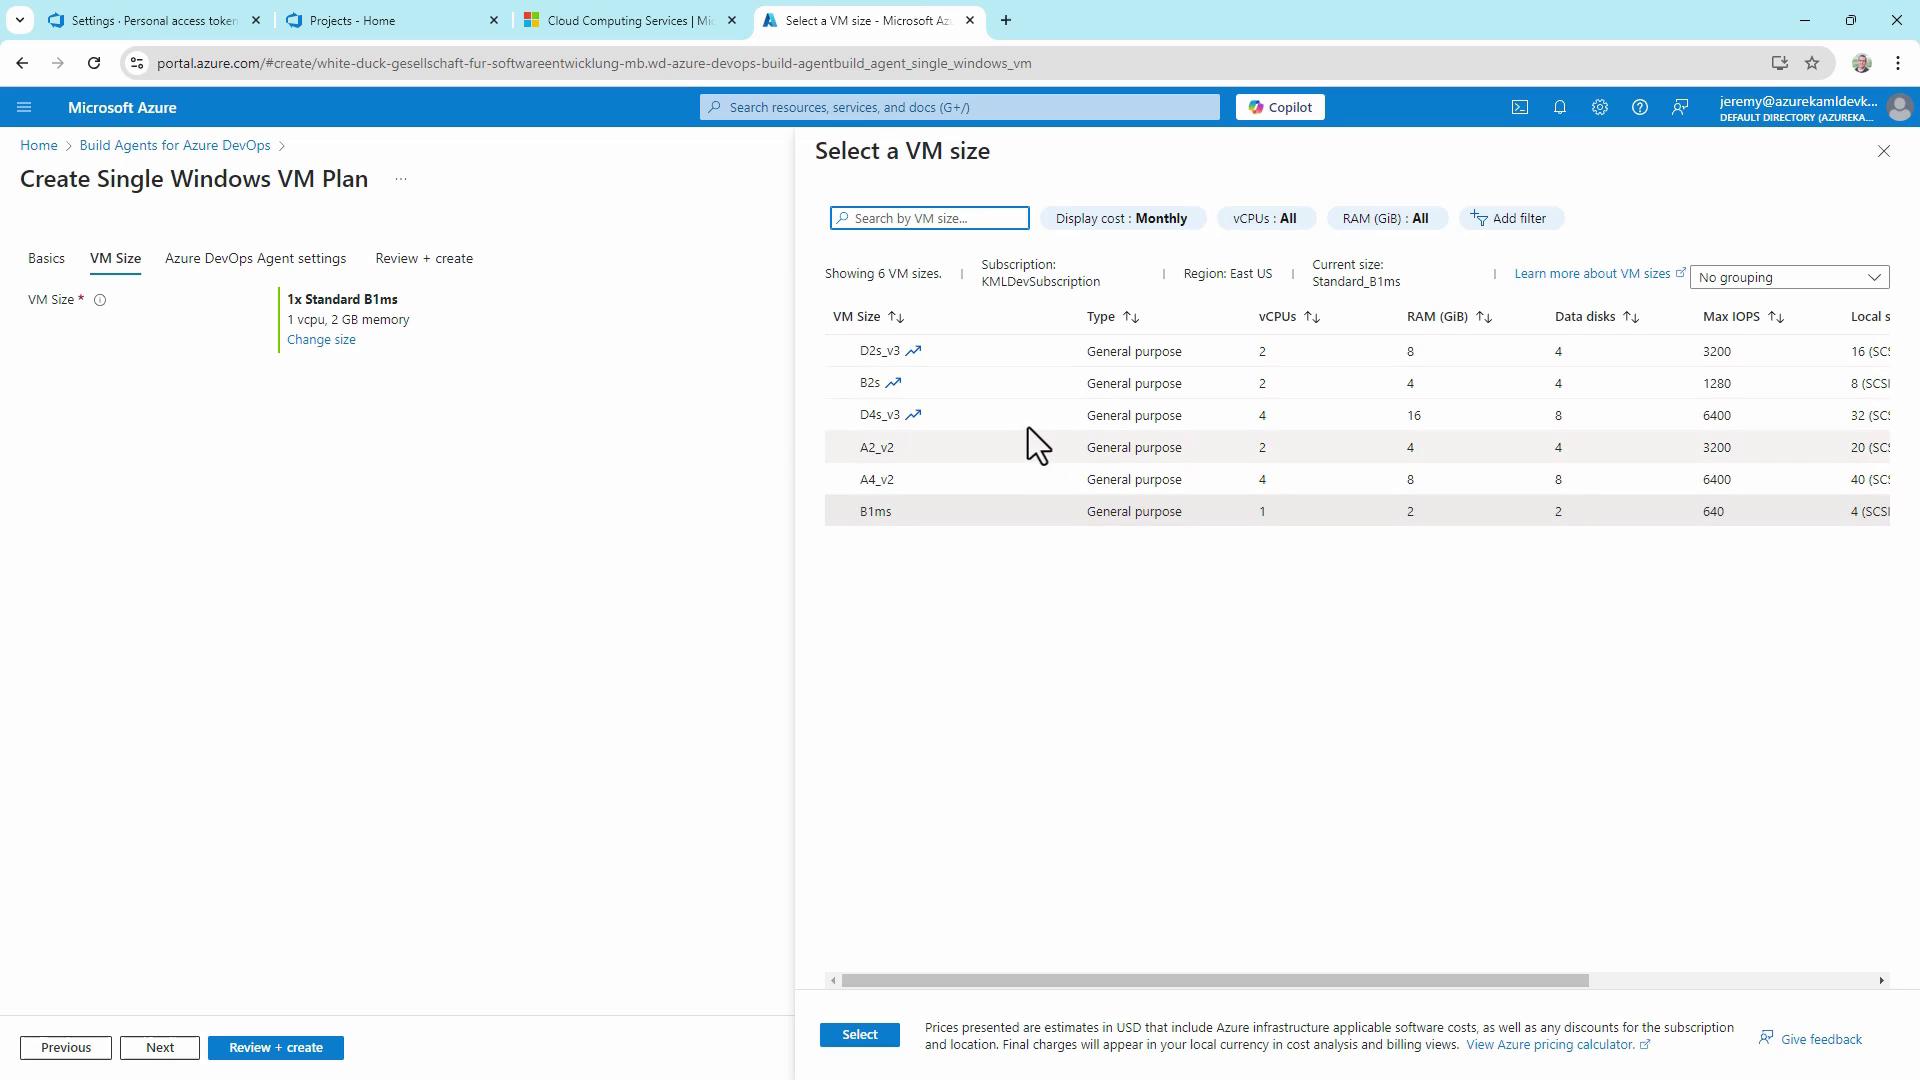
To scale quickly, install the Build Agents for Azure DevOps solution from the Azure Marketplace. It automates VM provisioning and agent registration:- Select your subscription, resource group, and region.
- Choose VM size (vCPUs, RAM).
- Deploy and connect to your agent pool.