

- Rename conflicting fields to avoid ambiguity when merging datasets.
- Merge datasets (orders, products, customers) into a single, analyzable table.
- Compute derived metrics (line totals) and produce aggregation summaries (top products/customers).

- Working in a Jupyter Notebook or similar environment.
- pandas installed: https://pandas.pydata.org/
- Data files loaded or available in a
datafolder.
- It’s Oct 1 and September orders have arrived in your data folder. To answer:
- Top 3 products by revenue — requires orders + products.
- Top 3 customers by spend — requires orders + products + customers.
- Goal: produce a single orders table with
customer_idandproduct_idreplaced by human-readablecustomer_nameandproduct_name, plus aline_totalcolumn computed asquantity × price.
- Locate incoming files and consult the ingest log to prevent duplicate processing.
- Clean raw orders (drop invalid rows, fix date formats) and save the cleaned output.
- Rename conflicting columns in reference tables (products, customers).
- Merge product and customer reference data into cleaned orders.
- Compute
line_totaland create aggregation summaries for reporting.
- Start by ensuring your folder structure exists and check whether the orders file was already ingested. This prevents duplicate processing and accidental reprocessing.
- When merging lookup/reference tables into fact tables, shared column names like
namecan cause overwrites or confusing duplicated columns. Rename these fields in reference tables first.
Rename columns early (e.g.,
name → product_name / customer_name) so merges produce predictable columns and you avoid accidental overwrites.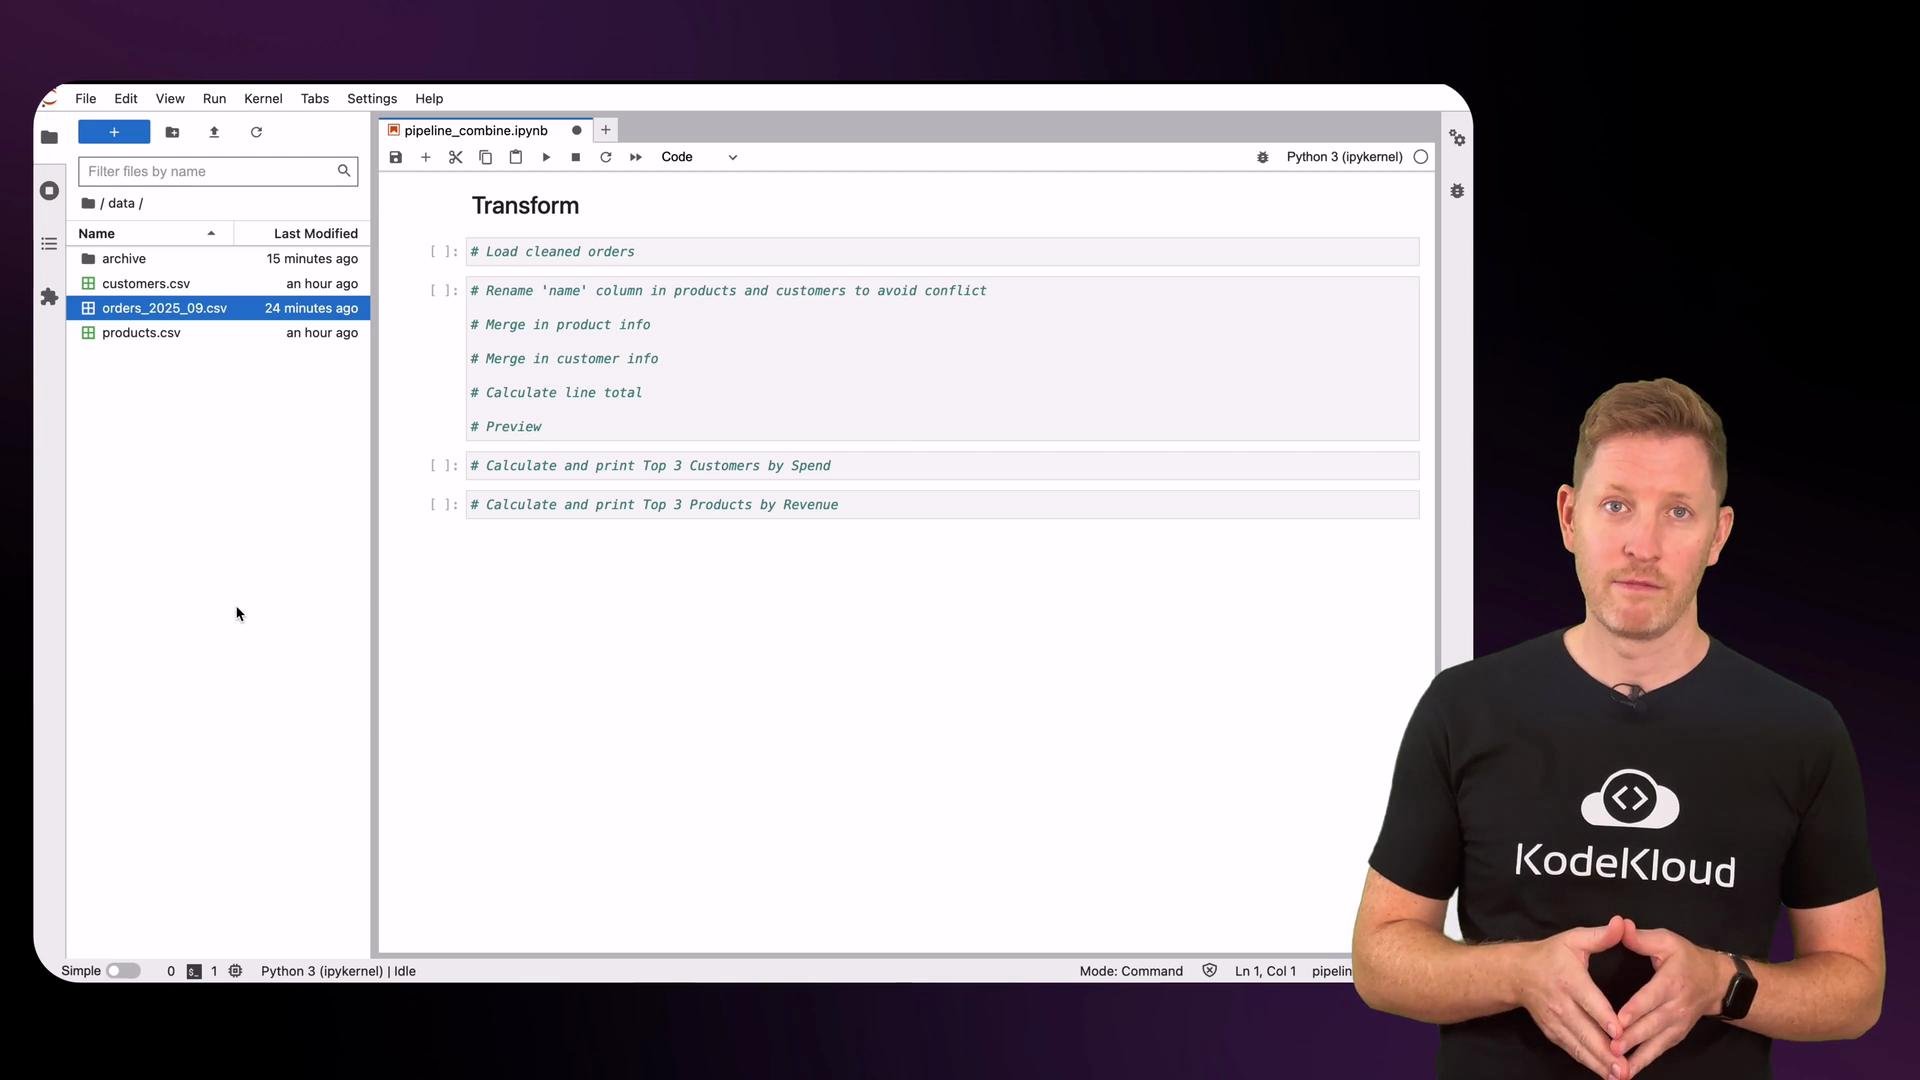
- Remove rows with invalid
customer_idorproduct_id, record dropped rows for auditing, and save the cleaned orders file. This pattern preserves traceability and keeps your downstream joins reliable.
- Keep a consistent naming pattern to make downstream analysis and dashboards easier to read.
Merge, compute, and preview
- Merge reference data into the cleaned orders with left joins so you retain all order rows and attach product and customer attributes. Then compute a
line_totalcolumn.
- Use groupby + sum to compute total revenue by product and total spend by customer, then sort and select the top 3.
- Rename fields early to avoid column name collisions when joining data.
- Use left joins to retain all orders while bringing in reference data.
- Validate foreign keys (customer_id, product_id) and record dropped rows for traceability.
- Use grouping and aggregation to summarize revenue and spend for reporting or visualization.
- Keep consistent column naming across your pipeline for maintainability.
Always check the ingest log and archive processed files to prevent duplicate ingestions and ensure idempotent pipelines.
- Hands-on practice: run this workflow on a sample month of orders and verify the audit trail (dropped rows, ingest log).
- Extend: add date-based rollups (daily/monthly revenue), or create a dashboard-ready summary table.
- pandas documentation
- Jupyter
- For more on data validation and pipeline design, consult platform-specific guides (Airflow, Prefect) and your organization’s ETL standards.