

Connecting to the Nodes
Start by opening separate terminal sessions for node-1 and node-2. Connect to the nodes using your preferred method. For example, you might use the following command:Examining the Application and Log File
On node-1, navigate to the application directory where your Node.js application is running. The application writes its logs to a file calledapp.log, located in the same directory as index.js.
cat or tail command:
Verifying Log Output
Below is an example of log entries generated on node-2:Updating the Promtail Configuration
Before updating Promtail’s configuration, stop the running Promtail instance on node-1 by pressingCtrl-C. Then, review the current Promtail configuration file:
/home/vagrant/app/app.log), add a new scrape job for these logs. Update the configuration as shown below:
You can add additional labels under the
labels section (for example, env: production) to help refine log queries in Grafana.Applying the Configuration on Node-1 and Node-2
On node-1, ensure you are in the correct directory before editing the configuration:nano):
Restarting Promtail
After updating the configuration on both nodes, restart Promtail. On node-2, execute:Ensure the startup logs display no errors. Look for messages indicating that Promtail is reloading the configuration and listening on the designated HTTP and gRPC ports.
Viewing Logs in Grafana
After Promtail is running on both nodes, access your Grafana instance and open the Explore interface. To filter the API logs, run the following query: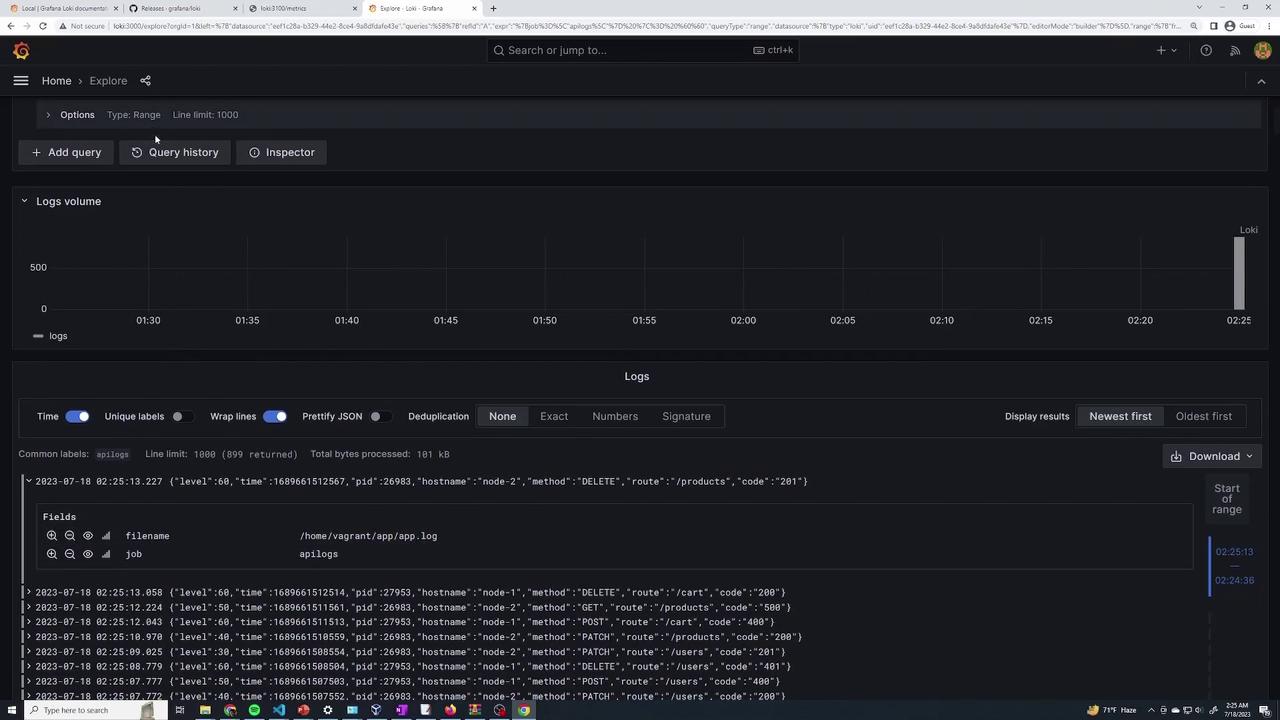
By following these steps, you have successfully configured Promtail on multiple nodes to collect log files from both system directories and your application directory. This setup makes monitoring and troubleshooting your API logs through Grafana an efficient process.