

Configuring Log Collection
Begin by creating a file namedapp-deployment.yaml to define both the log collection settings and the deployment configuration for your application. Add the following Promtail snippet to configure how log labels are applied and where Promtail should locate log files from Kubernetes pods:
This configuration directs Promtail on how to label and locate Kubernetes pod log files effectively.
Deploying the Application
Next, add the deployment configuration to the same file. The YAML snippet below describes a standard Kubernetes Deployment for an API application. This deployment uses thekodekloud/loki-demo image from Docker Hub—a demo container that generates random logs to help verify log collection via Loki.
app-deployment.yaml file.
Applying the Configuration
Deploy the new application using the following command:Ensure that all pods are up and running before proceeding to verify the logs.
Verifying Logs in Grafana
To confirm that your API pod’s logs are being captured, open Grafana and navigate to the query interface. Follow these steps:- Select the
podfield from the available options. - Clear any current selections if necessary.
- Find and click on your API pod to execute the query.
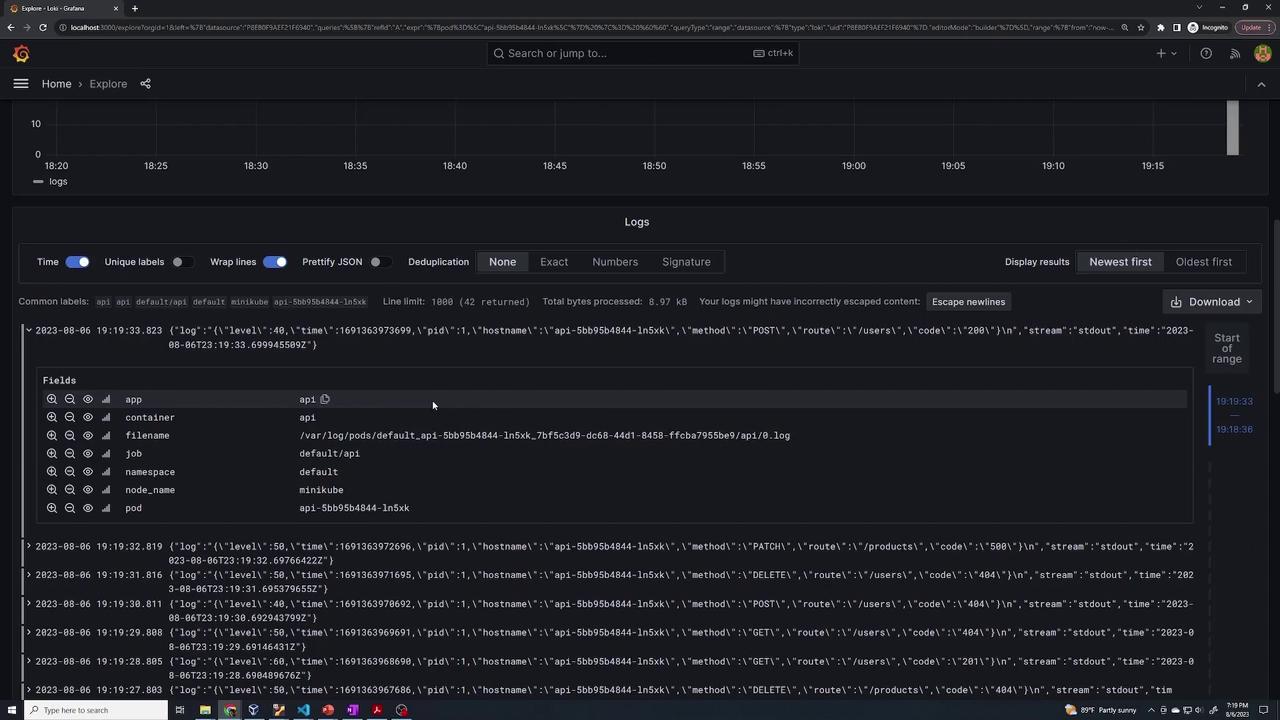
Promtail automatically collects these logs and sends them to Loki without requiring any additional configuration.