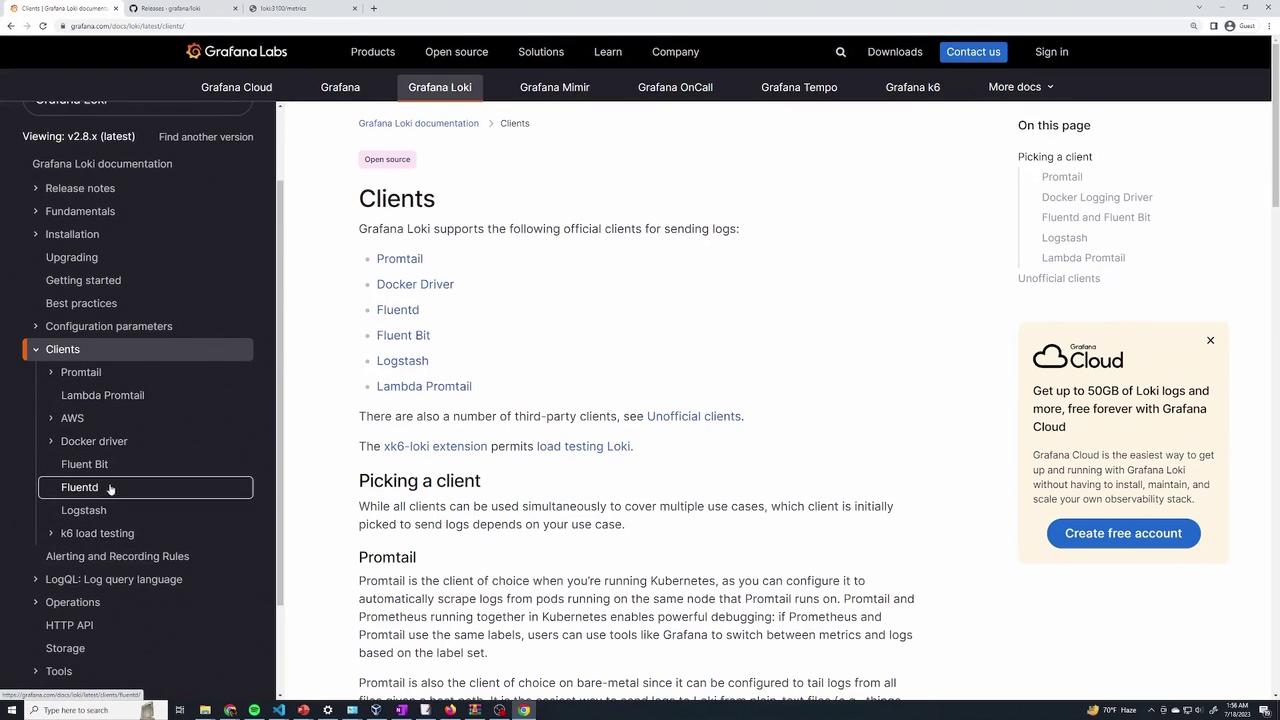
In this guide, we assume your Loki server is already running. Now it’s time to set up Promtail—the dedicated log collection agent—to forward logs from your nodes (node one and node two) to your Loki instance. Begin by exploring the documentation under the Clients section. Here, you will discover several supported clients such as Promtail, Fluent Bit, Fluentd, and Logstash. For this lesson, our focus is on Promtail.
The image shows a webpage from Grafana Labs documentation, specifically about Grafana Loki clients for sending logs, with a navigation menu on the left and a Grafana Cloud advertisement on the right.
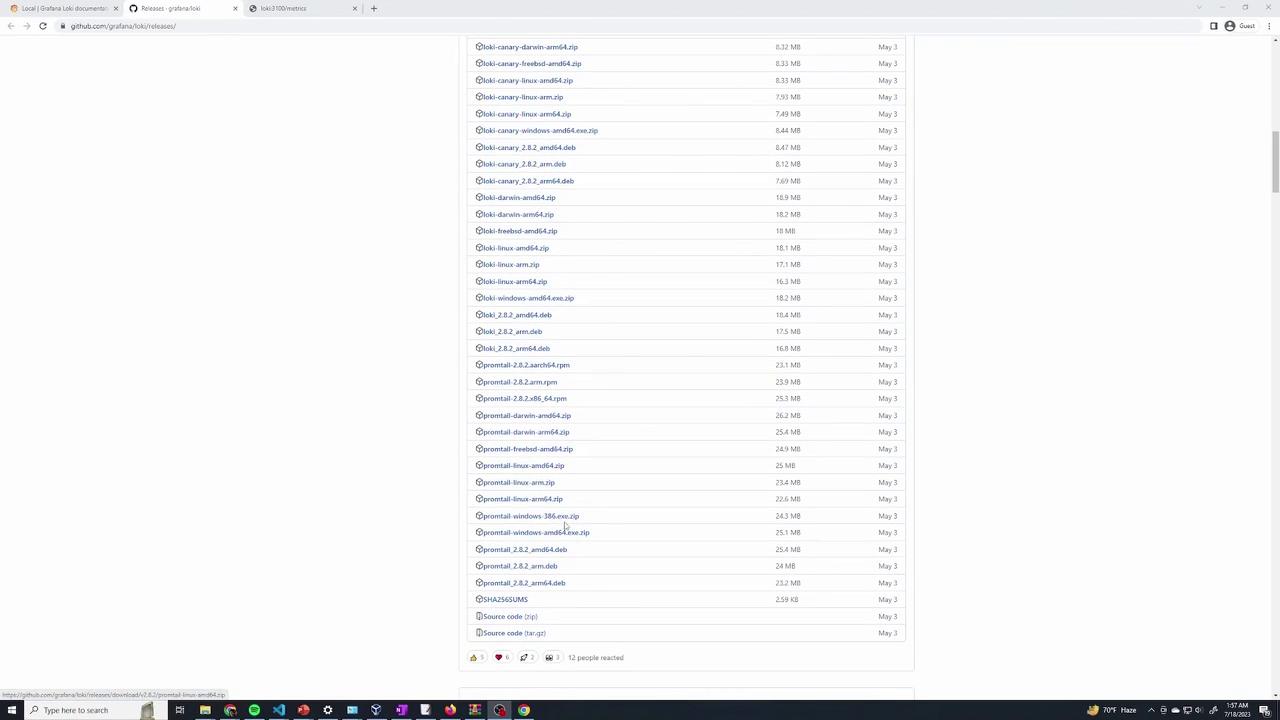
The documentation offers various example configurations (Docker, Helm on Kubernetes, etc.). However, we are interested in downloading a precompiled binary that corresponds to your system architecture (e.g., Promtail Linux AMD64).
The image shows a GitHub releases page for Grafana Loki, listing various downloadable files with their sizes and release dates.

Downloading and Unpacking Promtail

Follow these steps on each node to download and extract the Promtail binary:

On Node One

  1. Download the Promtail zip file using wget:
  2. List the directory to verify the download:
  3. Unzip the downloaded file:
  4. Verify the extraction:

On Node Two

Repeat the download and extraction process:
  1. Download the Promtail zip file:
  2. Verify the download with a directory listing:
  3. Extract the archive:
  4. Confirm the extraction:
If you encounter an error on node two regarding the absence of the unzip command, install it using:
Then, rerun the unzip command.

Obtaining the Promtail Configuration File

Promtail requires a configuration file to determine how logs are collected and where to send them. Follow these steps on your node:
  1. Download the example configuration file from GitHub:
  2. Open the configuration file for review:
A typical configuration looks like this:

Customizing the Configuration

Review the key sections of the configuration:
  • Server: Sets Promtail’s HTTP listening port.
  • Positions: Specifies the file to store the last read positions of logs.
  • Clients: Defines the Loki server endpoint. Change localhost to the actual IP address or hostname of your Loki server.
  • Scrape Configs: Determines which log files are monitored. In the example, all files in /var/log ending with "log" are collected.
For example, after updating with your Loki server’s IP address, your configuration might be:
You can add more scrape jobs as needed to monitor and label additional log files.

Running Promtail

To start Promtail using your configuration file, execute the following command on each node. Make sure you are in the directory containing both the Promtail binary and the configuration file.
  1. Run Promtail:
You should see output indicating that Promtail has started, similar to this:
If Promtail fails to access certain log files due to permission issues (common for system logs), run Promtail with sudo:
Here’s an example snippet of Promtail output confirming that log files like /var/log/kern.log and /var/log/syslog are being tailed:
This output confirms that Promtail is correctly reading and forwarding logs to your Loki server.

Conclusion

Once Promtail is installed and configured on both nodes, your logs will be continuously collected and pushed to your Loki server for centralized monitoring and analysis. For additional configuration options and troubleshooting tips, refer to the Grafana Loki Documentation.

Watch Video