| Metric Category | Key Metrics |
|---|---|
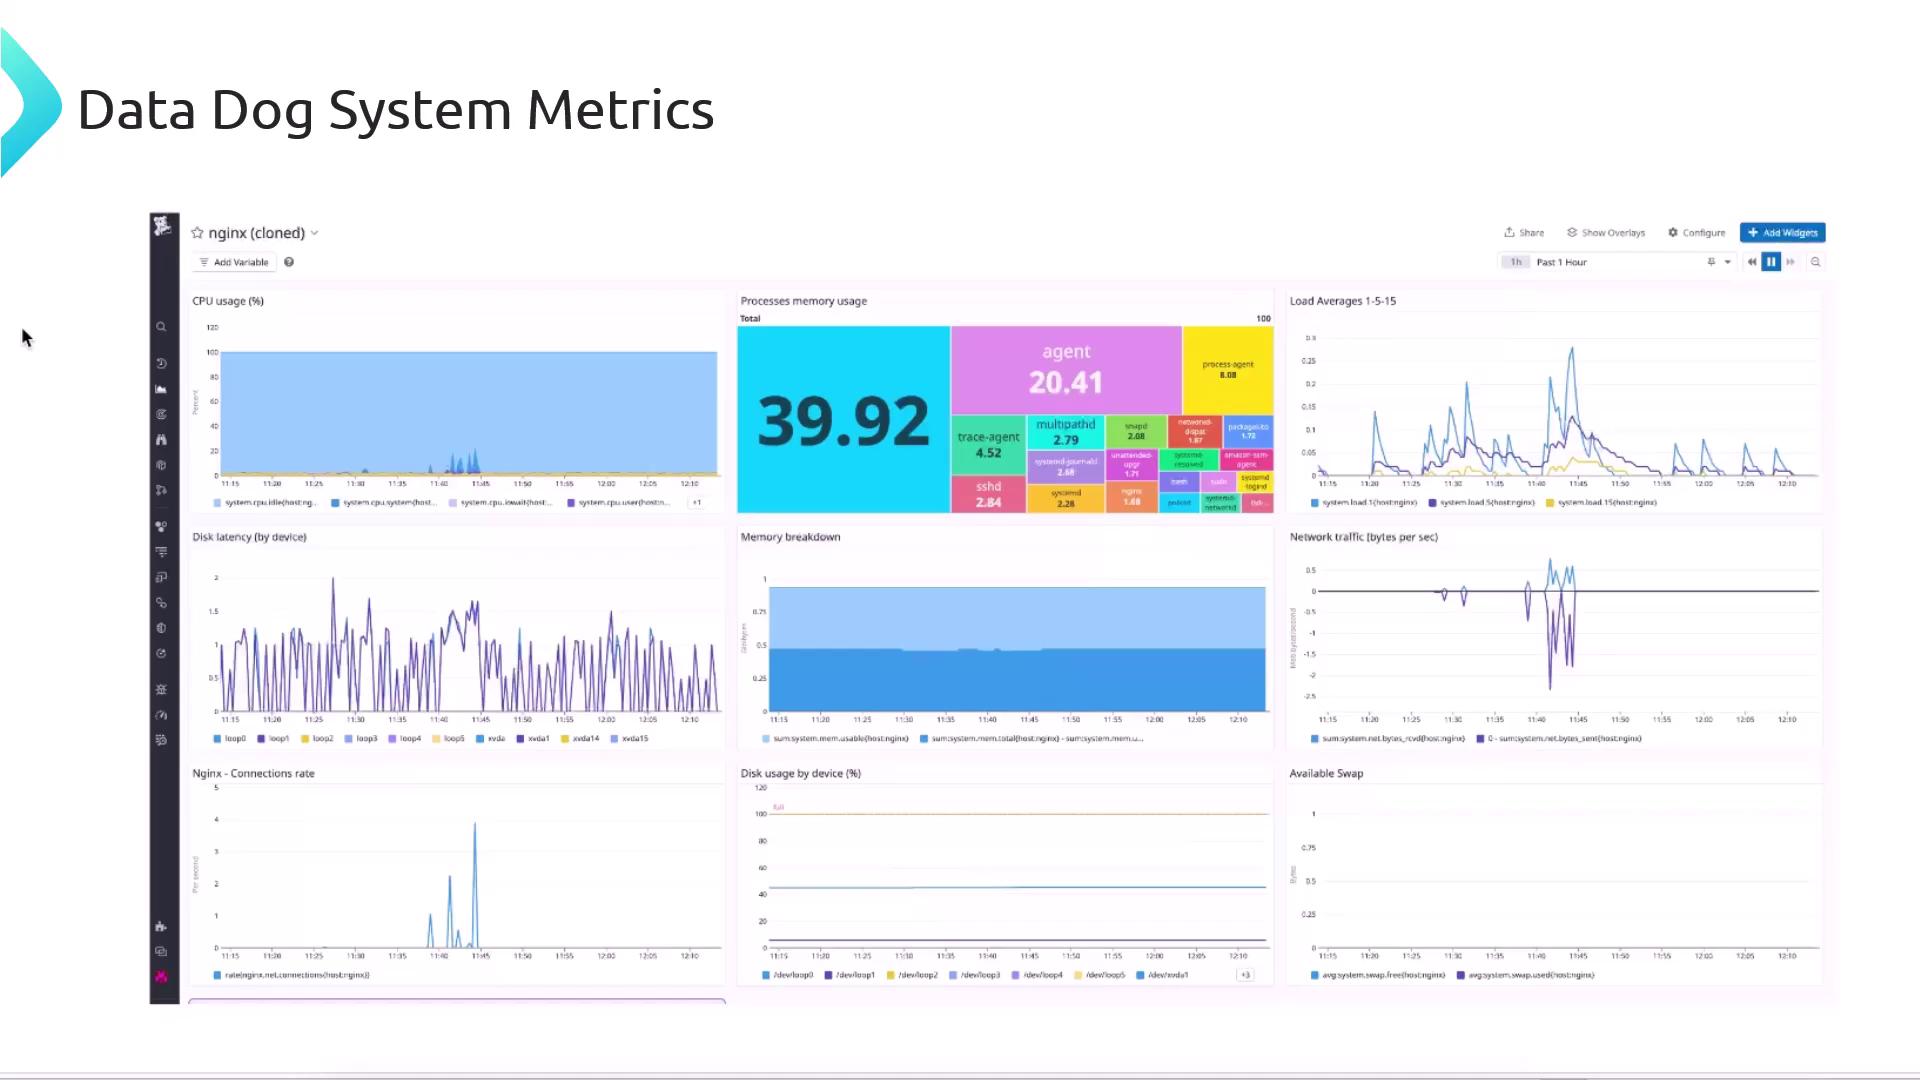
| CPU | system.cpu.user, system.cpu.idle, system.cpu.system |
| Memory | system.mem.used, system.mem.free, system.mem.cached |
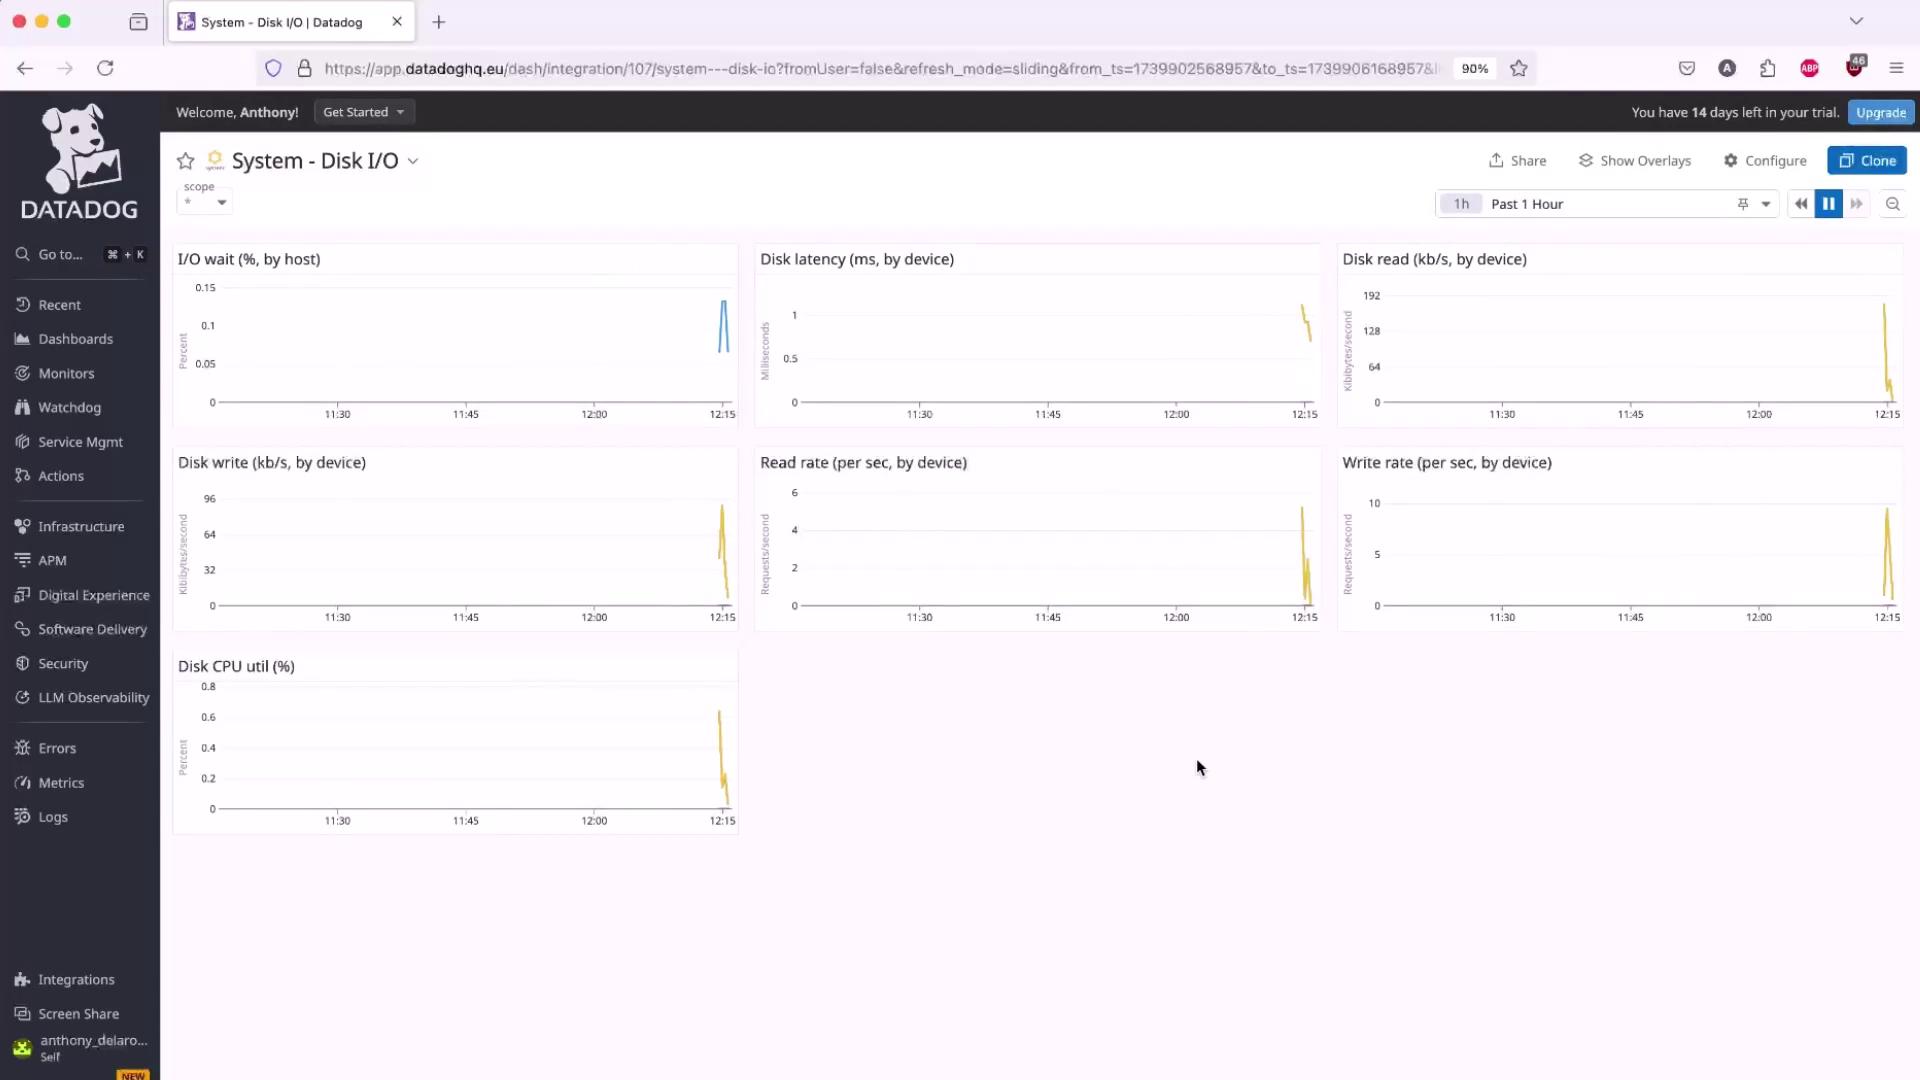
| Disk I/O | system.io.read_time, system.io.write_time |
| Network | system.net.bytes_sent, system.net.bytes_rcvd |
1. Install the Datadog Agent
Follow these steps to get the Agent up and running:- Sign up for a Datadog trial (14-day free) and skip optional steps until you reach the Agent installer.
- Select Ubuntu/Debian as your platform.
-
Copy and run the installer command, replacing
<YOUR_API_KEY>with your API key:
If you’re in the US region, set
DD_SITE="datadoghq.com". For other regions, refer to Datadog Sites.-
Watch the installer fetch and set up packages:
-
Verify the Agent status:
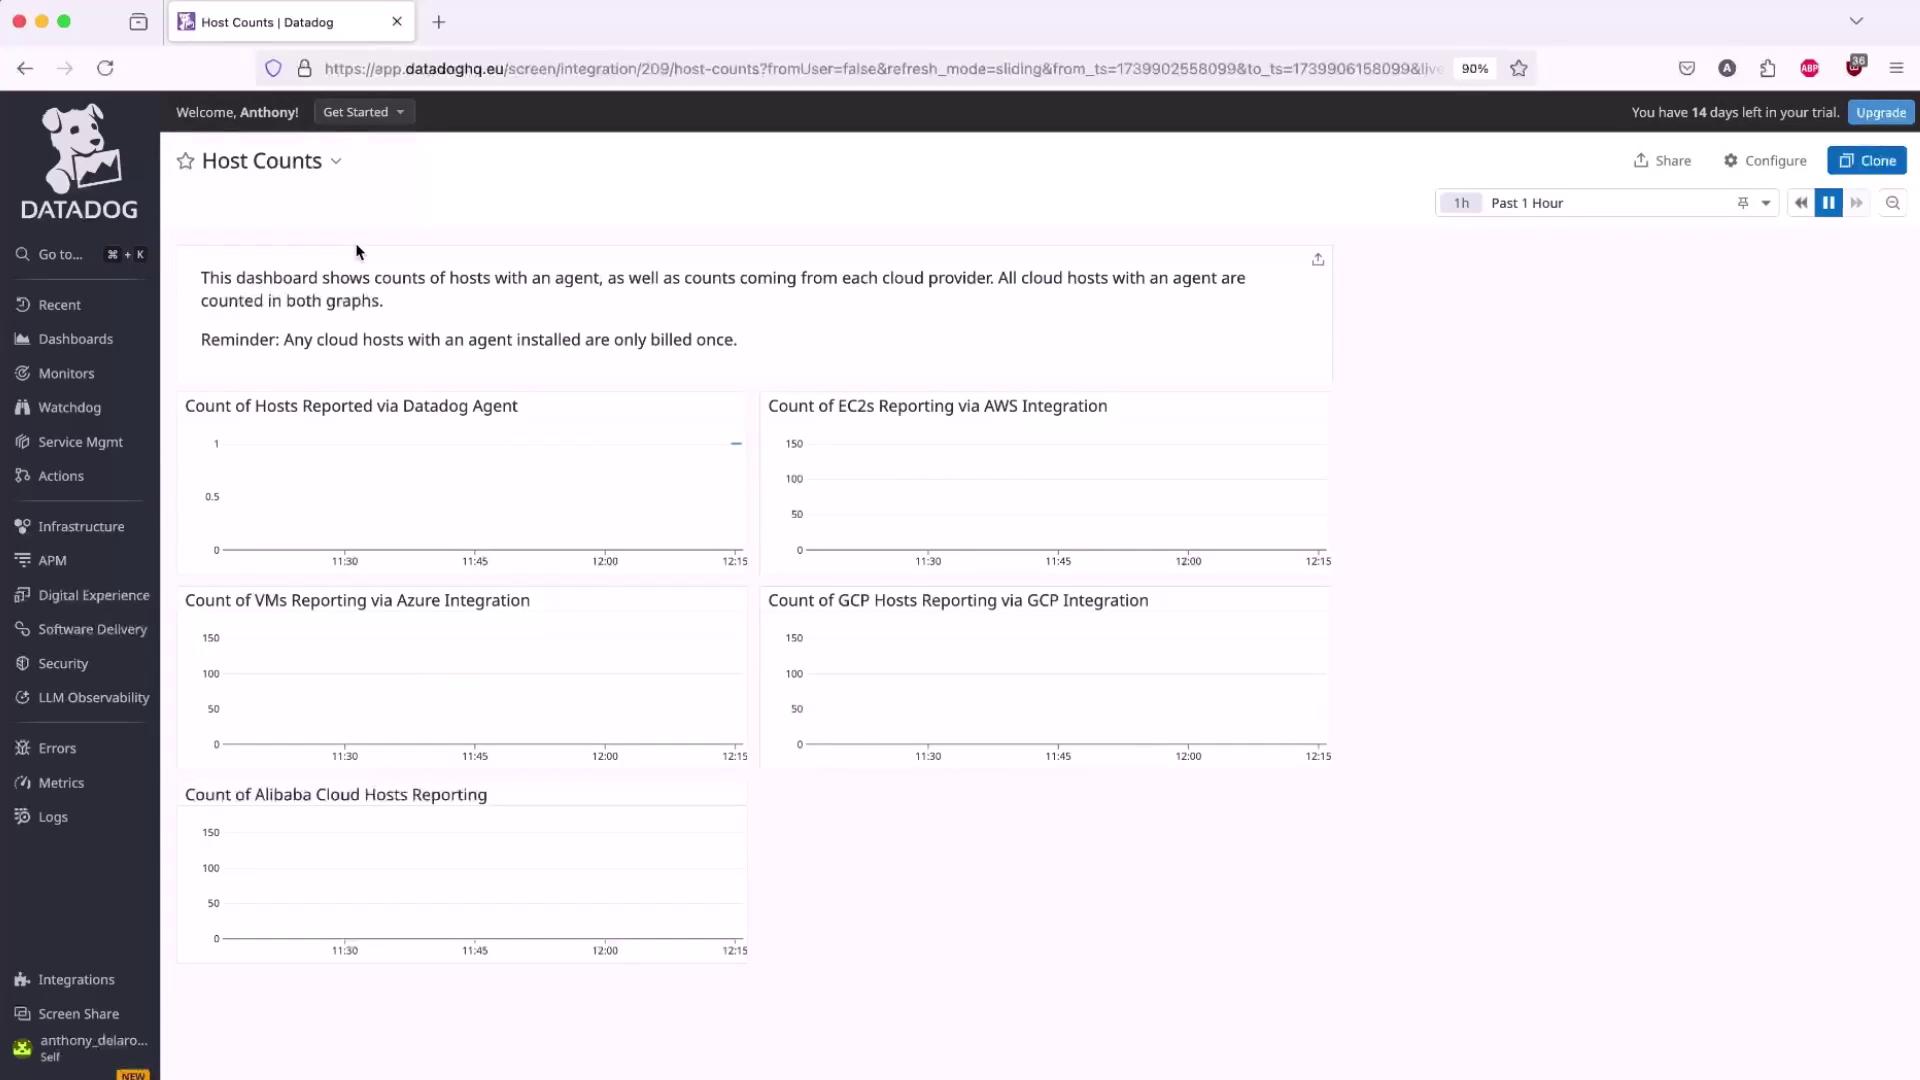
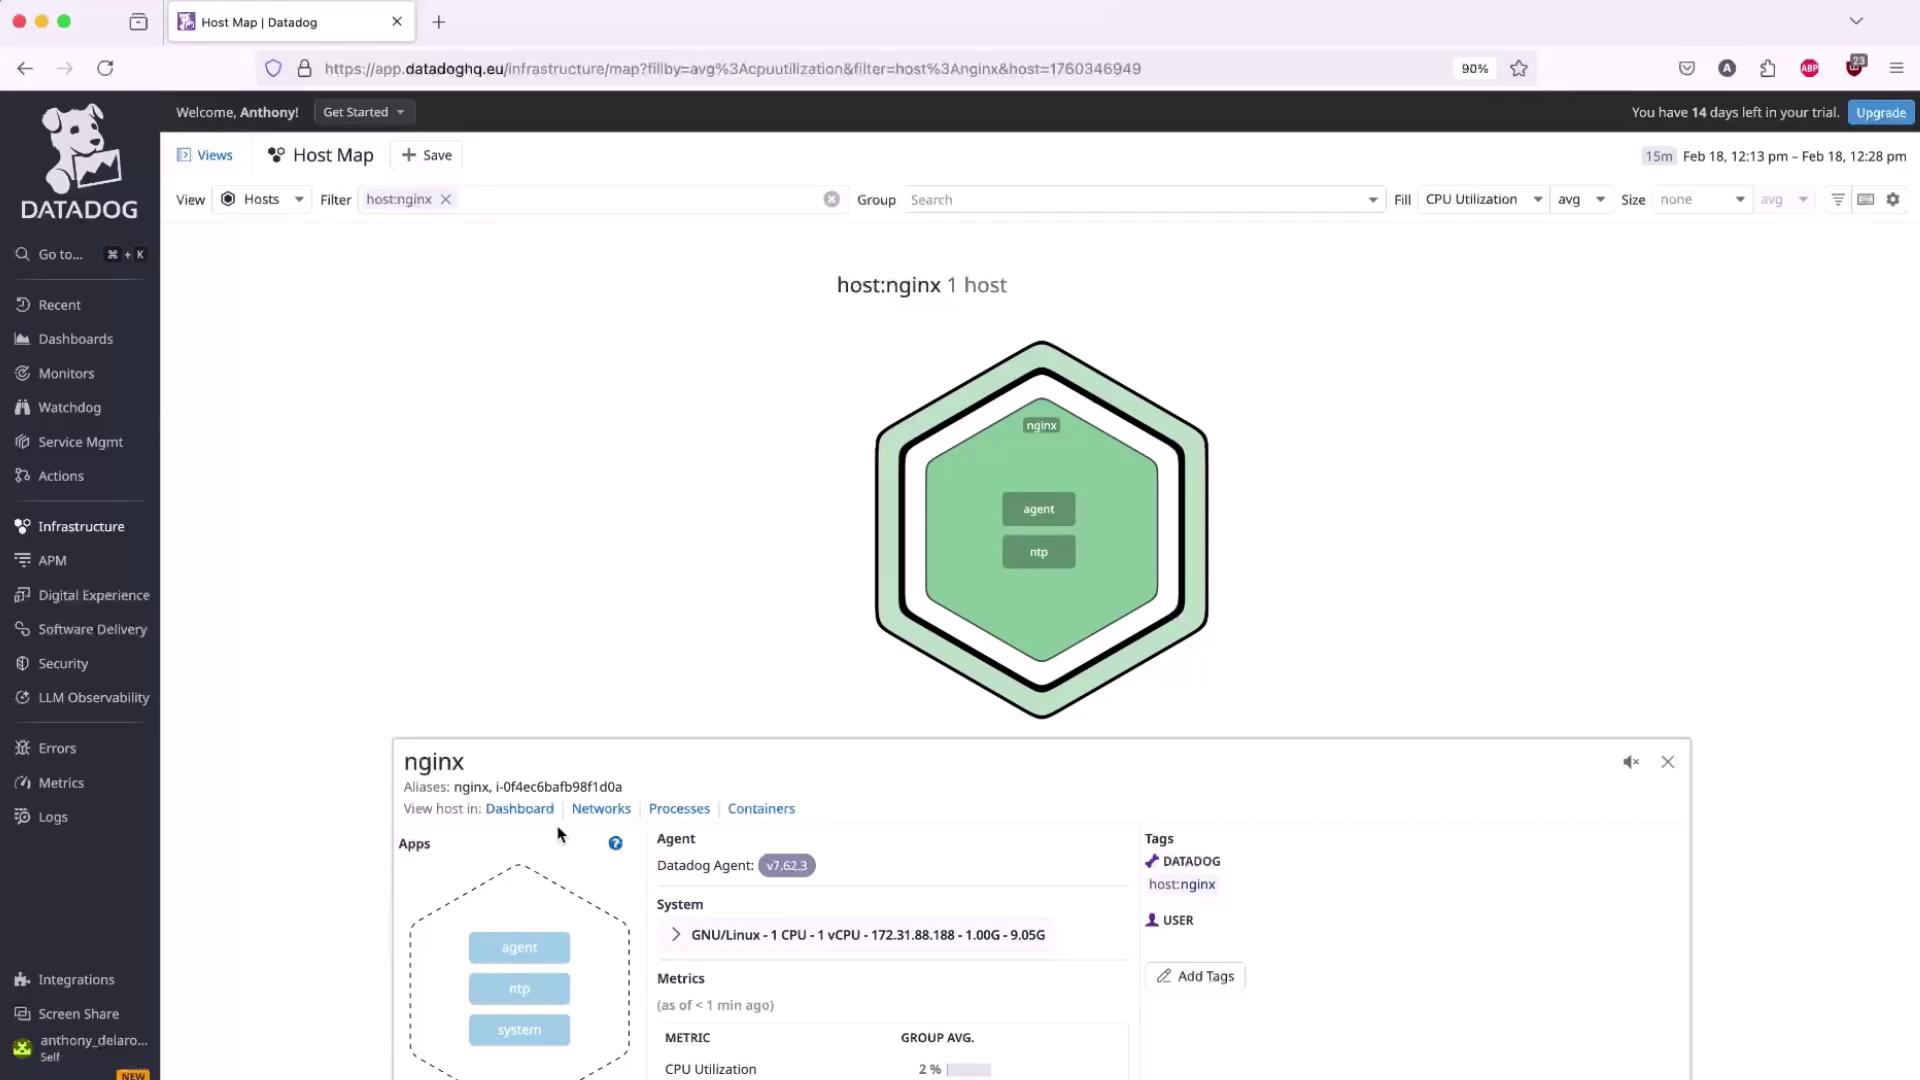
- In the Datadog UI, click Finish, then after ~2 minutes navigate to Dashboards → Hosts to confirm your host is reporting.
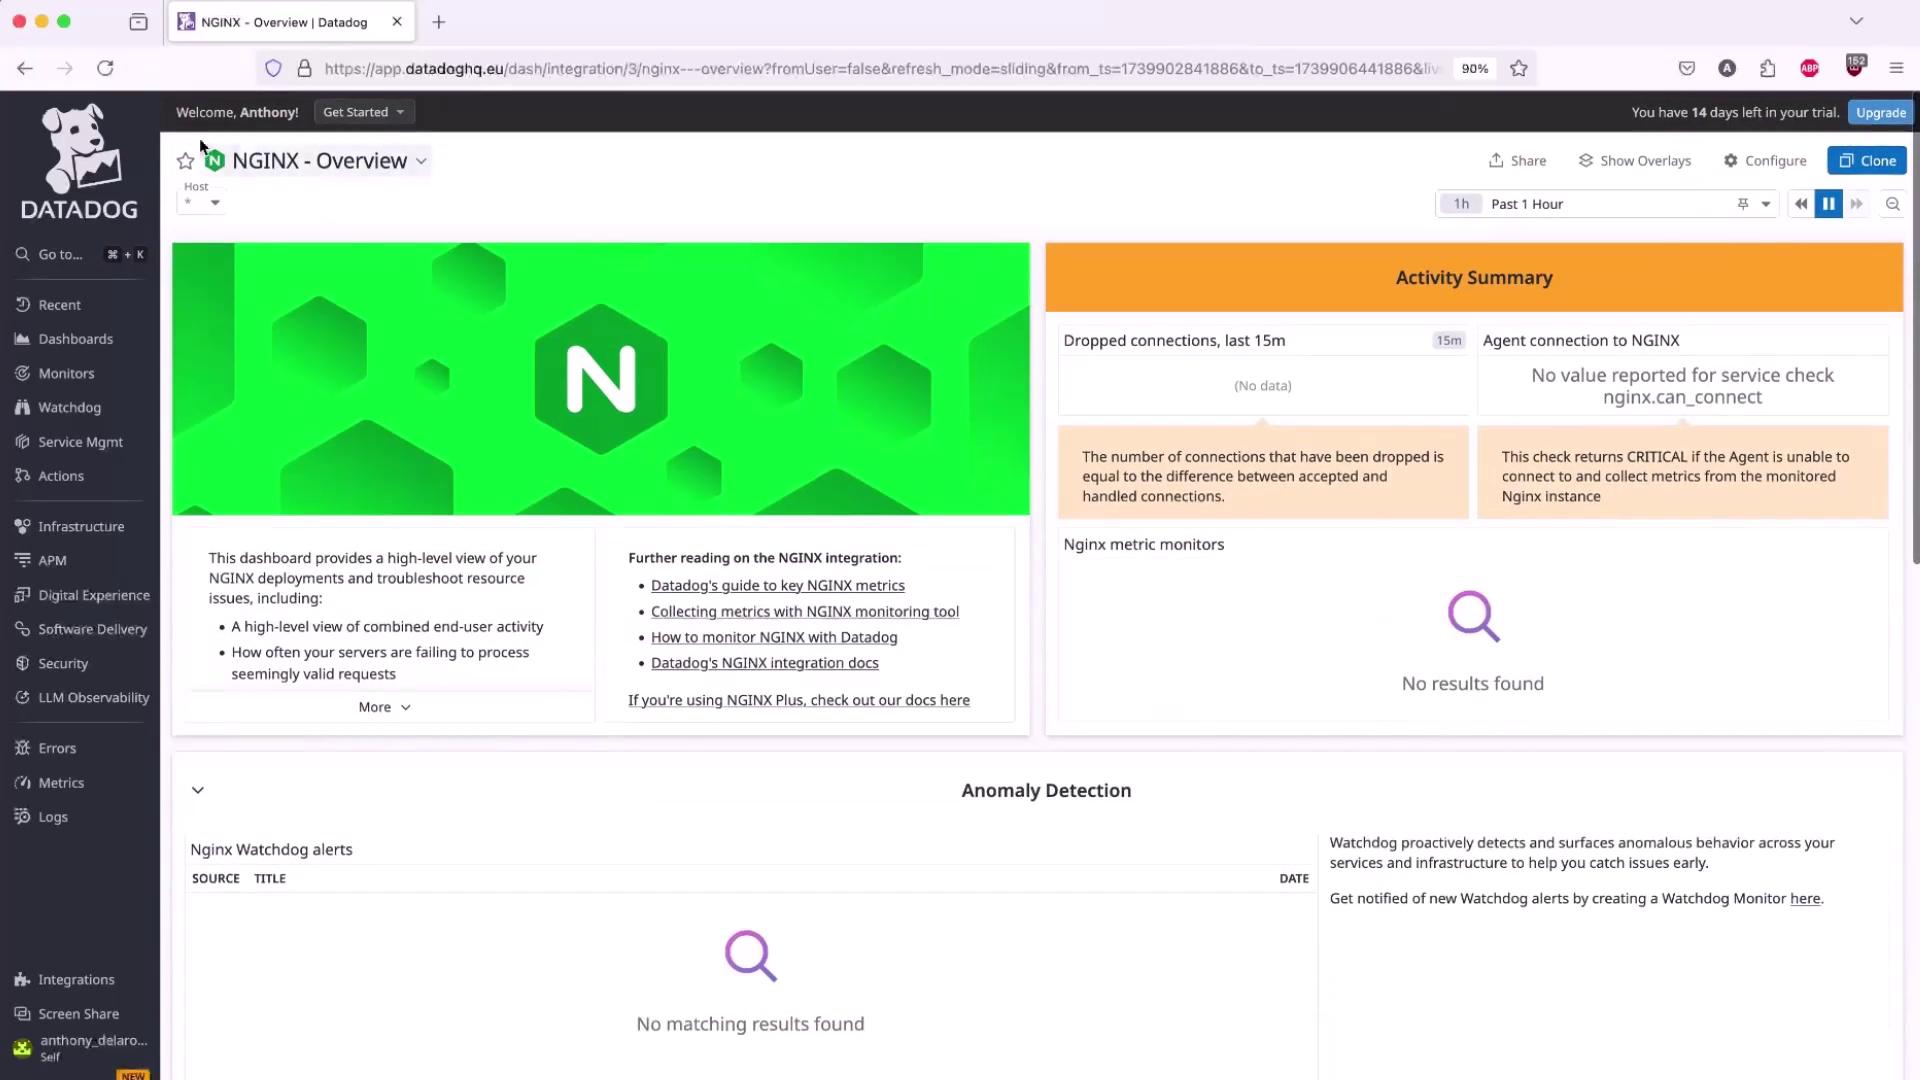
2. Configure the Nginx Integration
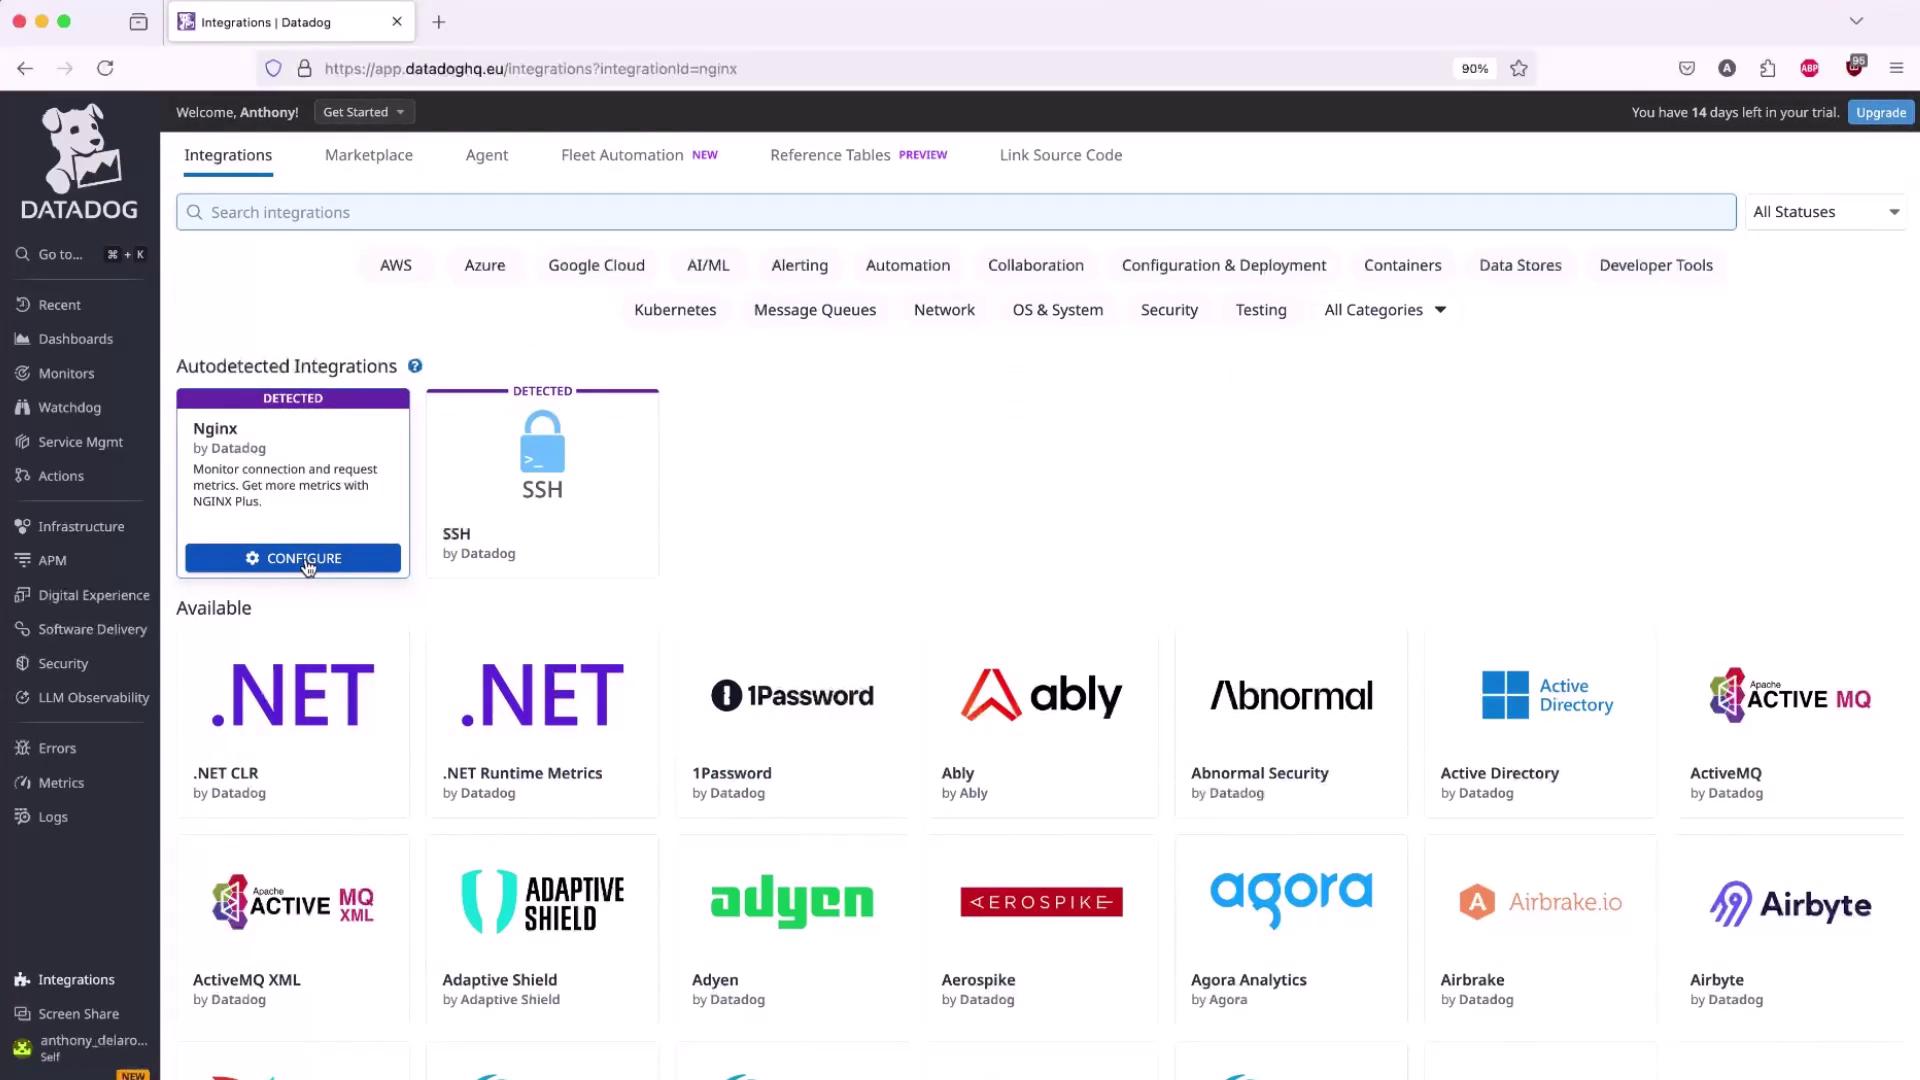
Once the Agent is collecting system metrics, enable the Nginx integration to capture request rates, active connections, and more.- In the Datadog UI, go to Integrations → Integrations, search for Nginx, then click Configure.
-
Ensure the
http_stub_status_moduleis compiled into your Nginx binary:
Exposing the stub status endpoint to the public internet is a security risk. Restrict access to
localhost or your private network.-
Update your site configuration to expose the status endpoint on
localhost:80. For example, in/etc/nginx/sites-available/example.conf: -
Reload Nginx and verify the endpoint:
Expected response:
-
Back in Datadog, under Nginx Integration → Configuration, set:
- Host: your EC2 instance
- Endpoint:
http://localhost/nginx_status
Next Steps
With system-level metrics and Nginx integration in place, you can:- Configure Datadog Alerts on key thresholds (e.g., high request latency).
- Build custom dashboards for error rates and traffic patterns.
- Apply APM for detailed request tracing.