Effective monitoring and troubleshooting of your Nginx server ensures high availability, performance, and quick resolution of issues. In this guide, we’ll cover:Documentation Index
Fetch the complete documentation index at: https://notes.kodekloud.com/llms.txt
Use this file to discover all available pages before exploring further.
- Collecting and interpreting access and error logs
- Exposing and querying basic metrics with the
stub_statusmodule - Integrating with external monitoring platforms
- Safely testing and reloading configurations
- Checking service health and firewall settings
HTTP Access Logs
Nginx’s HTTP access logs record every client request. By default, logs are written in the combined format, but you can define a custom pattern in thehttp block.
Defining a
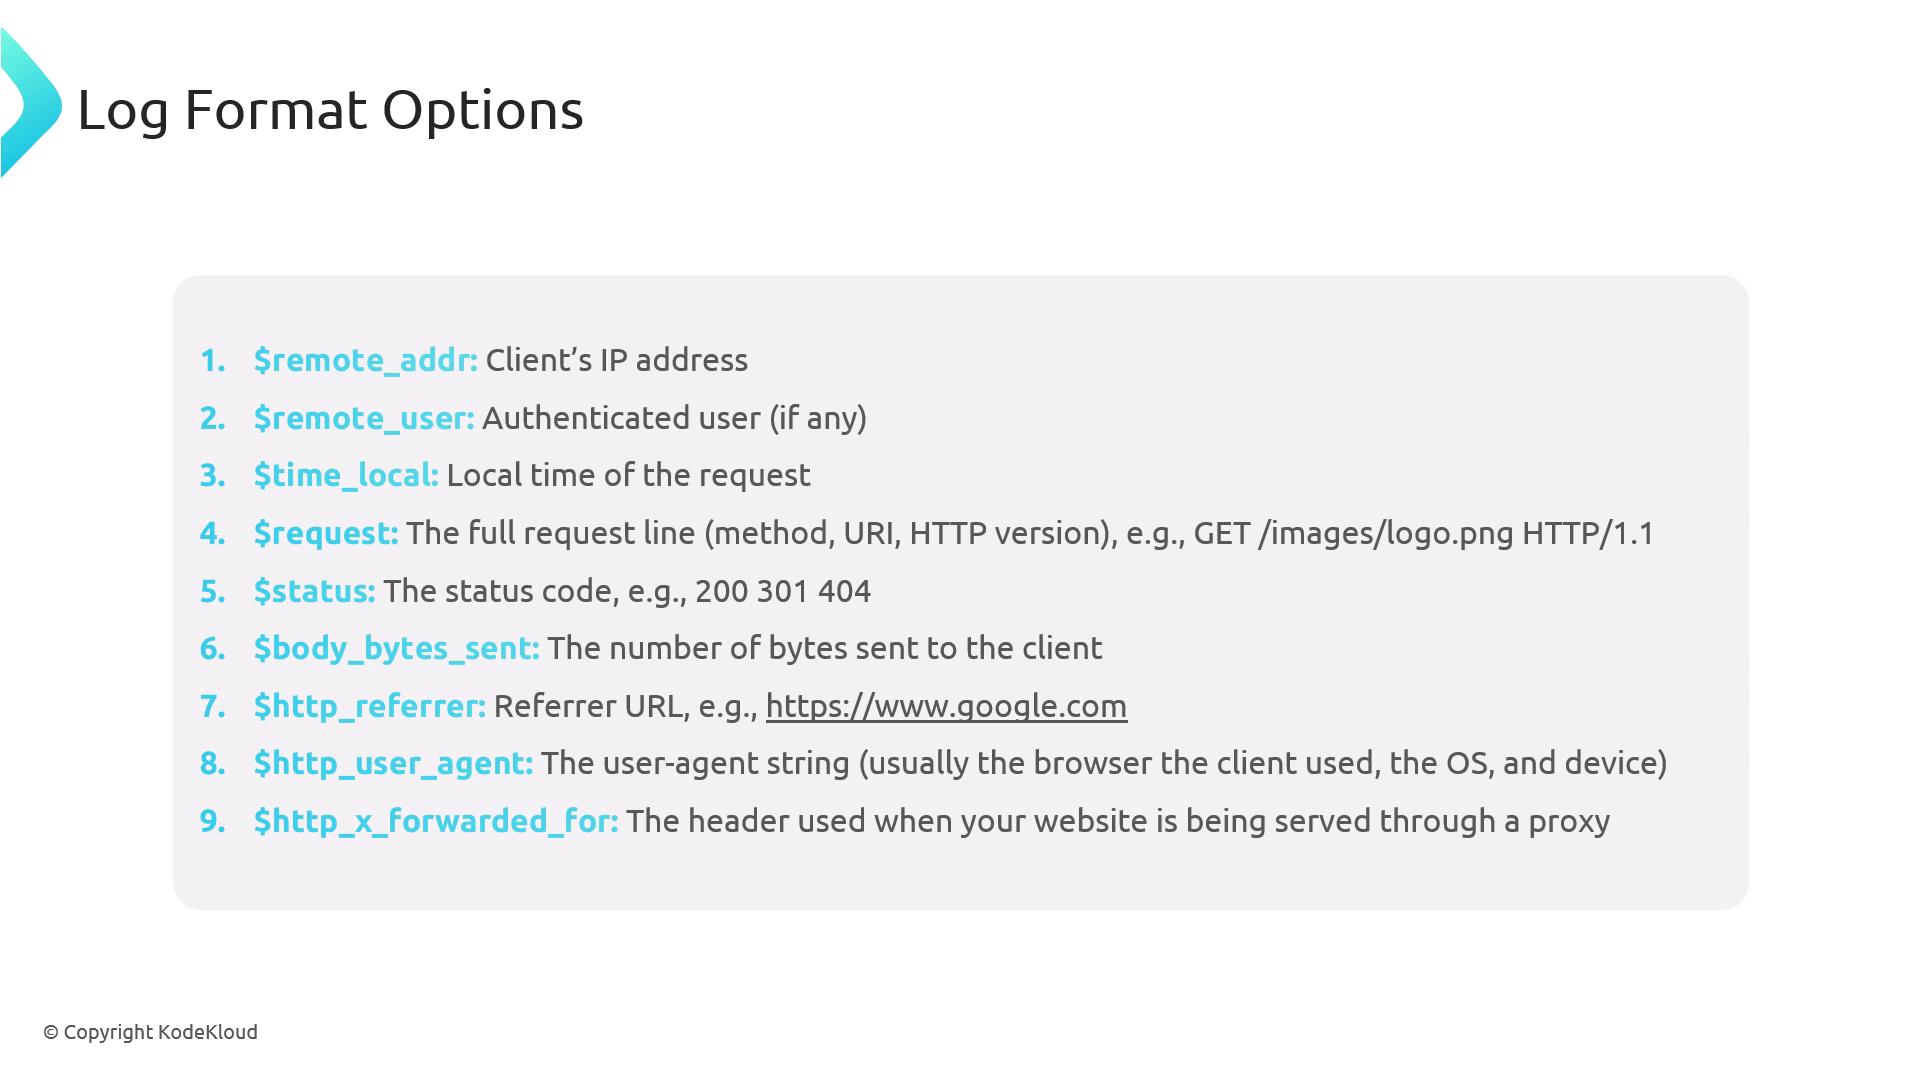
custom log format lets you include only the fields you need, simplifying downstream parsing and analytics.Common Log Variables
| Variable | Description |
|---|---|
$remote_addr | Client IP address |
$remote_user | Authenticated username (or - if none) |
$time_local | Local timestamp |
$request | Request line (METHOD URI HTTP/VERSION) |
$status | Response status code (e.g., 200, 404) |
$body_bytes_sent | Bytes sent to the client |
$http_referer | Referring URL |
$http_user_agent | Client browser user agent |
$http_x_forwarded_for | Original client IP when behind proxies |
Enabling and Viewing Access Logs
-
Enable in your server block:
-
Tail the log to observe incoming requests:
custom format):
- 192.168.1.1 →
$remote_addr - - →
$remote_user - [26/Jan/2025:14:23:35 +0000] →
$time_local - “GET /images/logo.png HTTP/1.1” →
$request - 200 →
$status - 512 →
$body_bytes_sent - ”-” →
$http_referer - “Mozilla/5.0…Safari/537.36” →
$http_user_agent
Error Logs
Error logs capture configuration syntax errors, runtime exceptions, and worker process messages. Enable them alongside access logs:[emerg] or [crit] entries usually point to misconfigurations that need immediate attention.
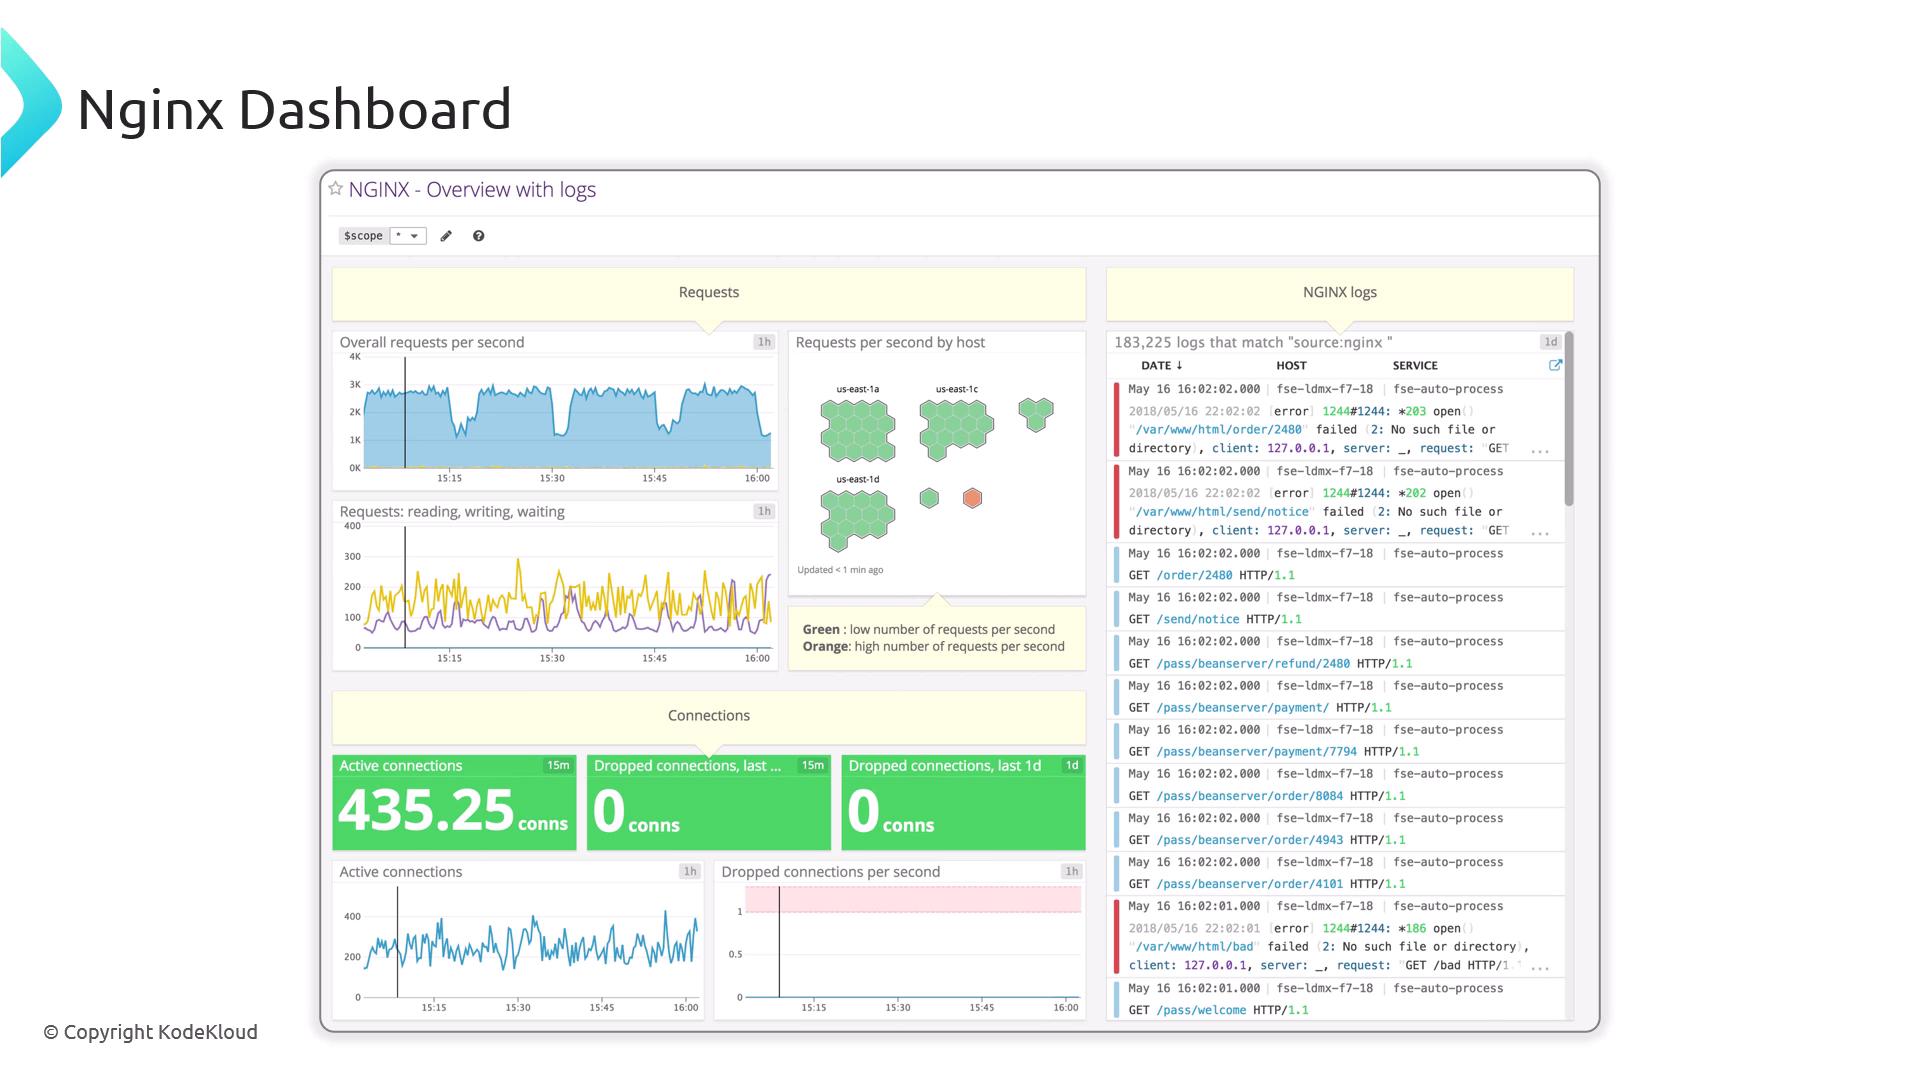
HTTP Stub Status Metrics
Thestub_status module provides a lightweight metrics endpoint for basic Nginx statistics.
- Port 81 isolates the status endpoint
access_log offreduces noiseallow/denyrestricts access to localhost
| Metric | Meaning |
|---|---|
| Active connections | Currently open client connections |
| accepts | Total accepted connections |
| handled | Connections handled (usually = accepts) |
| requests | Total processed requests |
| Reading | Connections reading client requests |
| Writing | Connections writing responses |
| Waiting | Idle keep-alive connections |
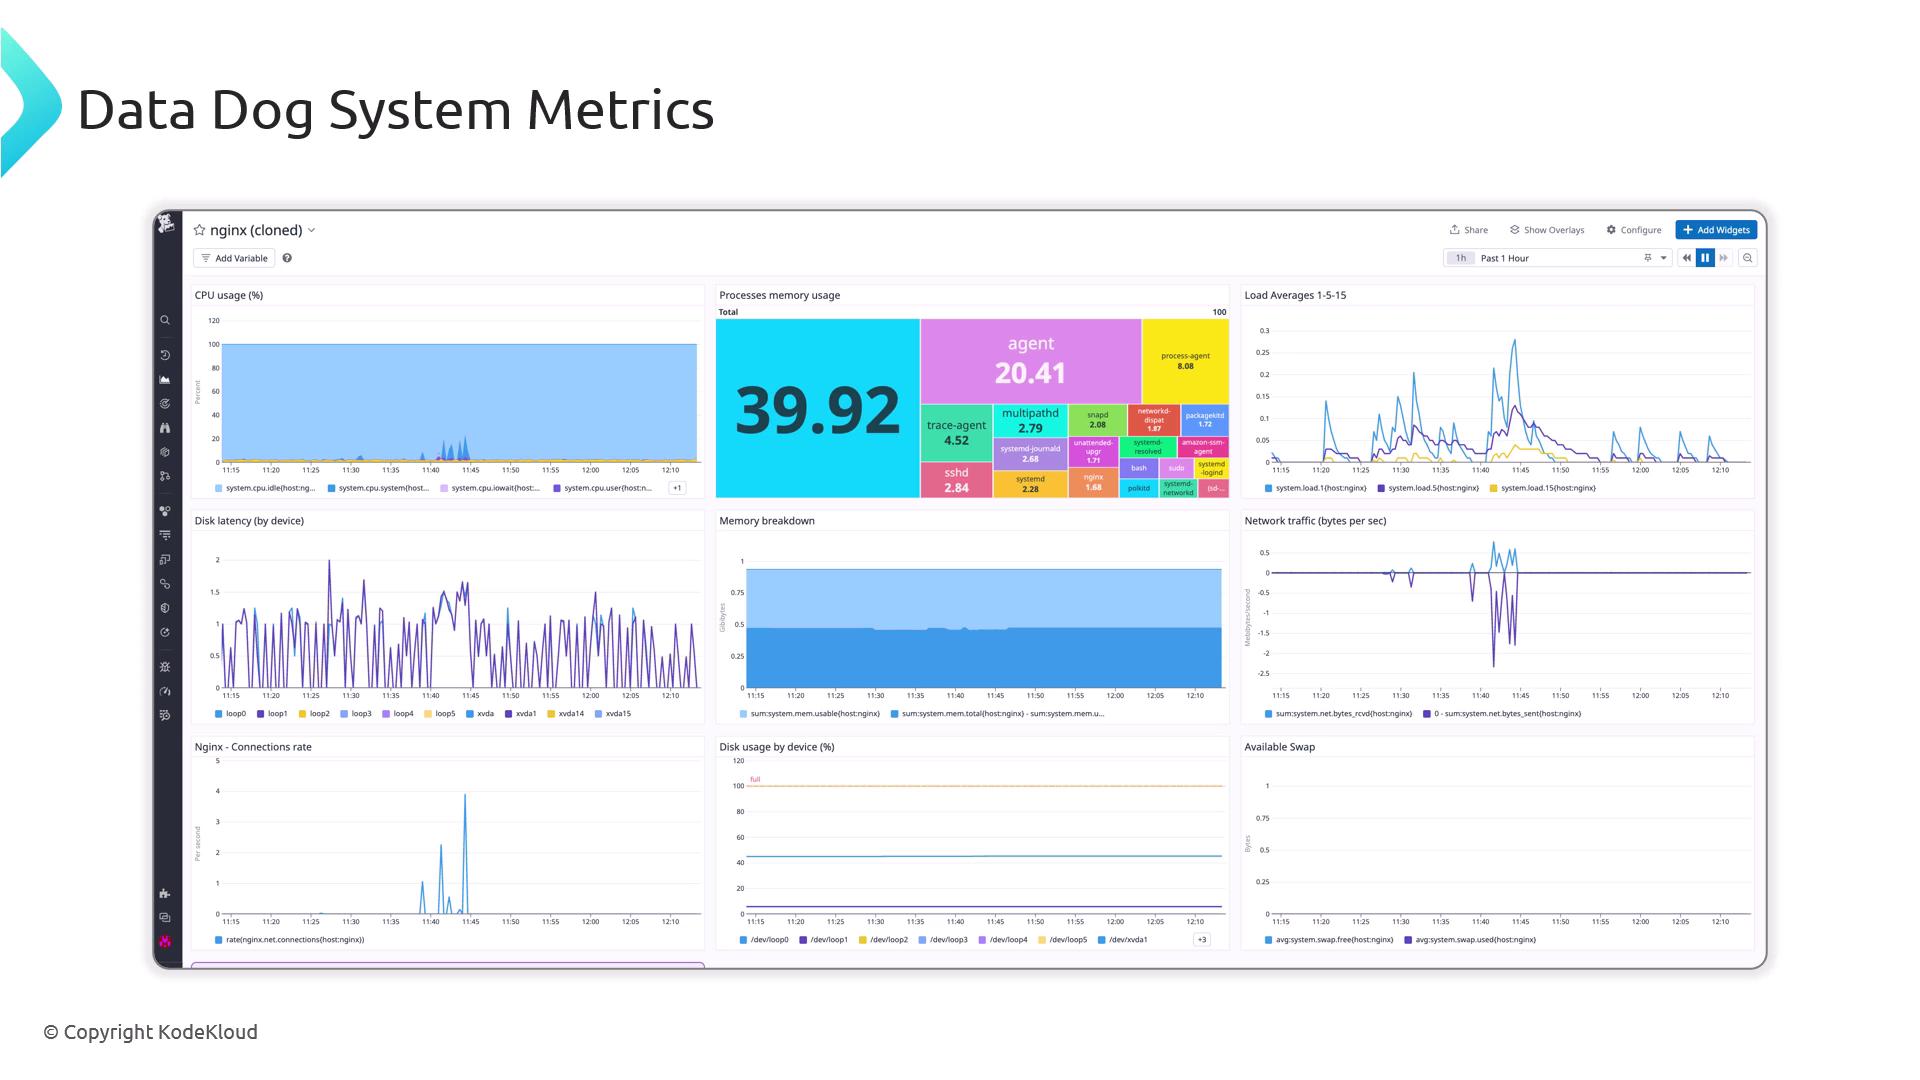
External Monitoring Agents
For advanced dashboards, alerts, and long-term retention, integrate Nginx with external platforms.| Tool | Use Case | Link |
|---|---|---|
| Prometheus & Grafana | Pulls stub_status metrics, rich graphs | Prometheus / Grafana |
| Datadog | SaaS monitoring with Nginx integration | Datadog |
| Dynatrace | Full-stack application monitoring | Dynatrace |
| New Relic | APM with Nginx plugin | New Relic |
Configuration Testing and Reloading
Validate every change before reloading Nginx:Always run
nginx -t prior to nginx -s reload to prevent downtime due to syntax errors.Service Status and Basic Connectivity
Check Nginx’s systemd status:200 OK confirms that Nginx is serving content correctly.
Firewall Configuration
Open ports 80 and 443 on both OS and cloud firewalls. Ubuntu (ufw):Conclusion
You’ve learned how to:- Define and interpret access and error logs
- Expose basic metrics with
stub_status - Integrate with external monitoring tools (e.g., Datadog, Prometheus)
- Validate and reload configurations safely
- Verify service status, connectivity, and firewall settings