-
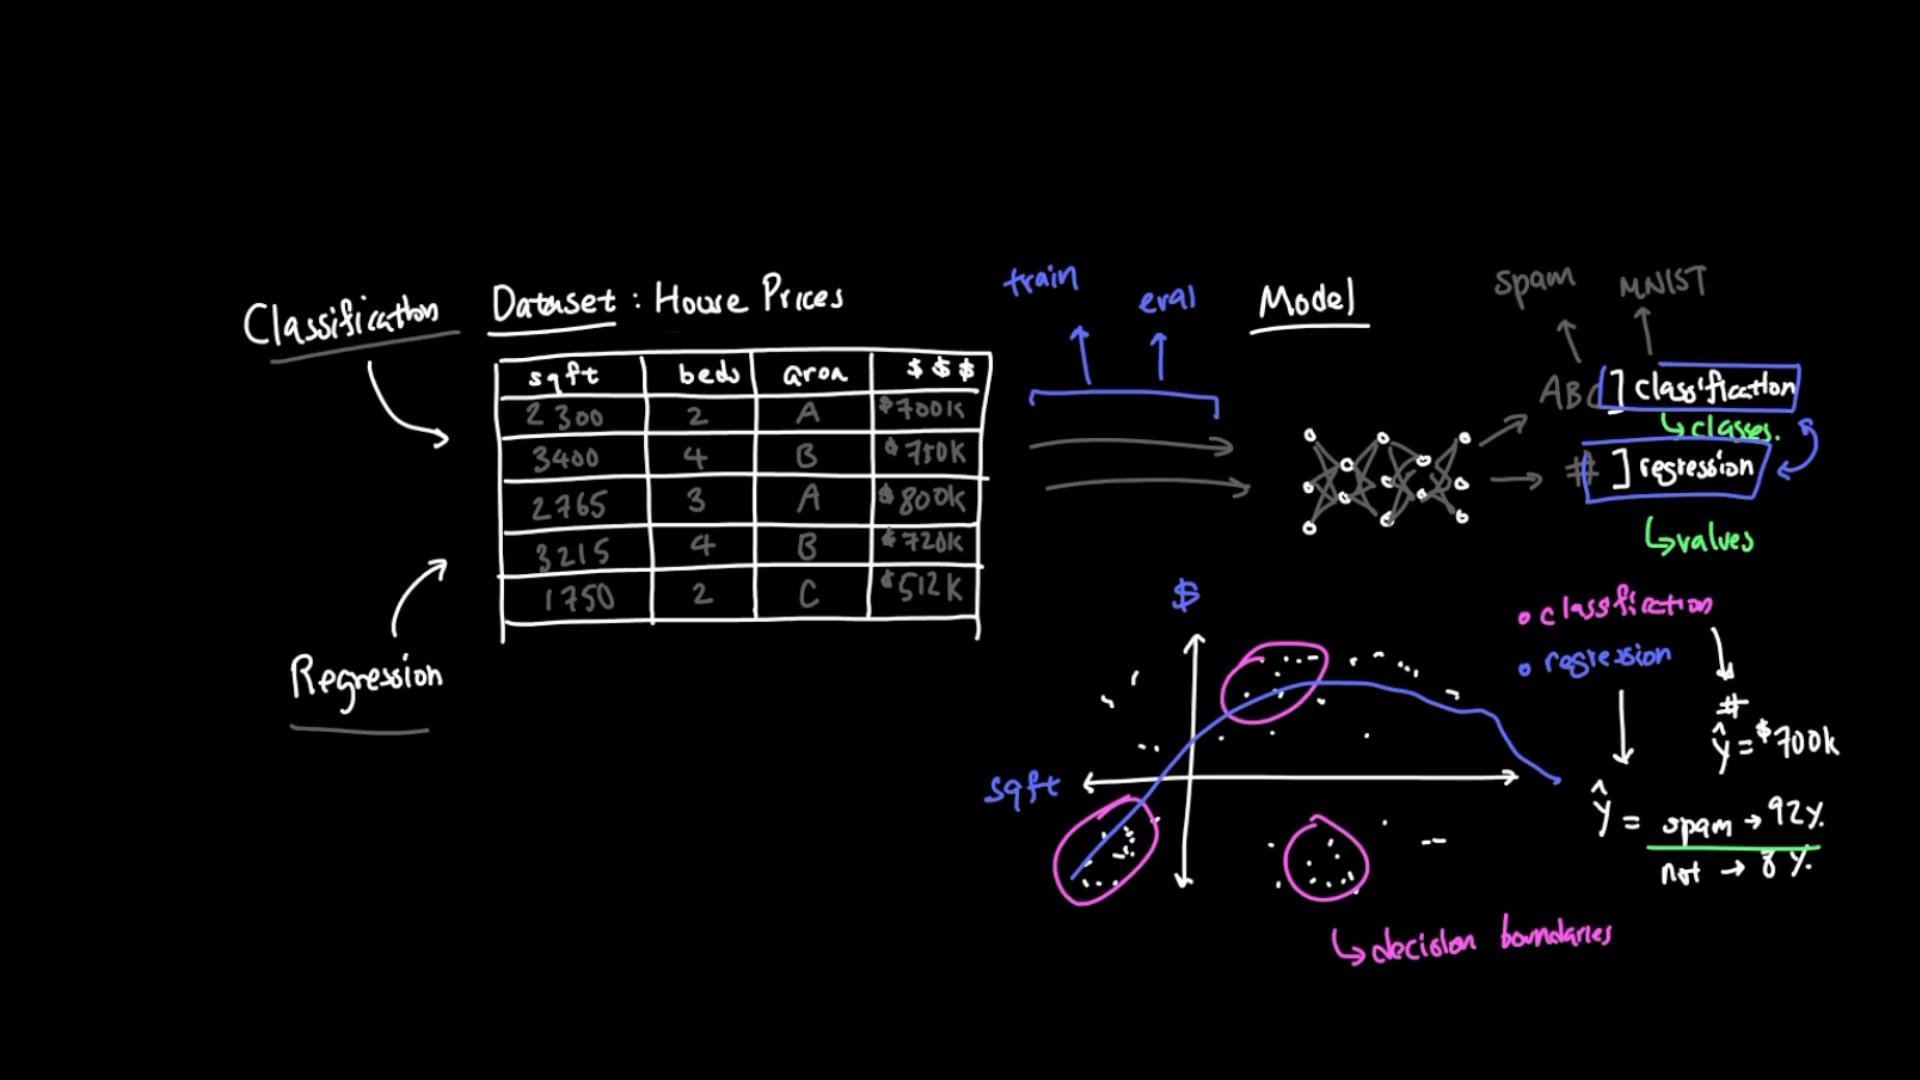
Regression predicts continuous values.
Example: predicting a house sale price. Given features such as square footage, number of bedrooms, and neighborhood, a regression model predicts a numeric value like 700000, 850000, or 1_200_000. Other regression examples include predicting rent, delivery time, temperature, revenue, or demand. The output is a real number (or vector of real numbers), and it can take many possible values. -
Classification predicts discrete categories.
Example: a spam filter predicts whether an email belongs to the “spam” or “not spam” class. MNIST digit recognition is also classification: the model looks at an image of a handwritten digit and chooses one of 10 discrete classes (0–9). Classification outputs are often probabilities across classes (for example, spam: 92%, not-spam: 8%), and the predicted label is usually the class with the highest probability.
- For classification, the model learns decision boundaries that separate classes in feature space. Points on one side of a boundary belong to one class, points on the other side belong to another.
- For regression, the model fits a function (a line or curve) through the data to predict a numerical value from inputs (for example, square footage on the x-axis and price on the y-axis).
- Regression training often uses losses that measure distance between predicted and true values (mean squared error, mean absolute error). Evaluation metrics include RMSE, MAE, and R².
- Classification training commonly uses probabilistic losses such as cross-entropy, and evaluation metrics include accuracy, precision, recall, F1 score, and calibration measures.
For more on supervised learning and common metrics, see:
Summary: Regression predicts numbers (use
MSE/MAE during training and RMSE/MAE/R² for evaluation), while classification predicts categories (use cross-entropy during training and accuracy/precision/recall/F1 for evaluation). Regardless of task, the model learns a mapping from inputs to outputs — simpler problems can be solved with simpler models; harder problems require more expressive models, more data, better features, and robust validation.