Identifying the Key Metrics
Diego Data guided the team with four essential questions:-
For our pipeline, what is the best indicator of efficient and timely delivery of new features?
The answer: Track the elapsed time from the first code commit to when the feature is available in production. -
How can we measure the workload on any given day?
The solution: Count the number of daily production deployments to assess the pressure on the software delivery system. -
How do we ensure that deployments are not only rapid but also reliable?
The approach: Monitor the frequency of deployment failures in production to gauge code quality. -
How will we monitor and resolve customer issues effectively?
The answer: Measure the average time taken to address reported customer issues, ensuring a high level of service quality.
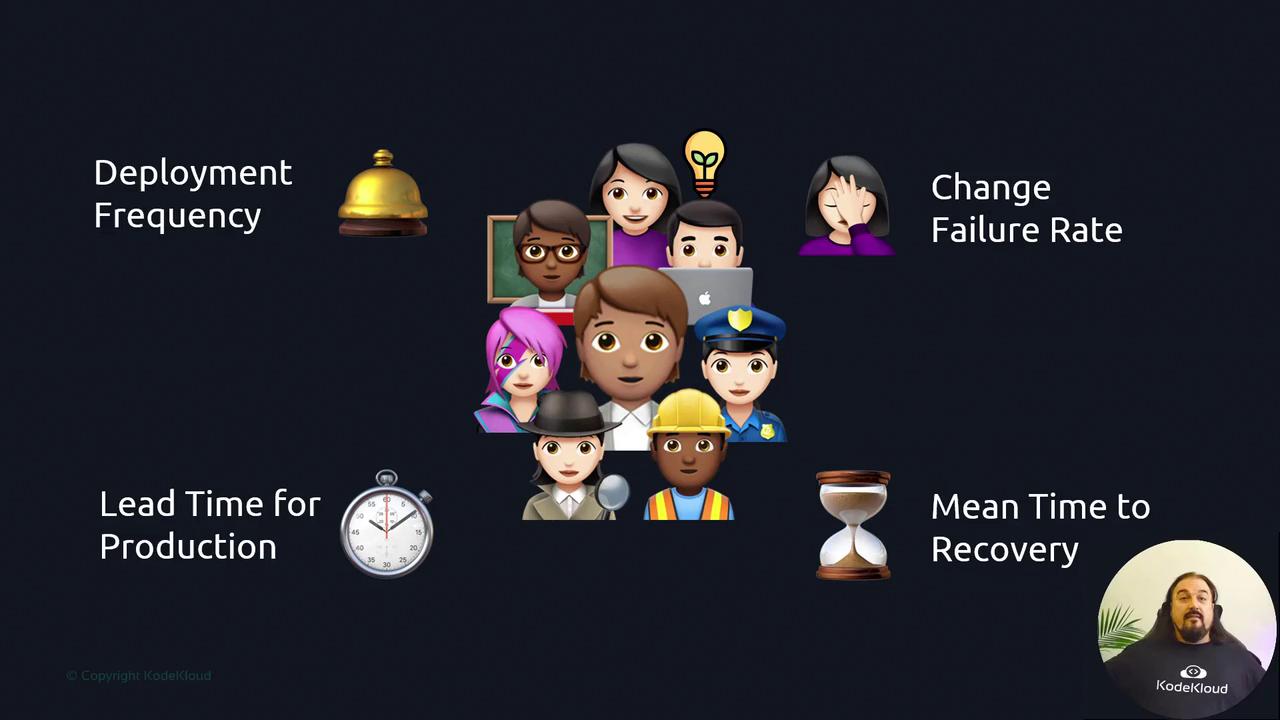
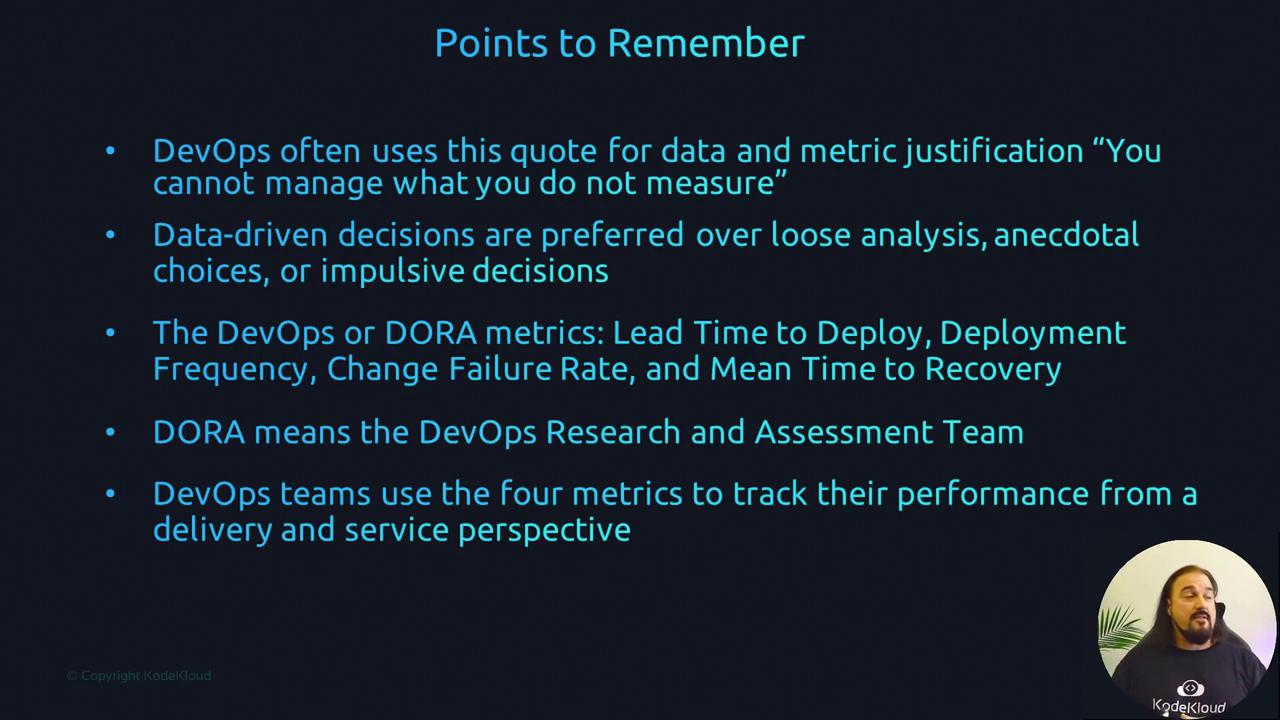
The Four Core Metrics
The analysis distilled four pivotal DevOps performance indicators:- Deployment Frequency: How often new features or changes are deployed.
- Change Failure Rate: The percentage of deployments that result in failures.
- Lead Time from Repository to Production: The time taken from a code commit to its deployment in production.
- Mean Time to Recover: The average time required to restore service after a failure.
Focusing on these metrics not only clarifies performance but also lays the groundwork for continuous improvement, driving enhanced efficiency and customer satisfaction.