In this guide, we explore the Prometheus dashboard and various Istio metrics to gain insights into the performance of your service mesh. The Bookinfo “info” service is deployed with default settings and is actively running in your cluster. We will first open the Kiali dashboard to monitor browser requests and then simulate realistic load by generating continuous traffic.Documentation Index
Fetch the complete documentation index at: https://notes.kodekloud.com/llms.txt
Use this file to discover all available pages before exploring further.
Generating Traffic and Launching Prometheus
To simulate continuous traffic on your application, run the following command in your terminal:Querying Istio Metrics in Prometheus
When you enter the term “Istio” in Prometheus, you will notice a list of metrics originating from both the Istio control plane and the deployed applications. For instance, you can execute the following query to review diagnostic metrics generated by the Istio agent: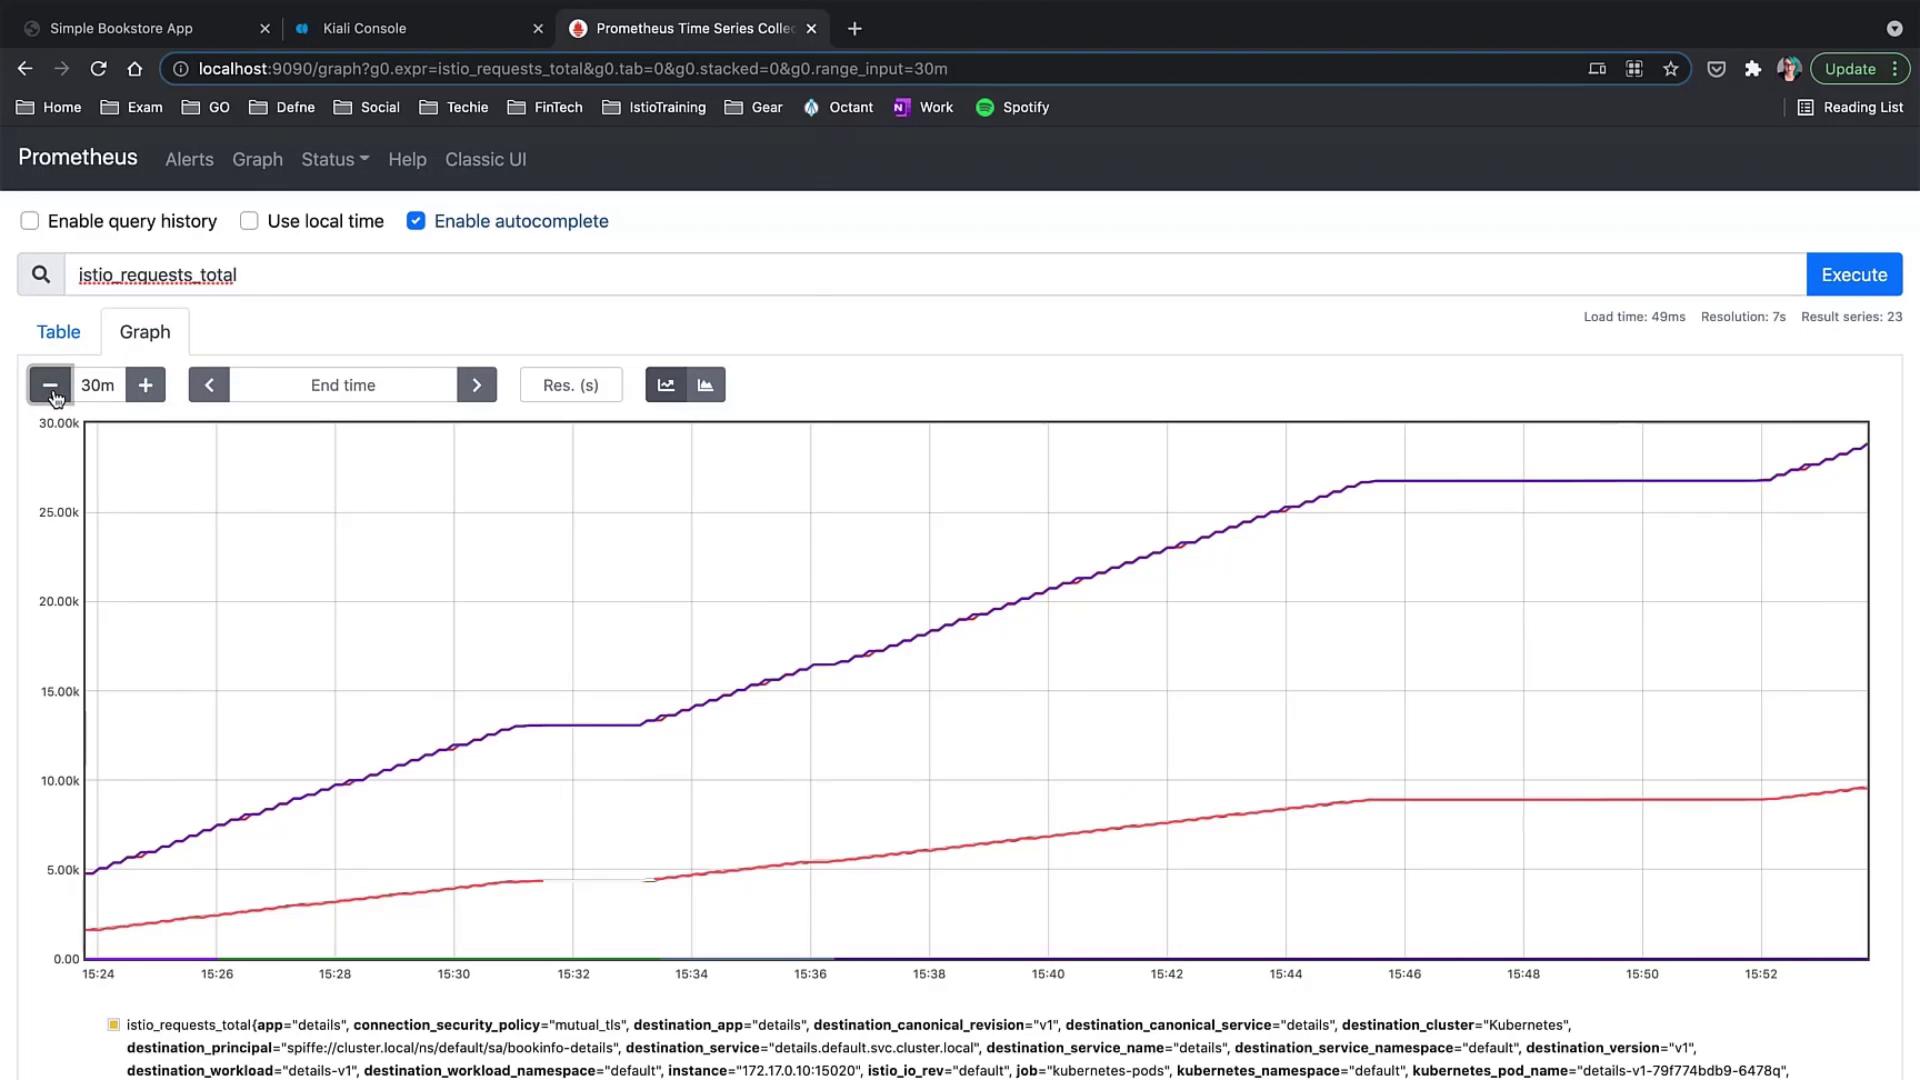
For more detailed guidance on Prometheus queries and their structure, refer to the Prometheus Documentation.
Verifying Prometheus and Grafana Add-ons
Before diving into Grafana dashboards, verify that your Prometheus and Grafana services are running as expected. To check the Prometheus service, run:Exploring Grafana Dashboards
Grafana provides a suite of dashboards to monitor various aspects of your Istio service mesh.Istio Control Plane Dashboard
This dashboard displays critical system metrics such as CPU, memory, disk usage, goroutine counts, control plane errors, and configuration synchronization issues. Clicking on any graph in view mode reveals more granular details.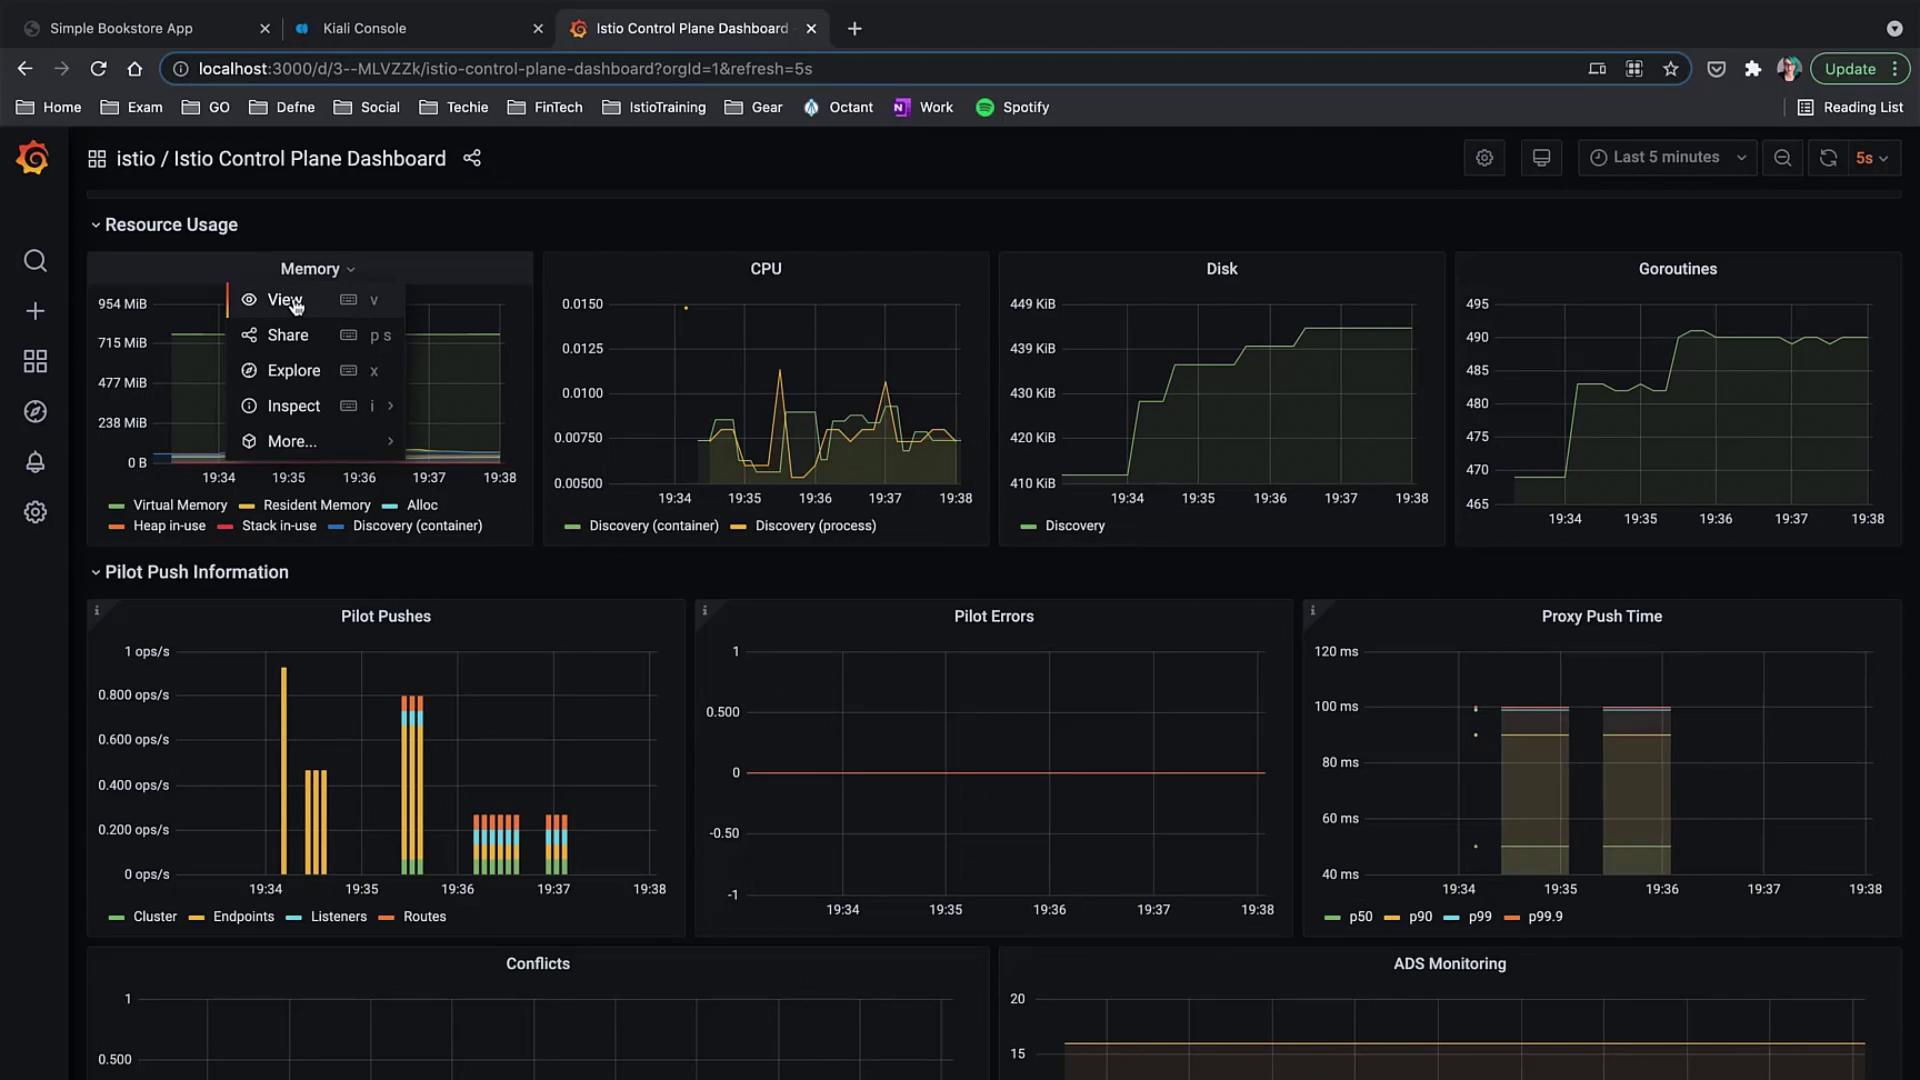
Istio Mesh Dashboard
The Istio Mesh dashboard offers an overarching view of your service mesh by illustrating workloads, services, success rates, errors, and overall configuration: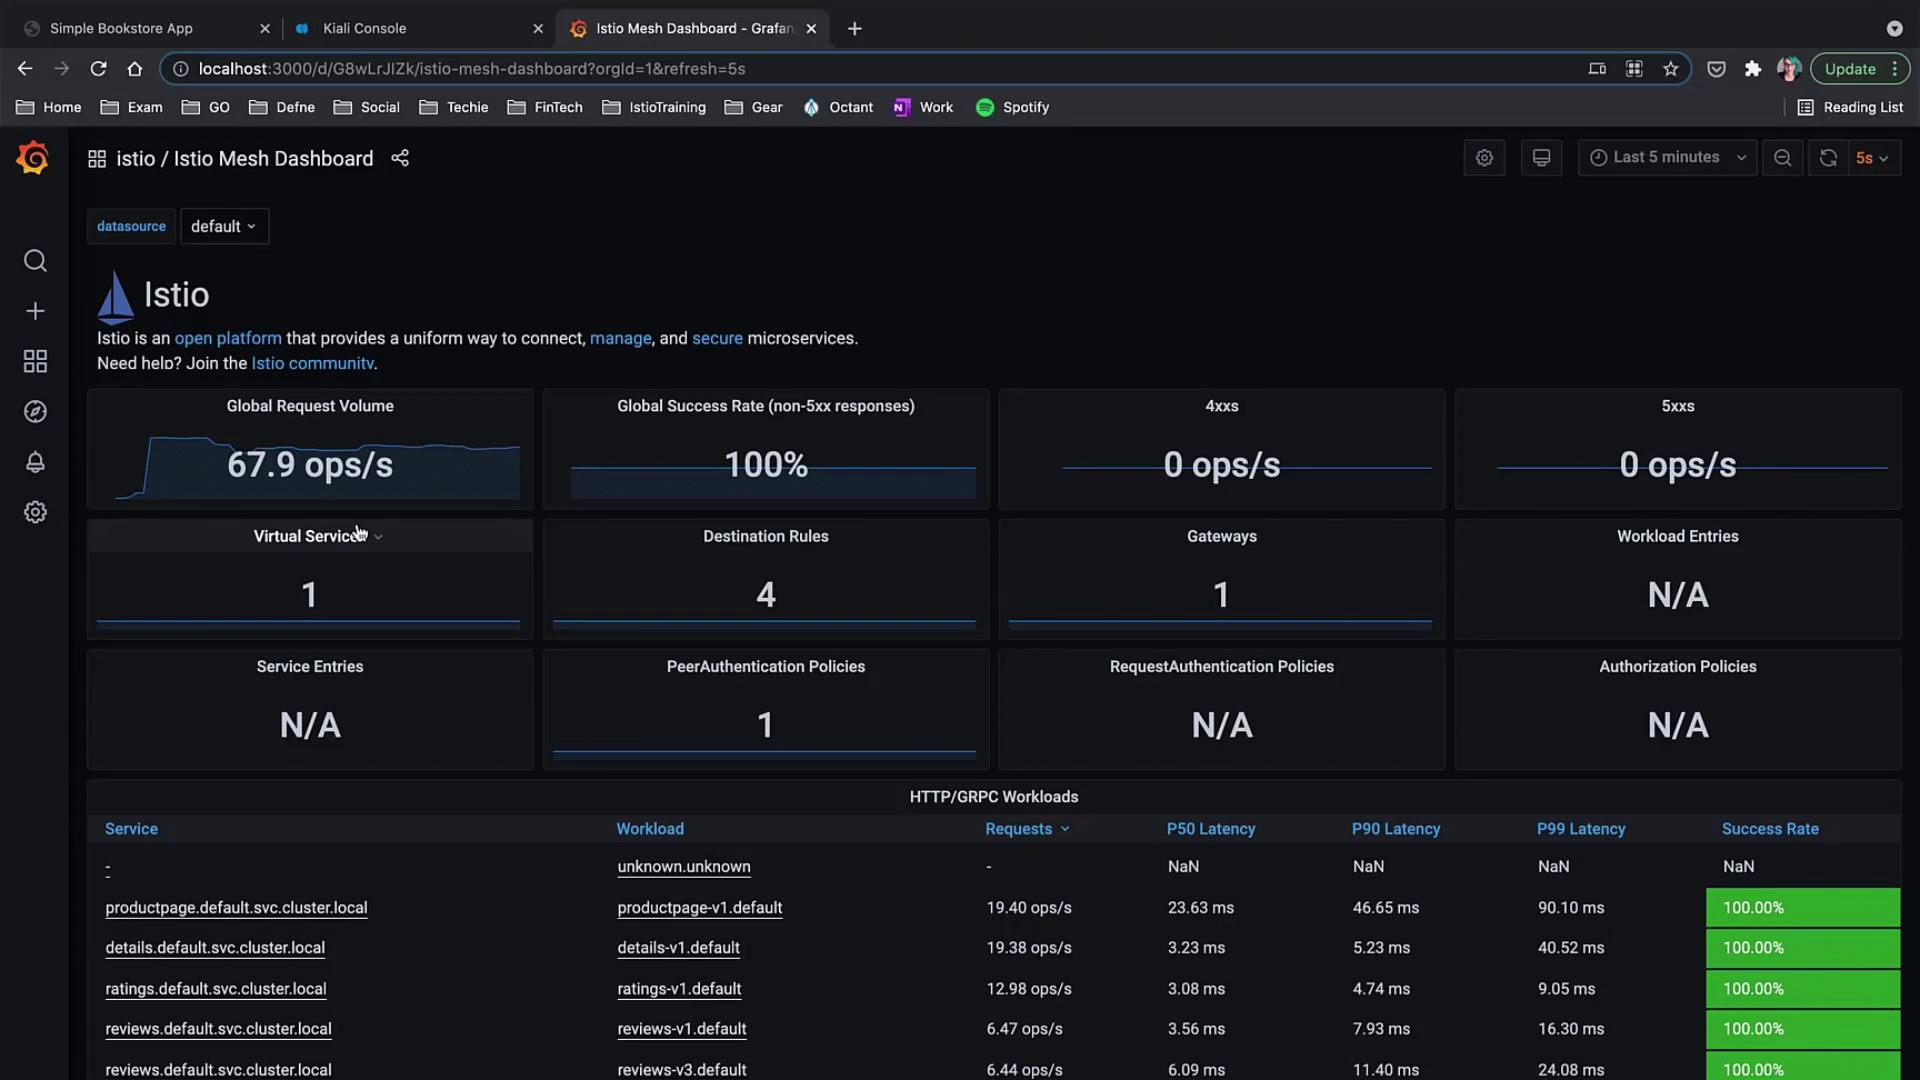
Istio Service Dashboard
For detailed monitoring, the service dashboard presents metrics from the Istio data plane. This dashboard is customizable to suit the unique requirements of your application.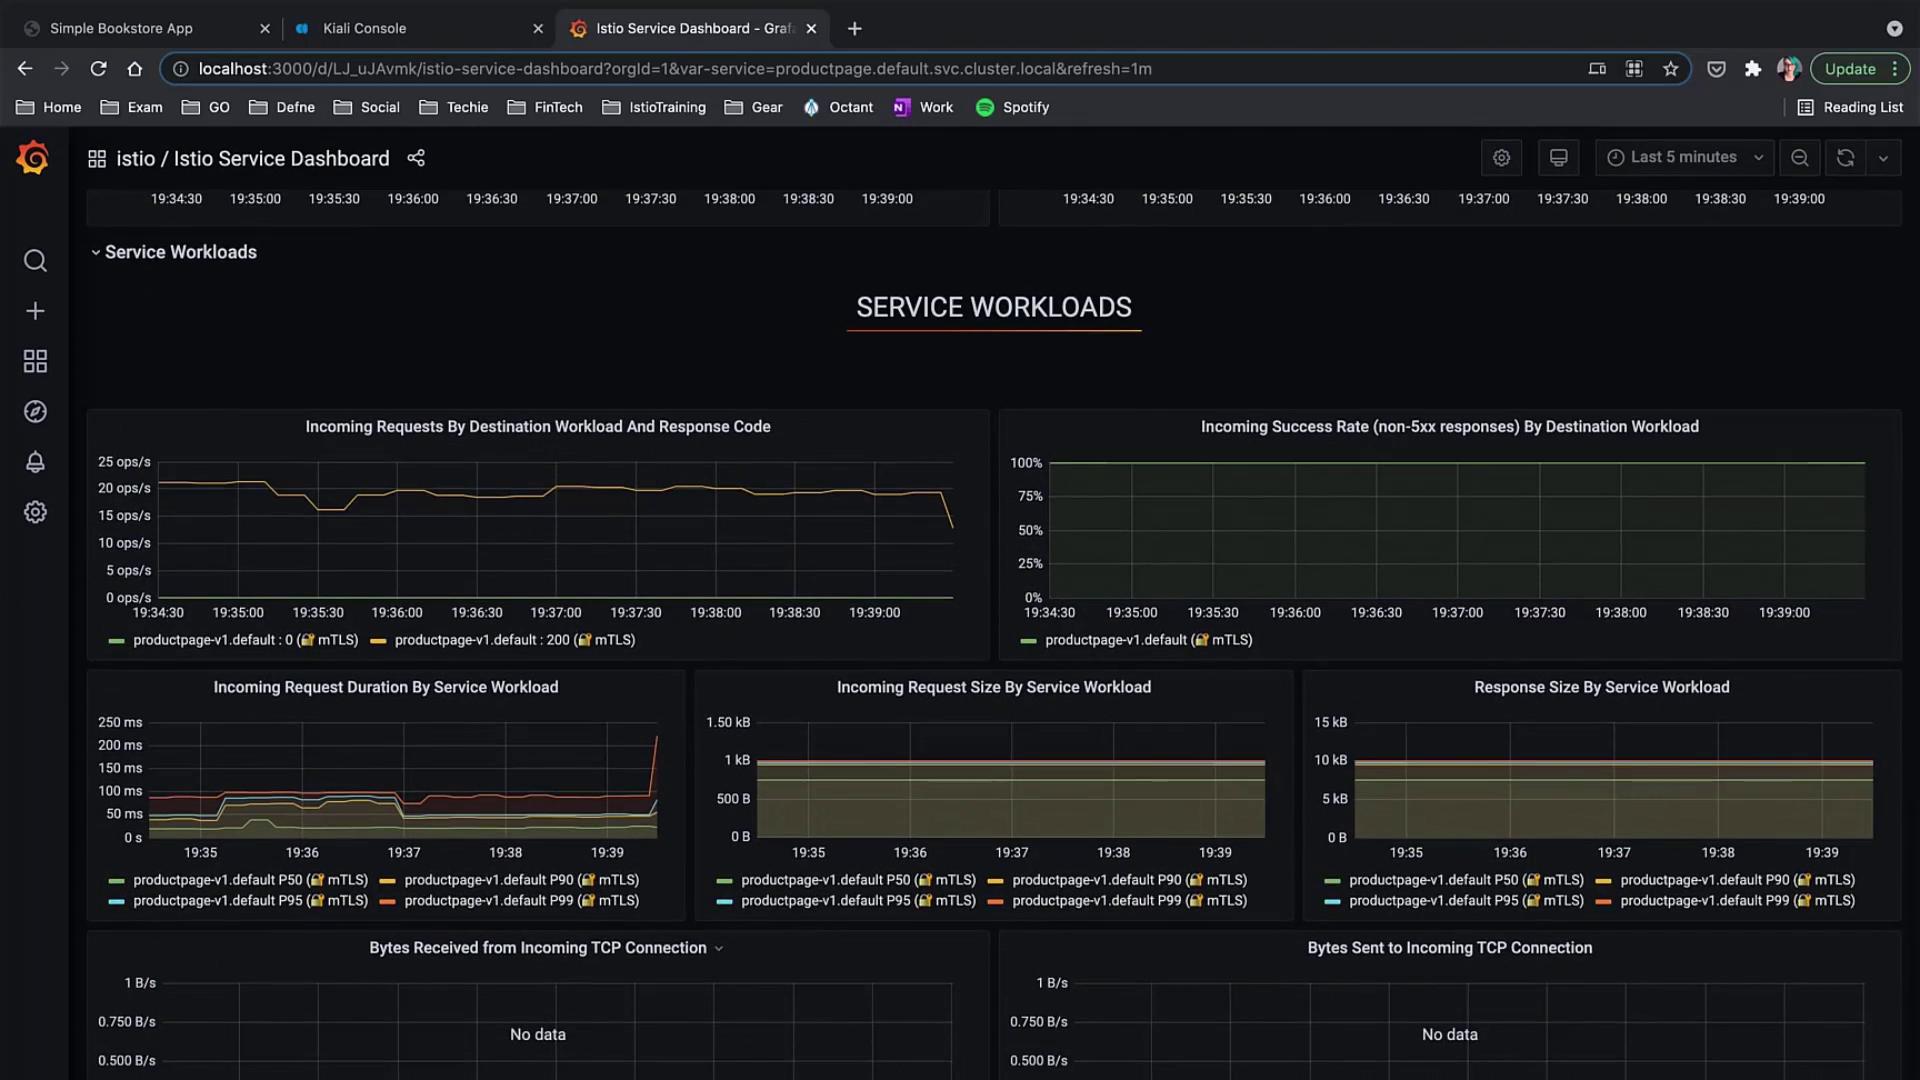
Istio Performance Dashboard
The Performance dashboard groups together metrics such as memory, vCPU, and disk usage over time for monitoring component performance within Istio.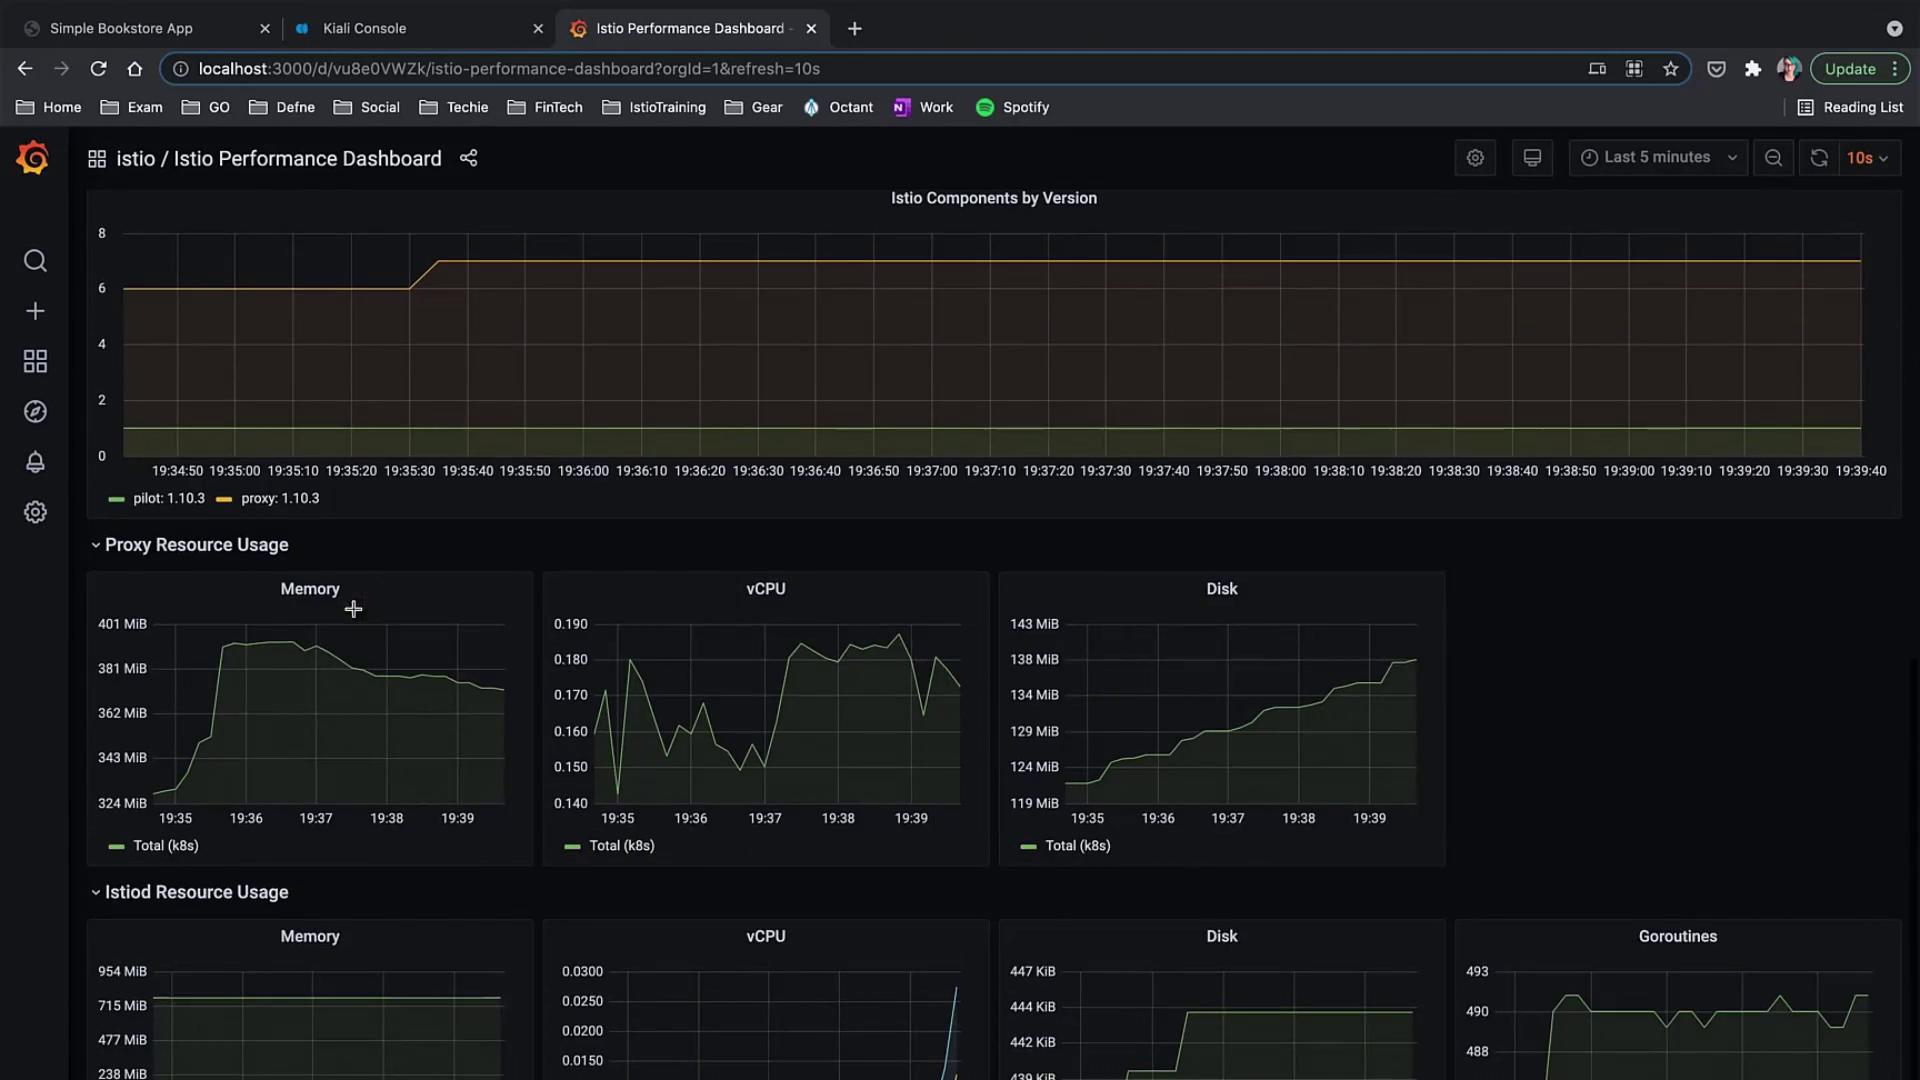
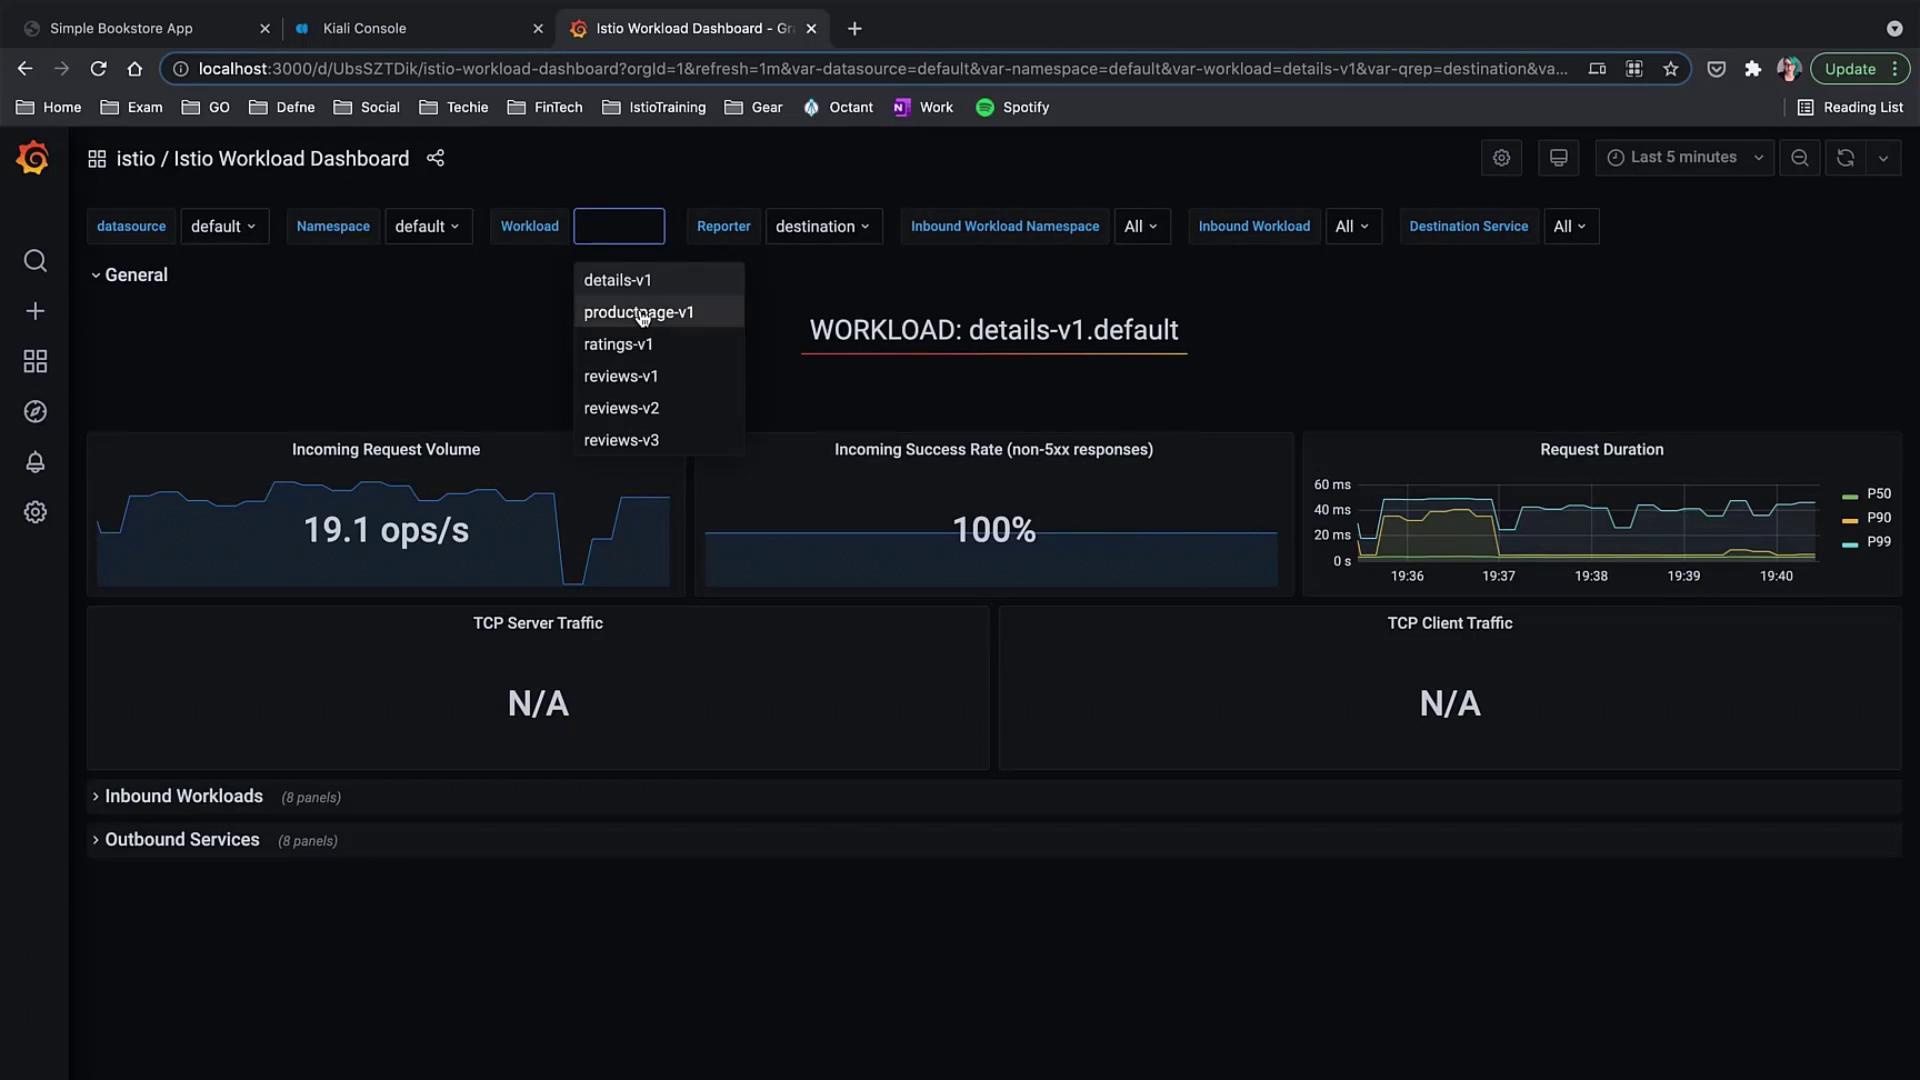
You can easily switch between dashboards using the primary menu. In addition to the dashboards covered here, explore the “Details” service view to filter and review all services in your mesh, access the Wasm Performance dashboard for WebAssembly metrics, and the Workload dashboard to focus on specific workloads.
Istio Workload Dashboard
The Istio Workload dashboard shows metrics such as incoming request volume, success rate, and request duration for selected workloads. Use the dropdown menus to filter metrics based on the workload you wish to inspect.