High-Level Architecture Overview
The Login App in this scenario serves two primary audiences:- Users – They interact with the app.
- Developers – They maintain and troubleshoot the application using logs and dashboards.
- User Interaction: When a user interacts with the Login App, it generates logs.
- Log Collection: Fluent Bit collects these logs and forwards them to Elasticsearch.
- Data Visualization: Kibana is used to build dashboards that display the log data, providing insights into app behavior and performance.
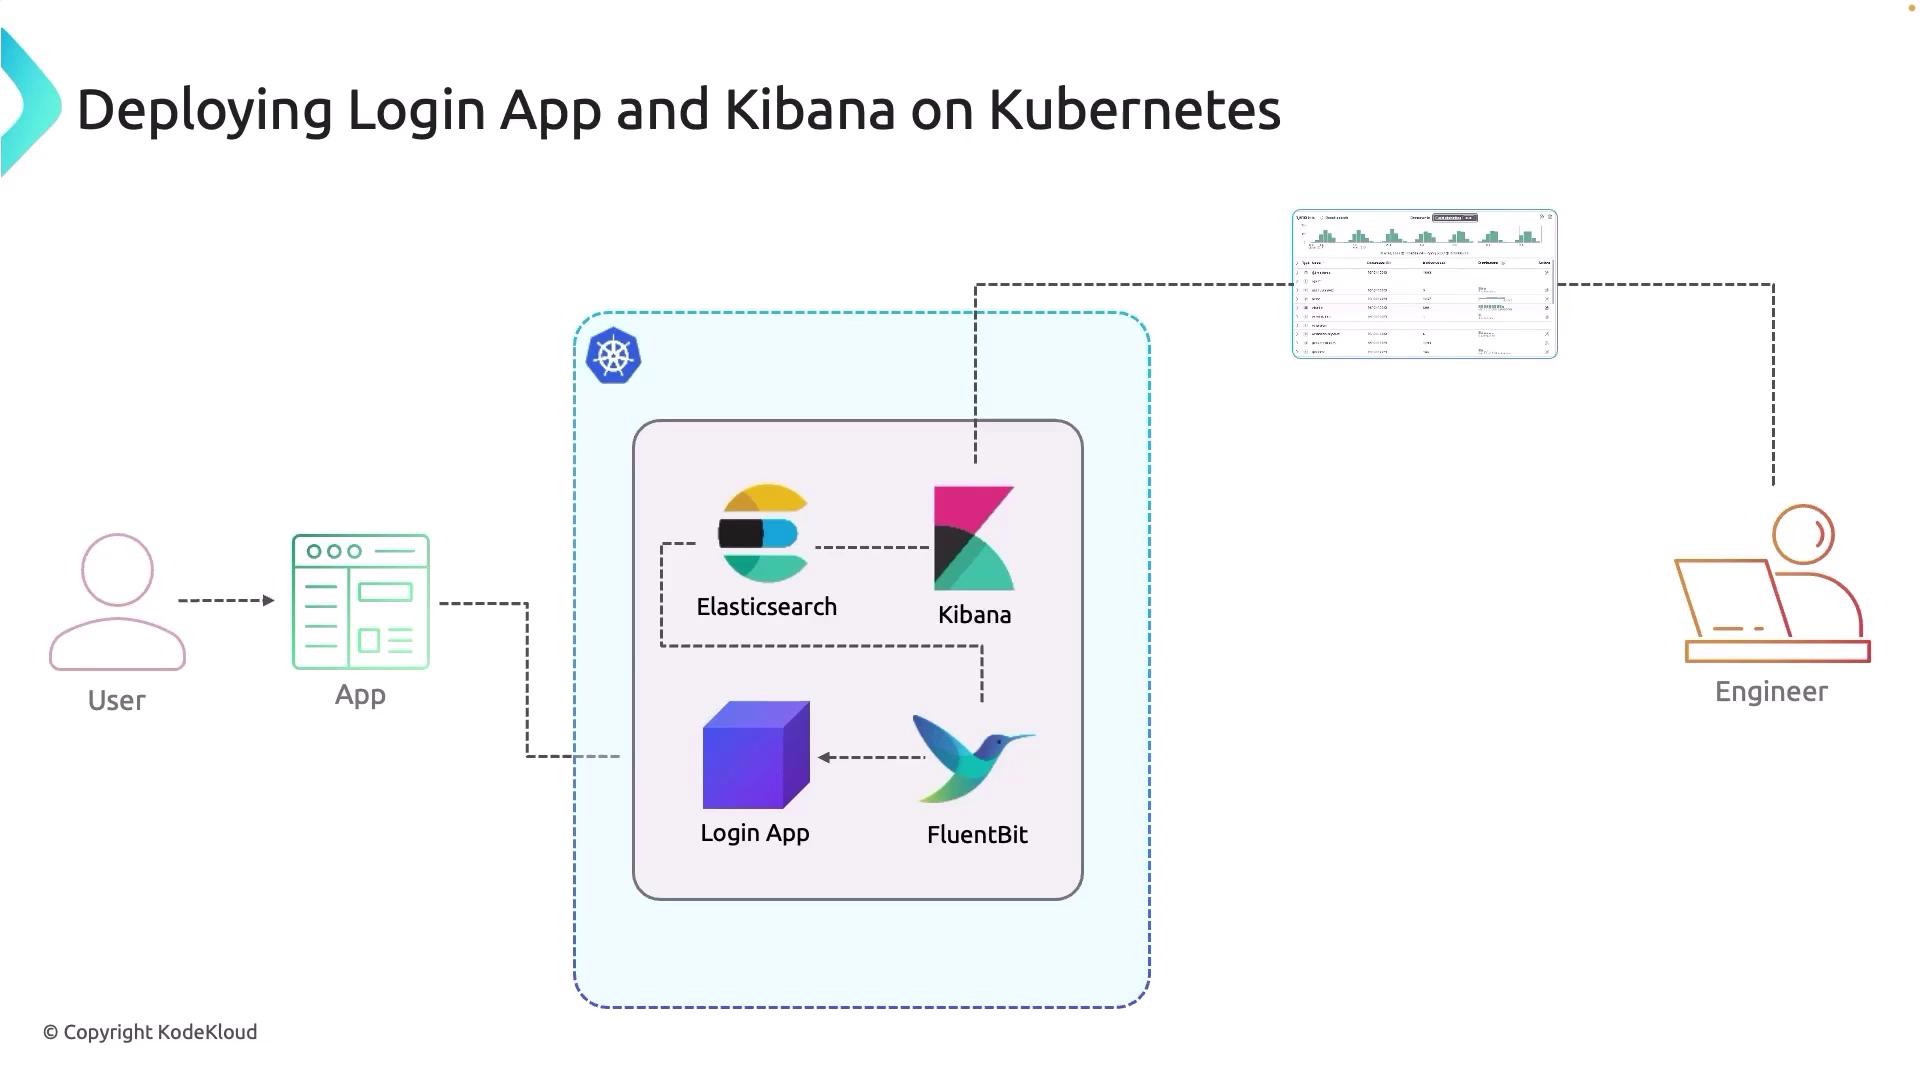
Each component in this architecture plays a crucial role in ensuring that every user action is logged and analyzed effectively.
Application Workflow and Logging Process
The following steps detail the end-to-end process:- User Interaction: Each action in the Login App generates a corresponding log entry.
- Fluent Bit Integration: Fluent Bit monitors the application logs and collects them.
- Log Forwarding: The collected logs are sent to the Elasticsearch cluster where they are stored and indexed.
- Dashboard Creation: Developers utilize Kibana to build dashboards and analyze the logs for performance monitoring and troubleshooting.
Ensure that Fluent Bit is properly configured to parse the logs according to your application’s log format to avoid data loss or misinterpretation.
Demo Walkthrough
In the next section, we will walk through the detailed demo which includes:- Building and deploying the Login App.
- Integrating Fluent Bit for centralized logging.
- Creating Kibana dashboards for real-time monitoring.