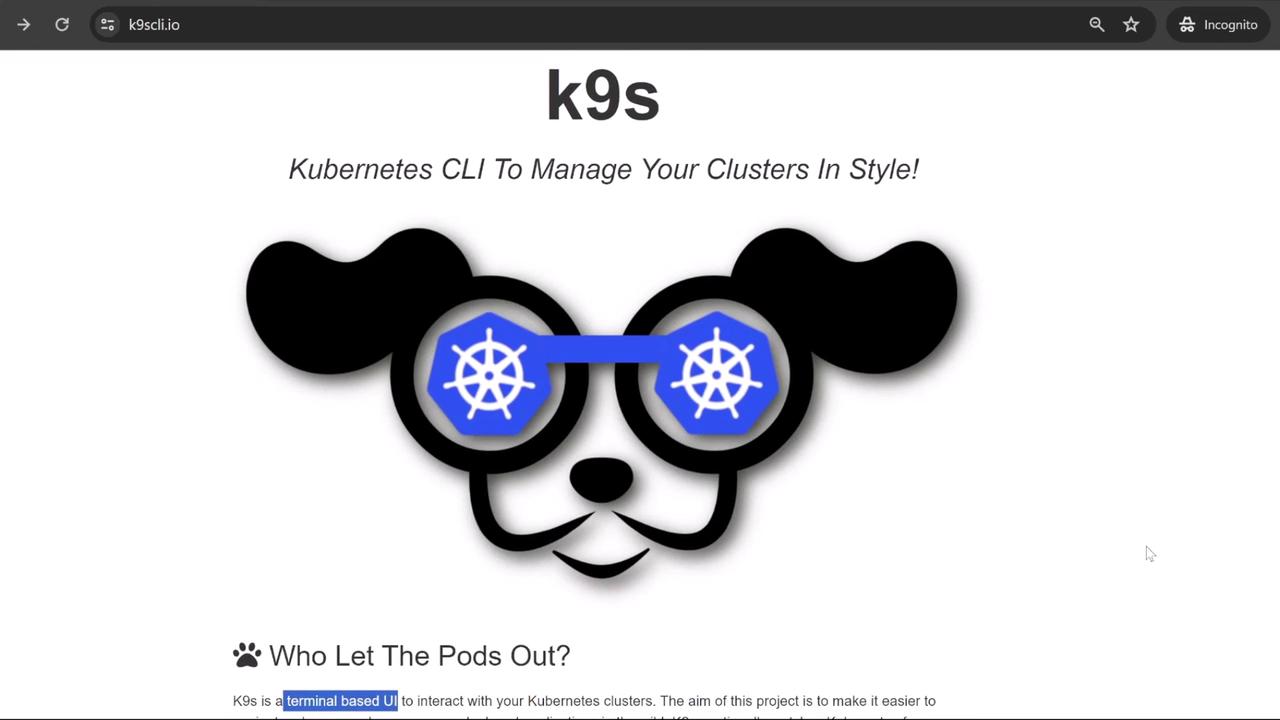
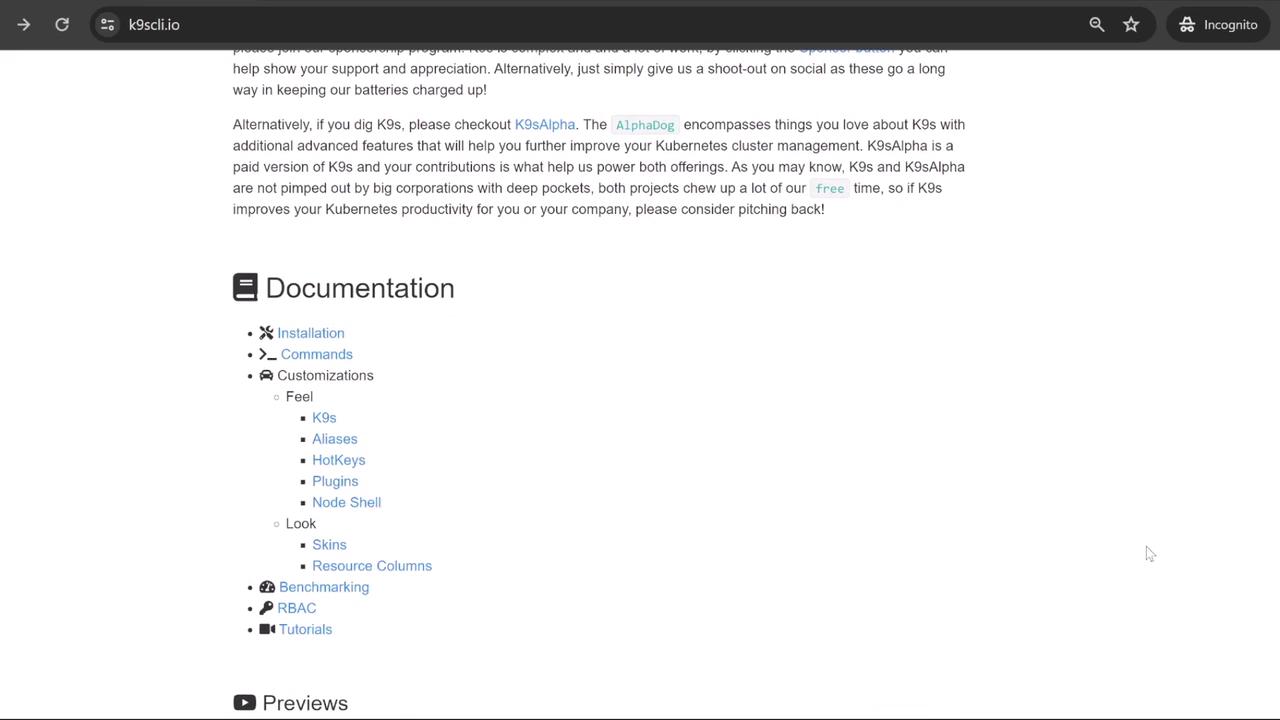
Hi everyone, In this lesson, we’re diving into k9s—one of the most efficient tools for managing your Kubernetes clusters. k9s is a terminal-based UI that provides almost all the capabilities of kubectl, but with a polished, interactive interface and a variety of shortcuts to boost your productivity. If you prefer working in the terminal over a web-based console, k9s is an excellent choice.Documentation Index
Fetch the complete documentation index at: https://notes.kodekloud.com/llms.txt
Use this file to discover all available pages before exploring further.
Connecting to Your Cluster
Before you start, make sure your kubeconfig is set to the correct context. Launch k9s with the following command:- Top Left: Displays cluster details such as context name, cluster name, Kubernetes version, and, if available, CPU/memory metrics.
- Middle: Shows a list of namespaces, dynamically updating based on your usage.
- Right: Lists available keyboard shortcuts corresponding to the selected resource (e.g., D for describe, Ctrl-D for delete, E for edit).
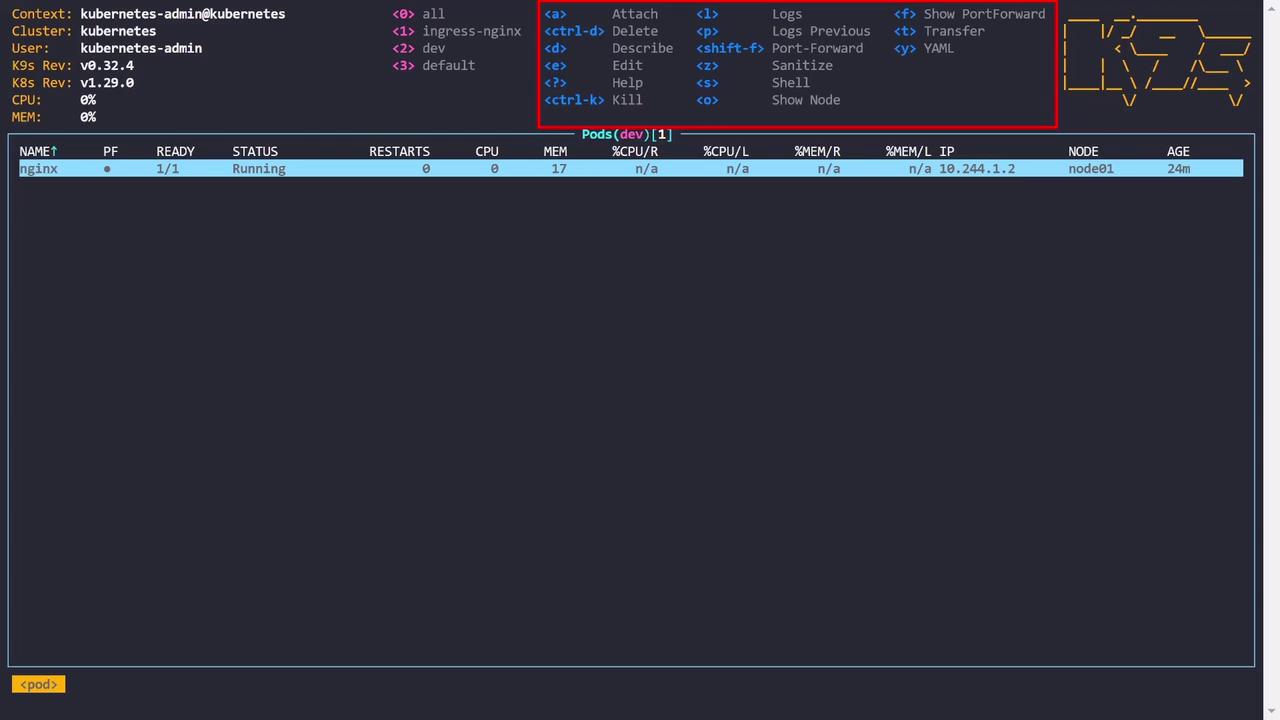
The navigation shortcuts in k9s resemble Vim/VI commands. If you’re not familiar with Vim, consider spending a few minutes learning its basic commands to enhance your k9s experience.
Navigating Resources
Viewing Pods Across All Namespaces
If activity in your current namespace (e.g., dev) seems light, press the numeral zero (0) to view pods across all namespaces.Viewing Deployments
To inspect Deployments, press the colon (:) key, type “Deployment,” and hit Enter. This will display all deployments across namespaces. For example:Viewing Services
To view services, press the colon (:) key and type “service” (or “svc”). This is equivalent to runningkubectl get services -a. For example:
Exploring Pods and Logs
When you select a pod, the available key bindings change to actions specific to that resource. For example, press L to view the pod logs. In log view, these shortcuts become available:- S: Stop autoscrolling.
- T: Toggle timestamps.
- /: Search within the logs (e.g., search for “kube-system”).
- 2 or 3: Filter logs from the last minute or five minutes, respectively.
- Escape: Exit the log view.
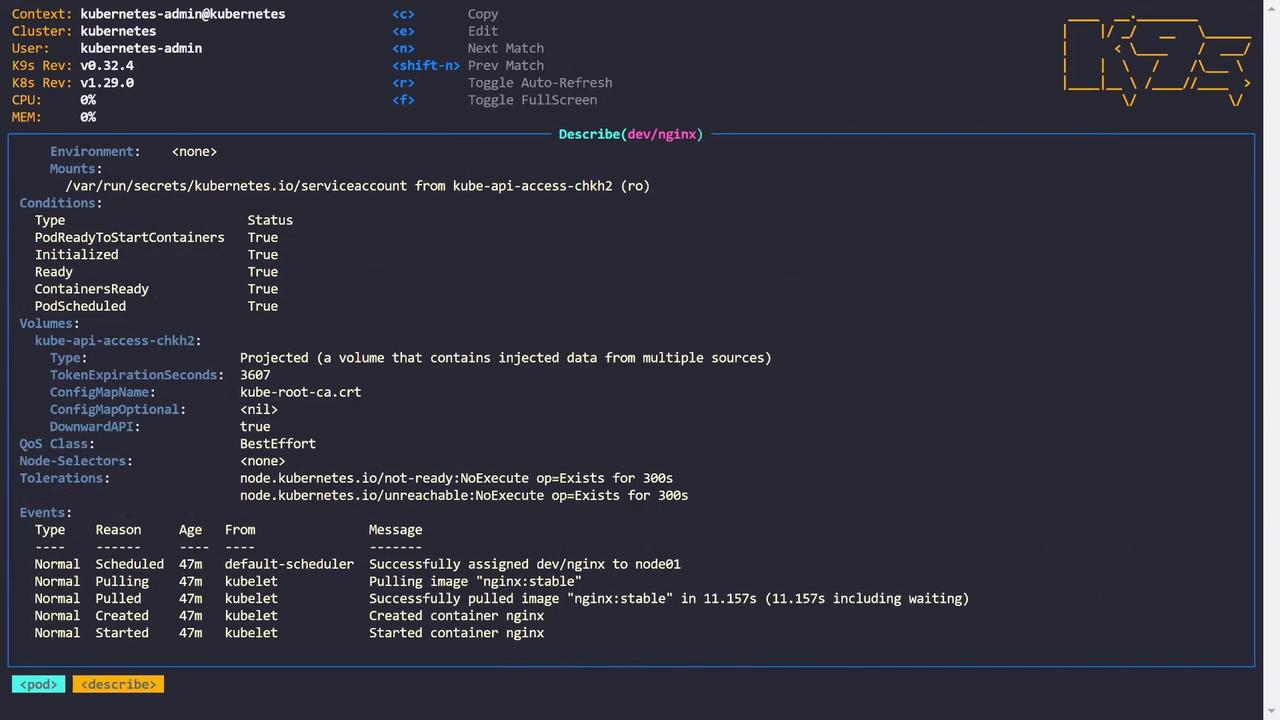
kubectl describe). Additionally, pressing S can launch a shell within a container, simplifying command execution.
Editing and Scaling Deployments
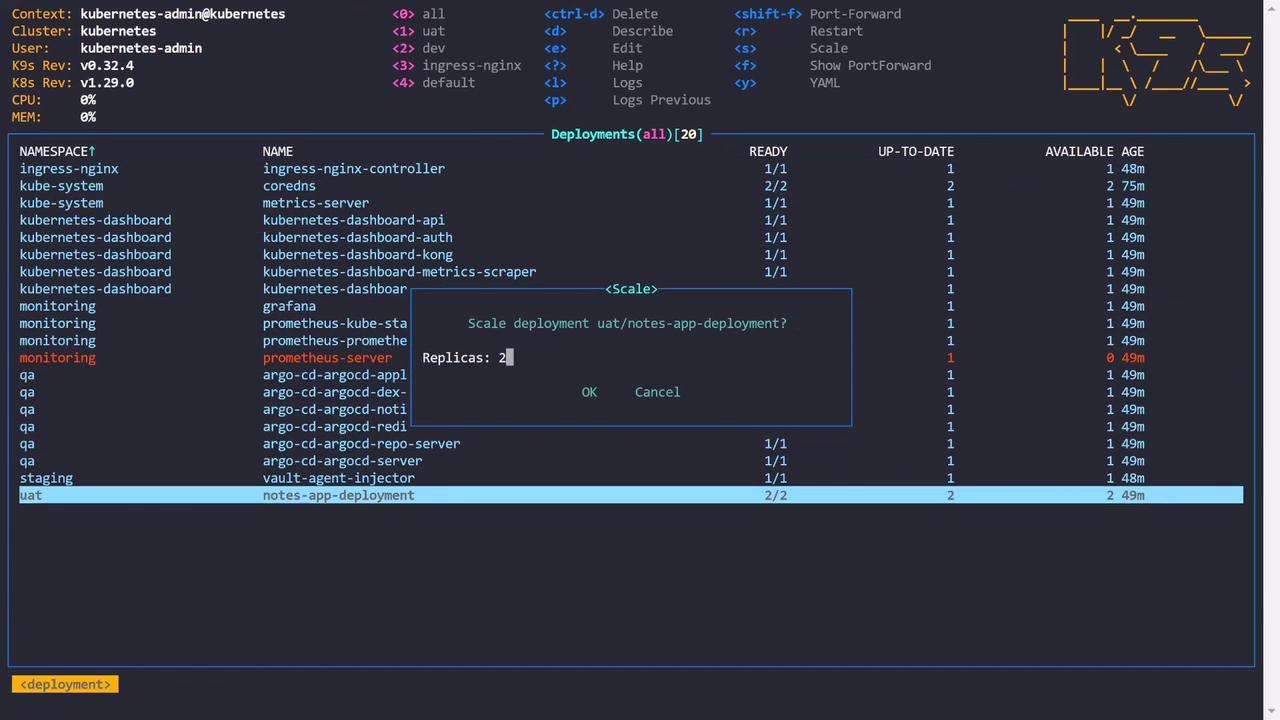
Switch to deployments to access different shortcuts. Press E to open an editor and modify the configuration for a deployment. For instance:By default, k9s uses Vim as its editor, but you can configure it to use Nano or another editor of your choice.
Managing Services and Sorting
When viewing services, k9s offers sorting options to help you quickly locate the desired resource. For example, press Shift+A to sort services by age, and press the same key again to reverse the order. Similarly, press Shift+N to sort services by name.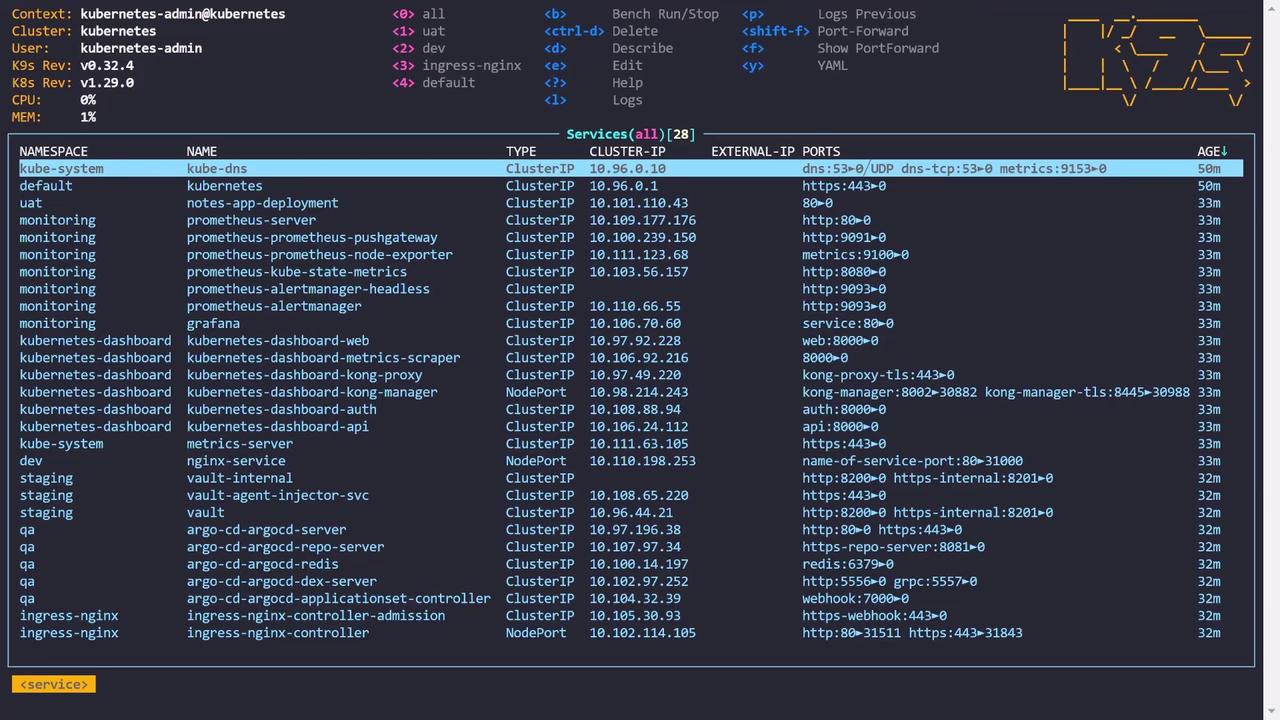
Visualizing RBAC
k9s also provides a unique perspective on role-based access control (RBAC). By inspecting resources like role bindings, you can view detailed permission visualizations. These visualizations illustrate which actions (e.g., get, list, watch, create, update) are permitted on resources like ConfigMaps and highlight any restrictions (e.g., patch, delete).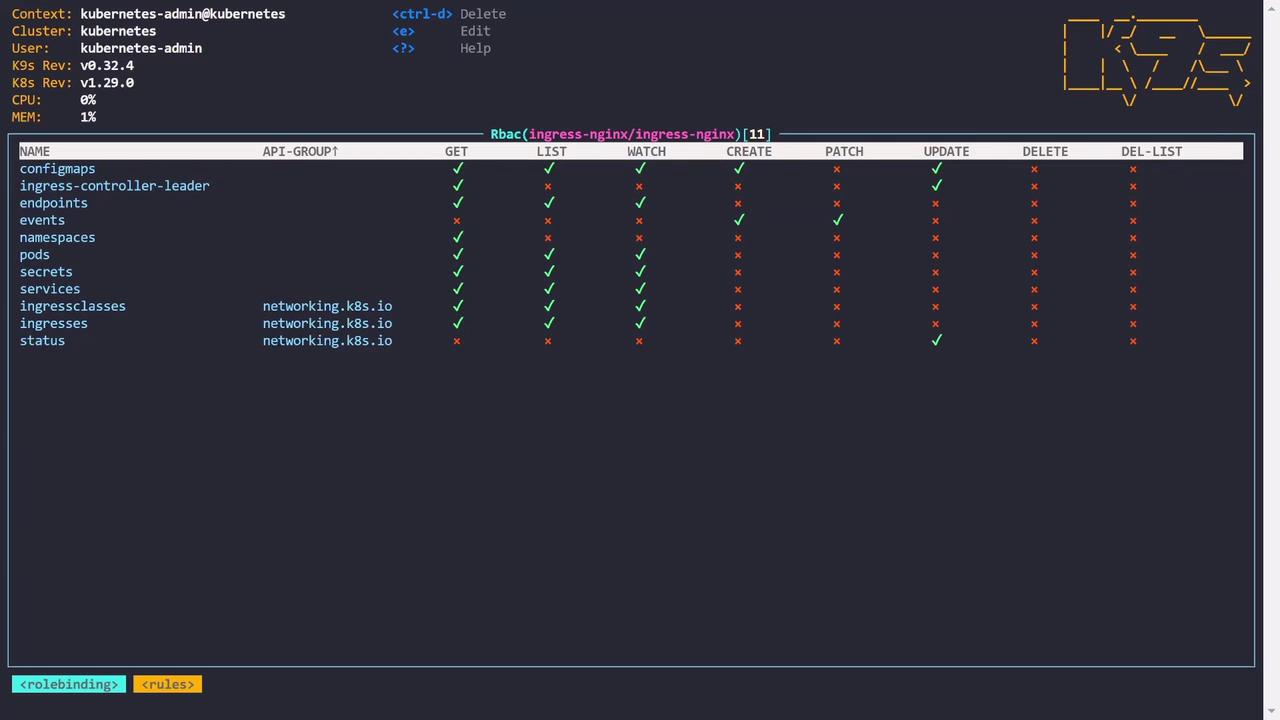
Custom Dashboards and Resource Overviews
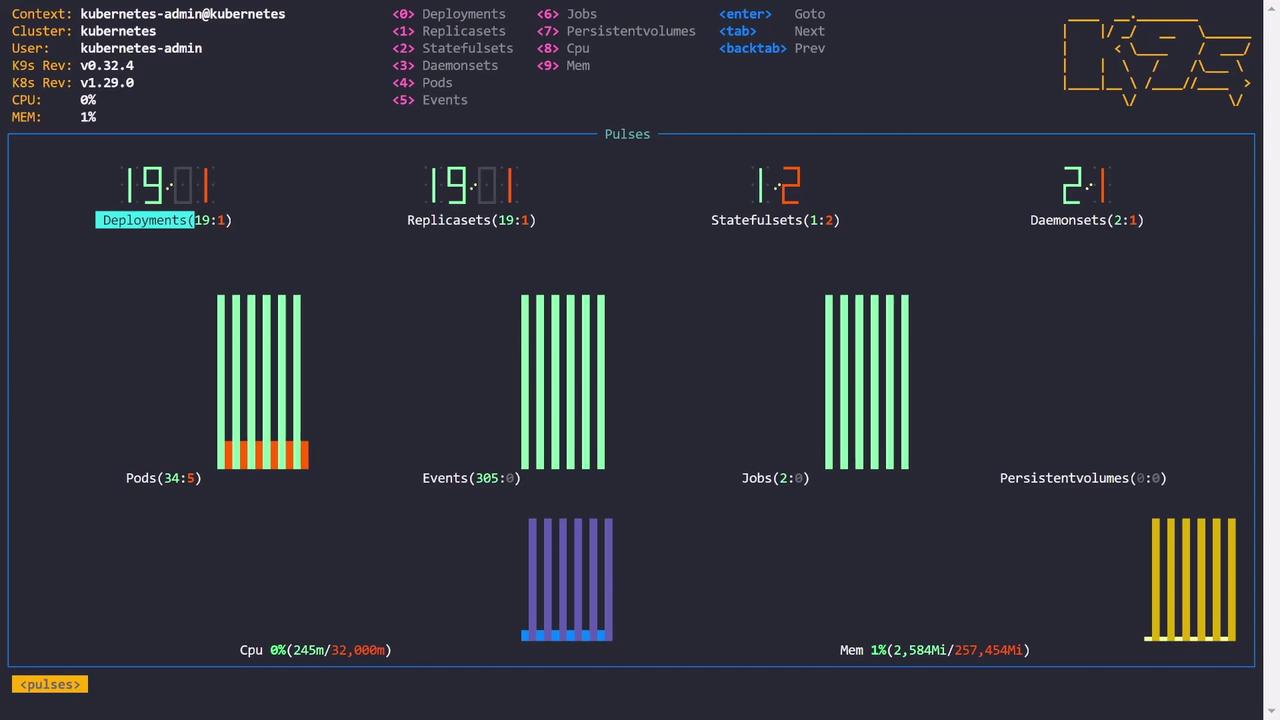
k9s includes several dashboards to provide a comprehensive overview of your Kubernetes environment:- Deployments Dashboard: View summaries (e.g., 20 deployments with 19 ready and one pending).
- Pods Dashboard: Check real-time statistics (e.g., 39 pods with 34 ready and 5 facing issues).
- Metrics Dashboard: Access real-time CPU and memory metrics if a metrics server is installed.
- X-Ray Dashboard: Dive deep into resource relationships, such as the connections between deployments, pods, containers, namespaces, and service accounts.
Final Thoughts
This lesson provided an overview of k9s, highlighting its intuitive navigation shortcuts and powerful features for:- Viewing logs and detailed resource descriptions.
- Editing configurations and scaling deployments.
- Exploring RBAC permissions with clear visualizations.
- Managing services, sorting resources, and using custom dashboards.