Demo Small to Medium Datasets Data Transformation Pandas Polars
This hands-on tutorial demonstrates data transformation with Pandas, covering data import, quality checks, cleaning, and preparation for machine learning tasks.
Welcome to this hands-on tutorial demonstrating data transformation with Pandas. In this guide, you’ll learn how to import a mock CSV dataset, perform data quality checks, handle missing values, and transform complex JSON data—all to prepare your dataset for downstream machine learning (ML) tasks.
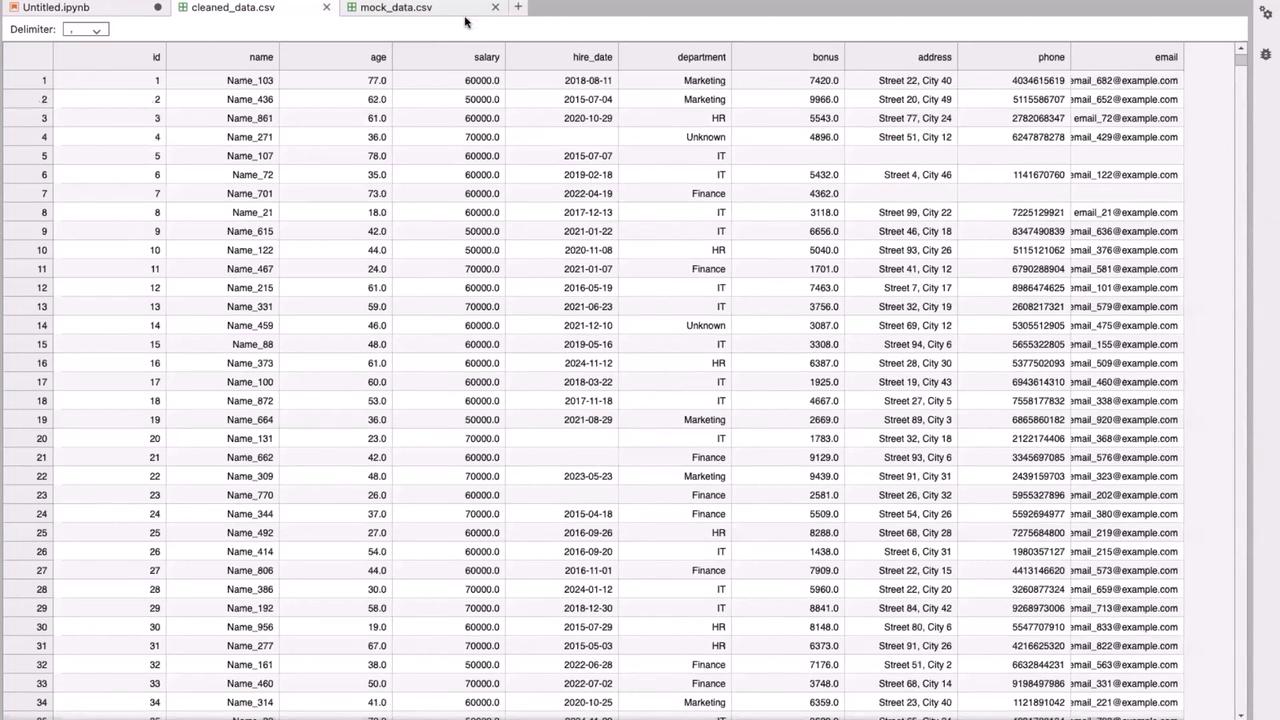
Begin by launching your Jupyter Notebook and loading the mock CSV file into a DataFrame. This CSV dataset is destined for your ML model, but first, its quality must be verified.
Before diving into transformations, always inspect your data using basic functions such as head(), info(), and describe().
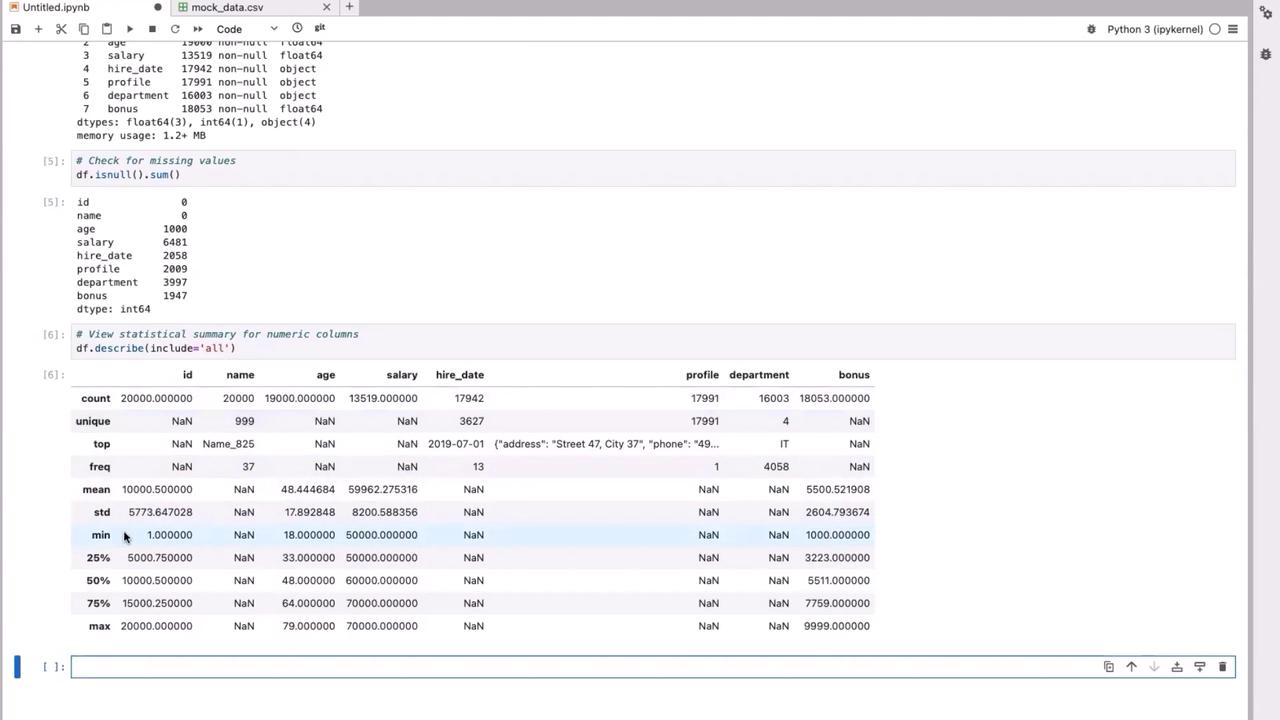
Check the DataFrame summary to inspect data types and count non-null entries:
# Display DataFrame summary and missing value countsdf.info()df.isnull().sum()
Notice that columns like “hire date,” “profile,” and “department” might have null values, while numeric columns such as ‘salary’ are stored as float64.For a statistical summary (which includes non-numeric columns), run:
Identify rows with missing numeric values such as ‘age’ or ‘salary’:
# Identify and display records with missing age and salaryprint("Records with missing age:")print(df[df['age'].isnull()][['age', 'salary', 'department']])print("\nRecords with missing salary:")print(df[df['salary'].isnull()][['age', 'salary', 'department']])
A common strategy is to fill missing values with the median value:
# Calculate median values for age and salaryage_median = df['age'].median()salary_median = df['salary'].median()print("\nMedian values used:")print(f"Age median: {age_median}")print(f"Salary median: {salary_median}")# Fill missing numeric values with the mediandf['age'] = df['age'].fillna(age_median)df['salary'] = df['salary'].fillna(salary_median)
Confirm the imputation:
print("\nMissing values after numeric cleaning:")print(df.isnull().sum())
3. Transforming Complex JSON Data from the “profile” Column
The “profile” column contains JSON strings with structured details like address, phone number, and email. Transform these into Python dictionaries and extract the individual fields as separate columns.
If the original “profile” column is no longer needed, drop it:
df.drop(columns=['profile'], inplace=True)# Save the cleaned data to CSV for further processingdf.to_csv("cleaned_data.csv", index=False)print("\nCleaned data saved to 'cleaned_data.csv'")
For instance, you can create a new column “address_length” to verify that addresses meet a certain length requirement:
df = pd.read_csv("cleaned_data.csv")# Calculate the length of each addressdf['address_length'] = df['address'].apply(lambda x: len(str(x)))print("Sample data after adding 'address_length':")print(df[['address', 'address_length']].head(), "\n")
Next, categorize salaries into buckets such as low, medium, and high:
# Define salary bins and labelsbins = [0, 50000, 70000, 100000]labels = ['low', 'medium', 'high']# Create a new column for salary categorizationdf['salary_category'] = pd.cut(df['salary'], bins=bins, labels=labels, include_lowest=True)print("Sample data after adding 'salary_category':")print(df[['salary', 'salary_category']].head(), "\n")
Aggregate key metrics by grouping data by the ‘department’ column:
# Group data by department and compute mean salary and agesummary_report = df.groupby('department').agg({ 'salary': 'mean', 'age': 'mean'}).reset_index()# Rename columns for claritysummary_report.rename(columns={'salary': 'average_salary', 'age': 'average_age'}, inplace=True)print("Summary report by department:")print(summary_report)
Grouping and aggregation help in identifying trends and outliers within each department, which is critical for further ML model tuning.
In this tutorial, we covered the following steps to transform raw data into actionable insights for machine learning pipelines:
Explored the dataset using Pandas functions such as head(), info(), isnull(), and describe().
Cleaned missing numeric values by imputing medians and handled missing categorical data with placeholders.
Transformed a complex JSON column into separate, meaningful columns.
Derived new columns, including address length and salary categories, to provide additional insights.
Grouped and aggregated data by department to summarize key metrics.
These transformation practices are crucial when preparing your data for scalable ML models, especially in real-world scenarios with large datasets.Thank you for following this guide. For more information on data transformation and ML pipeline best practices, explore additional resources such as Pandas Documentation and Kaggle Learn.