

What you’ll get
- Real-time, web-based log streaming across pods and containers with Kubetail
- A full metrics & alerting stack with Prometheus, Alertmanager, Grafana, and exporters via kube-prometheus-stack
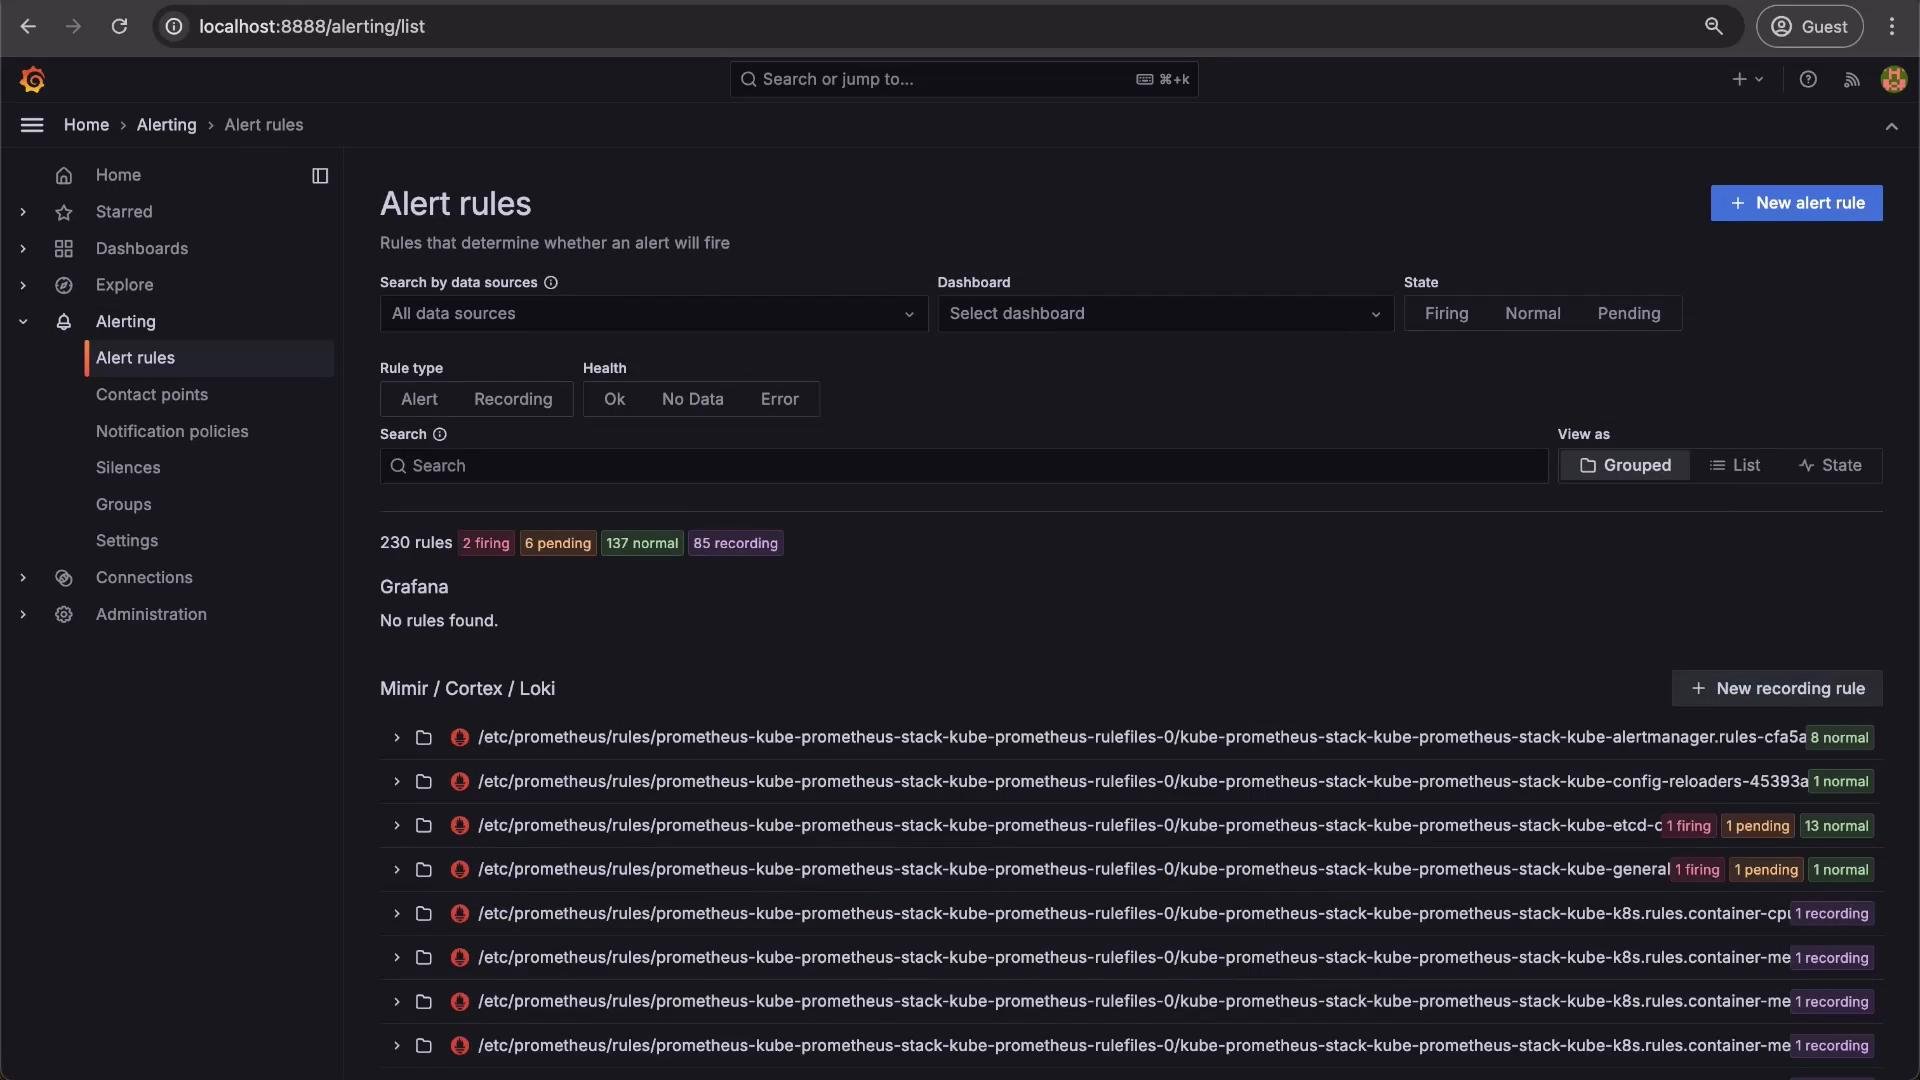
- Pre-configured dashboards and alerting rules that work out of the box
Kubetail: real-time log viewer
Kubetail (as packaged by Glasskube) provides a web UI for streaming and filtering logs across your cluster in real time. It’s particularly helpful for troubleshooting multi-pod, multi-container applications.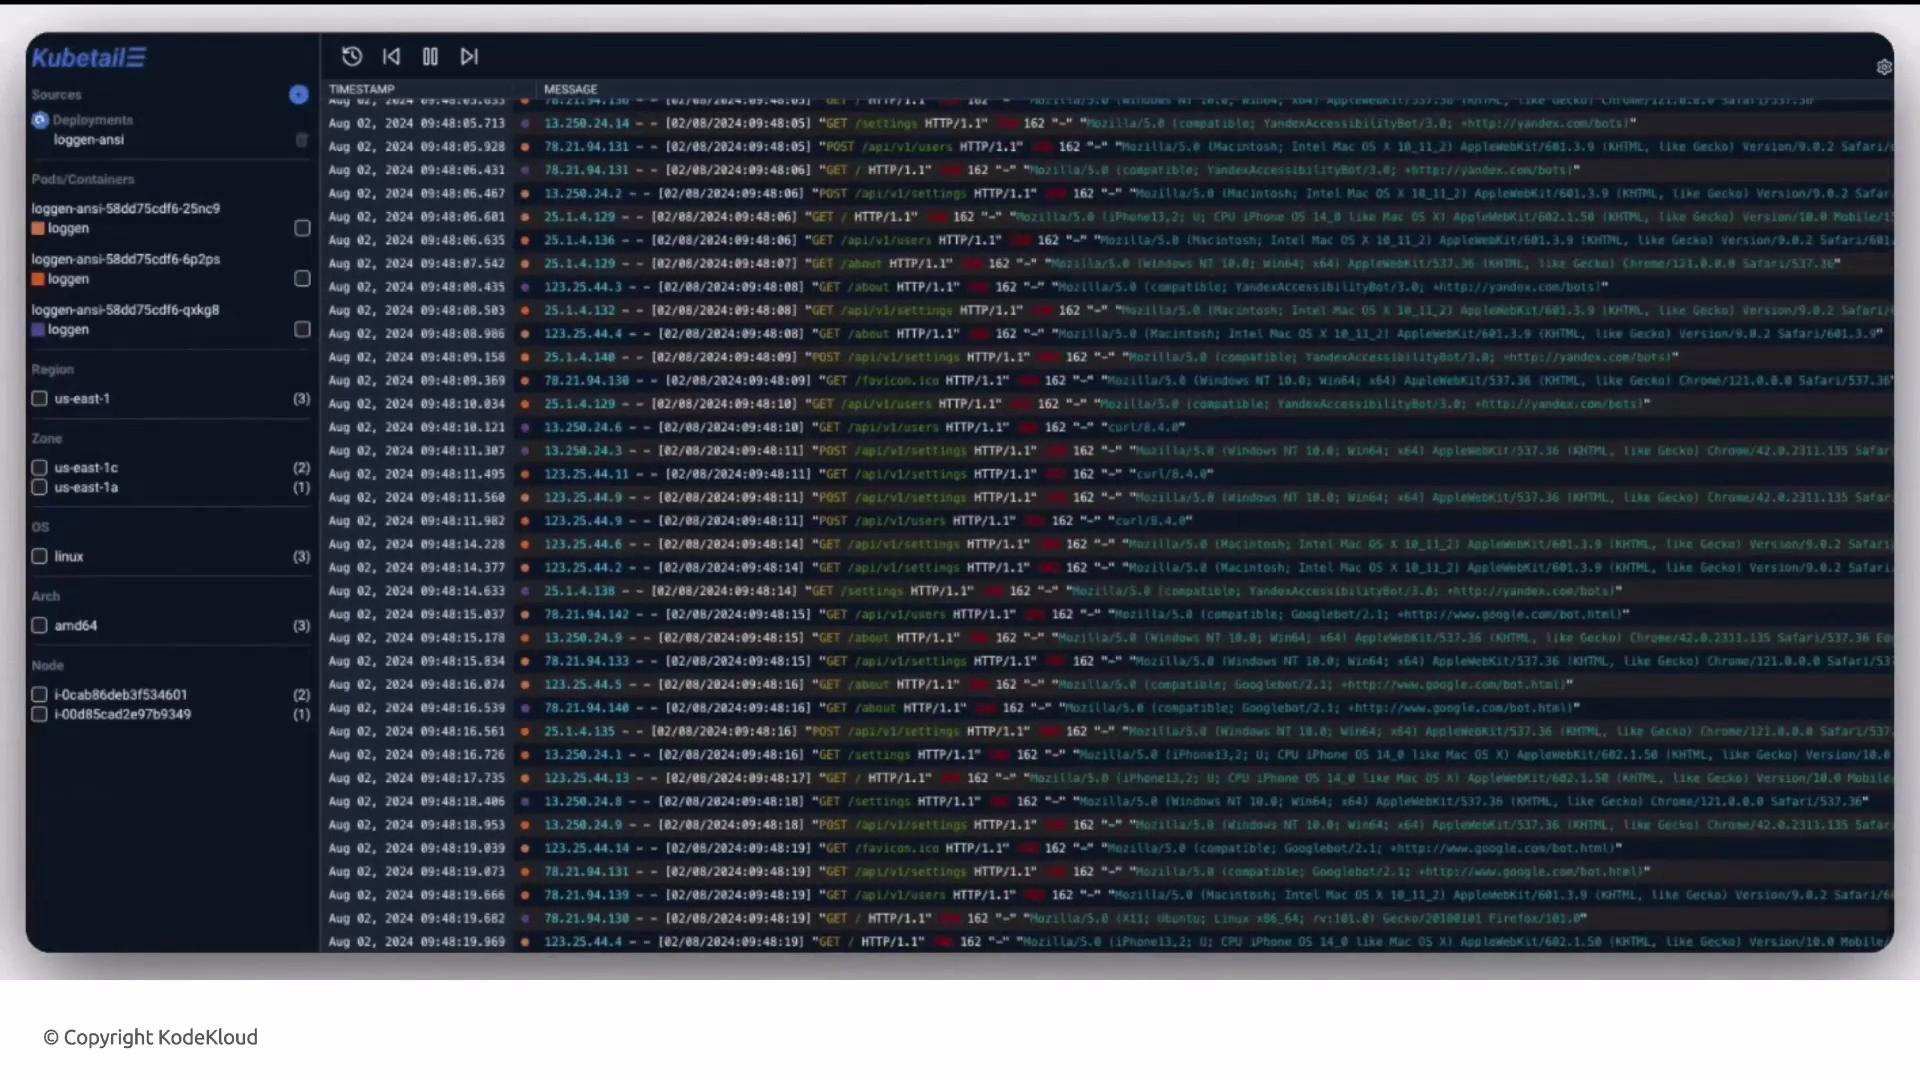
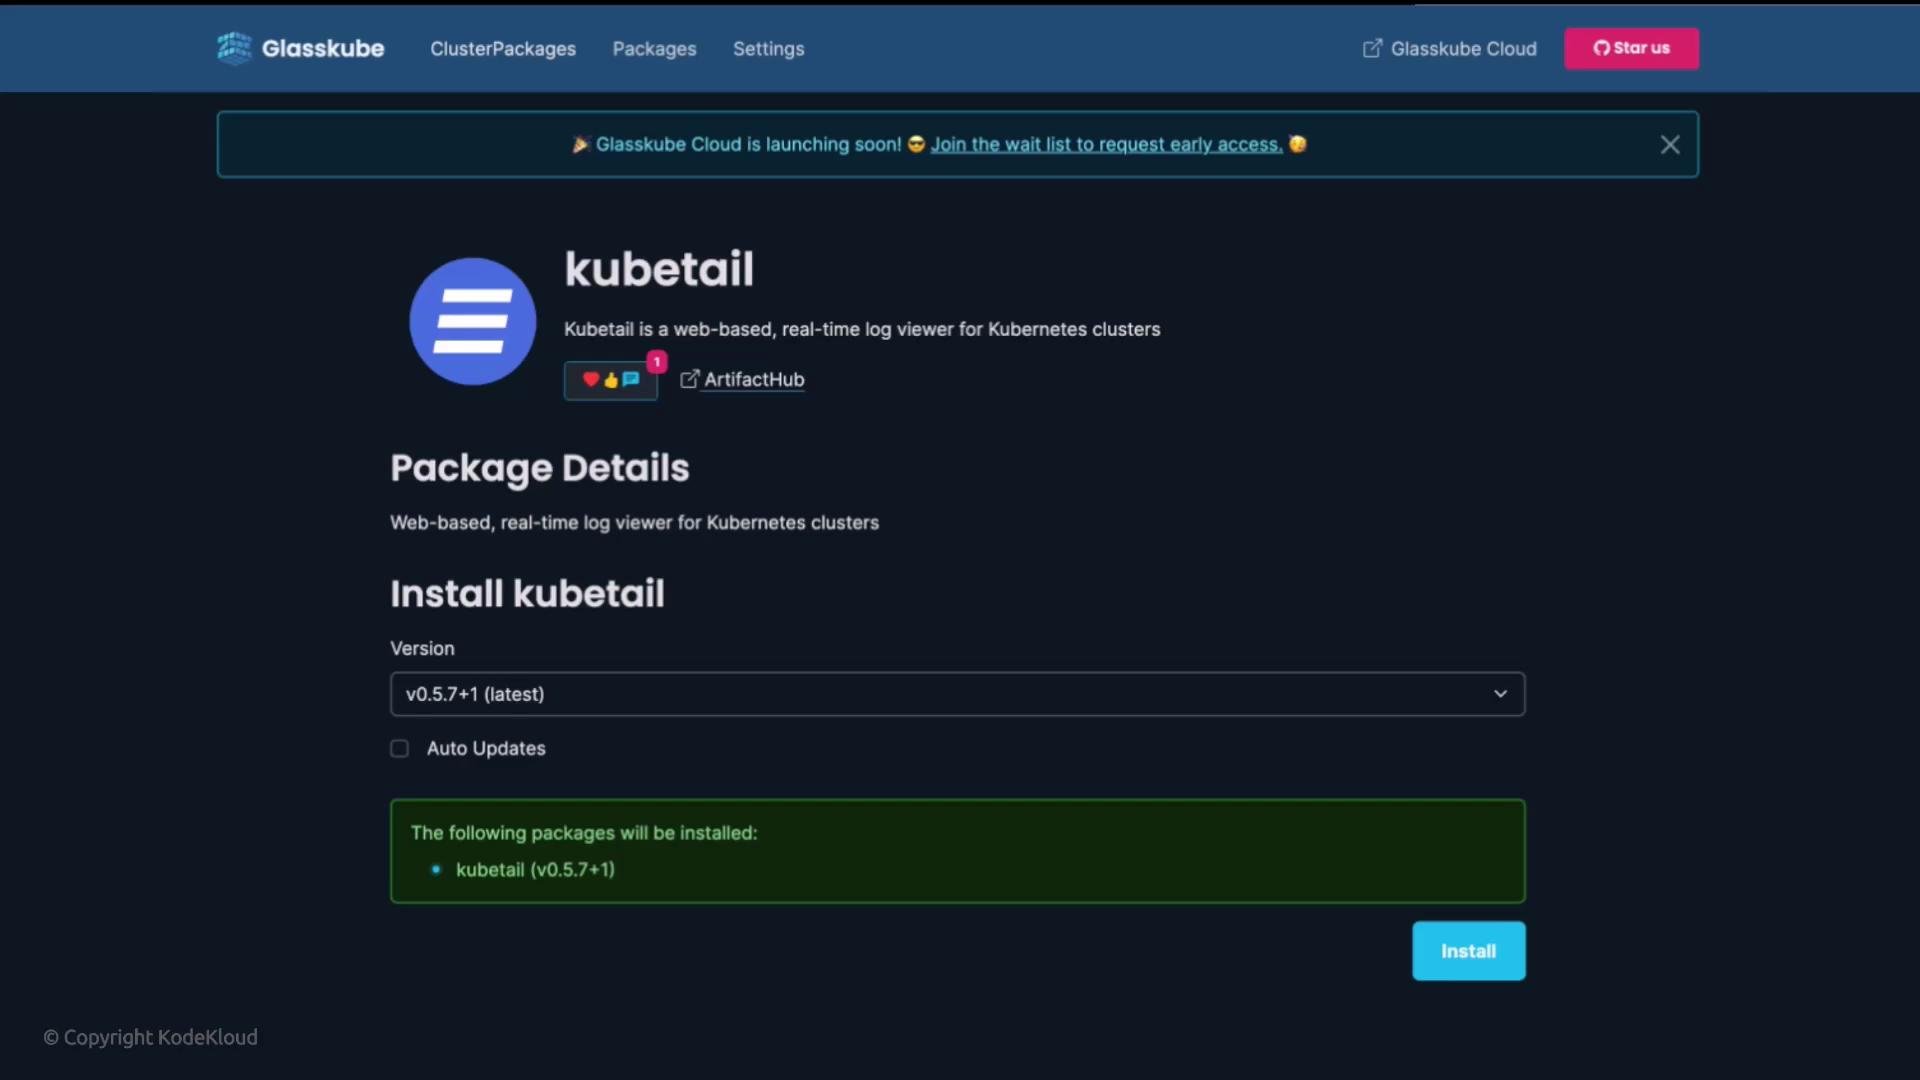
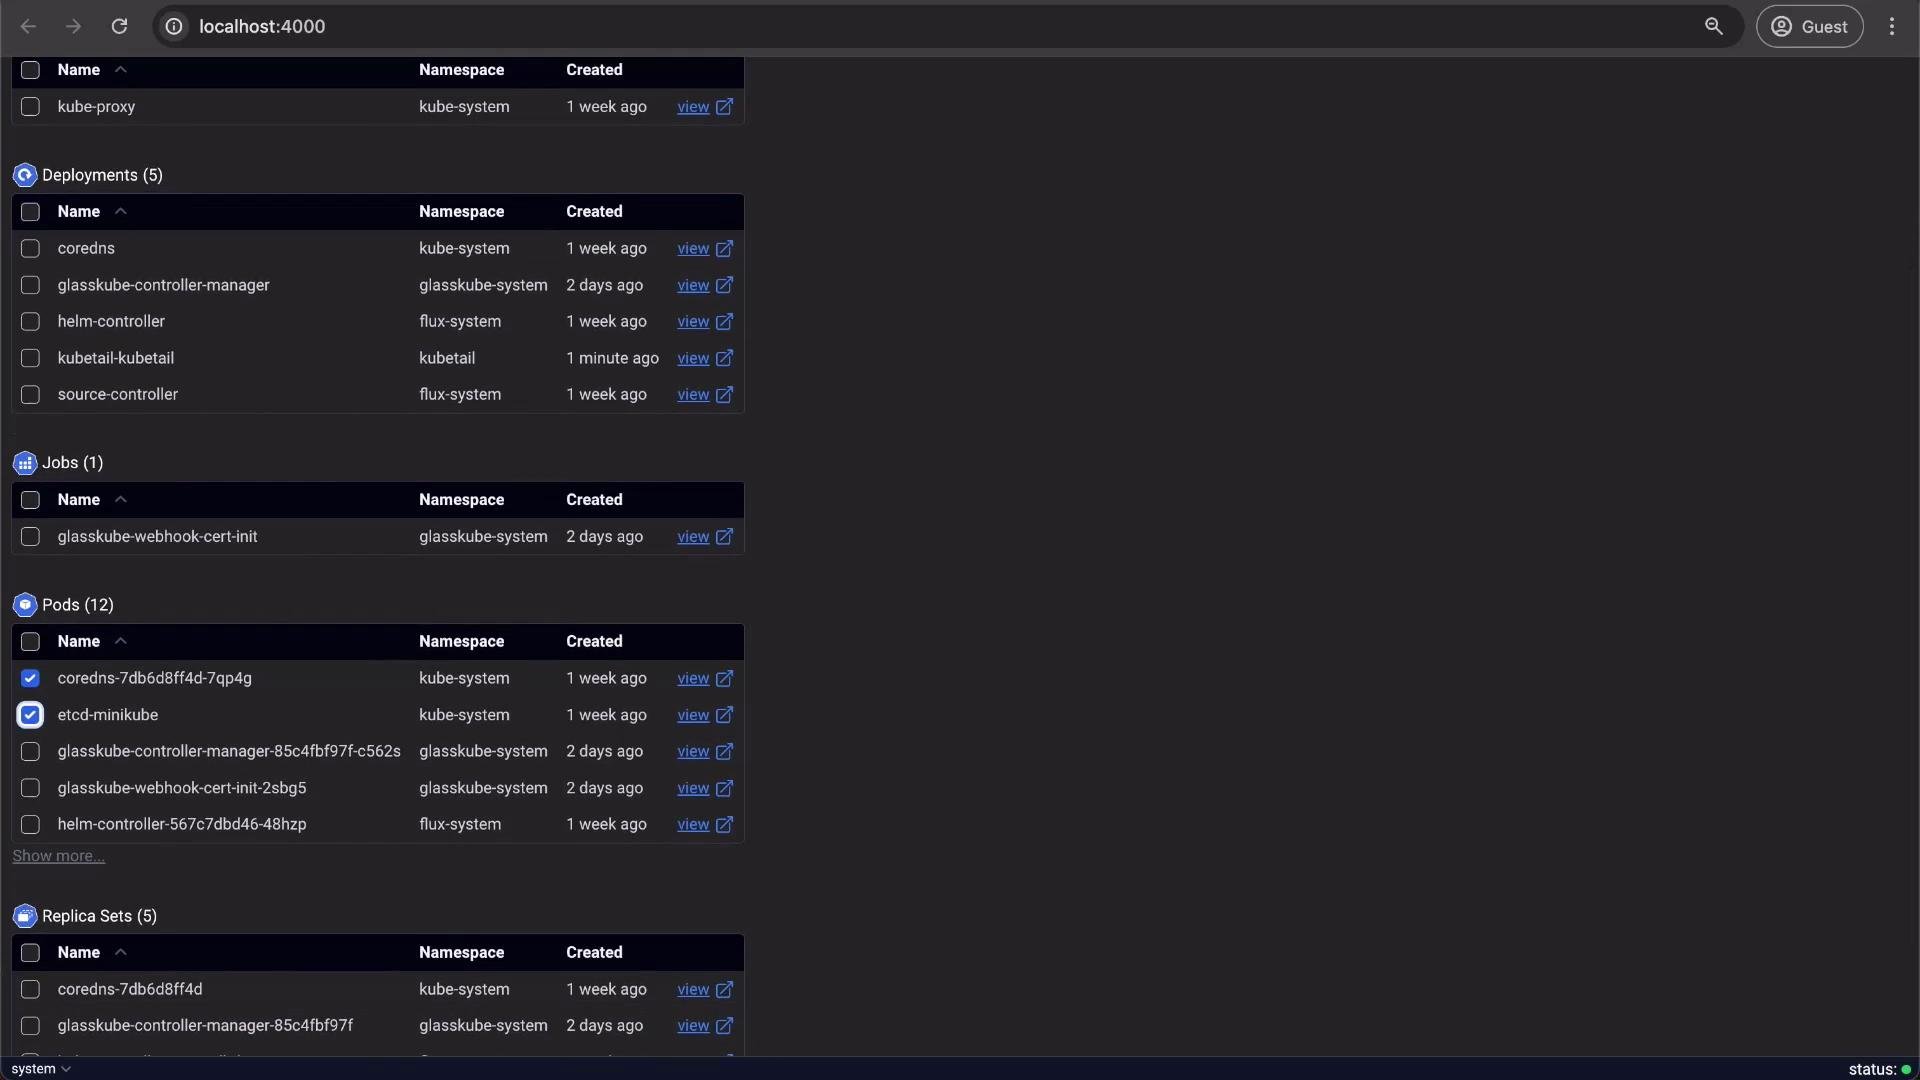
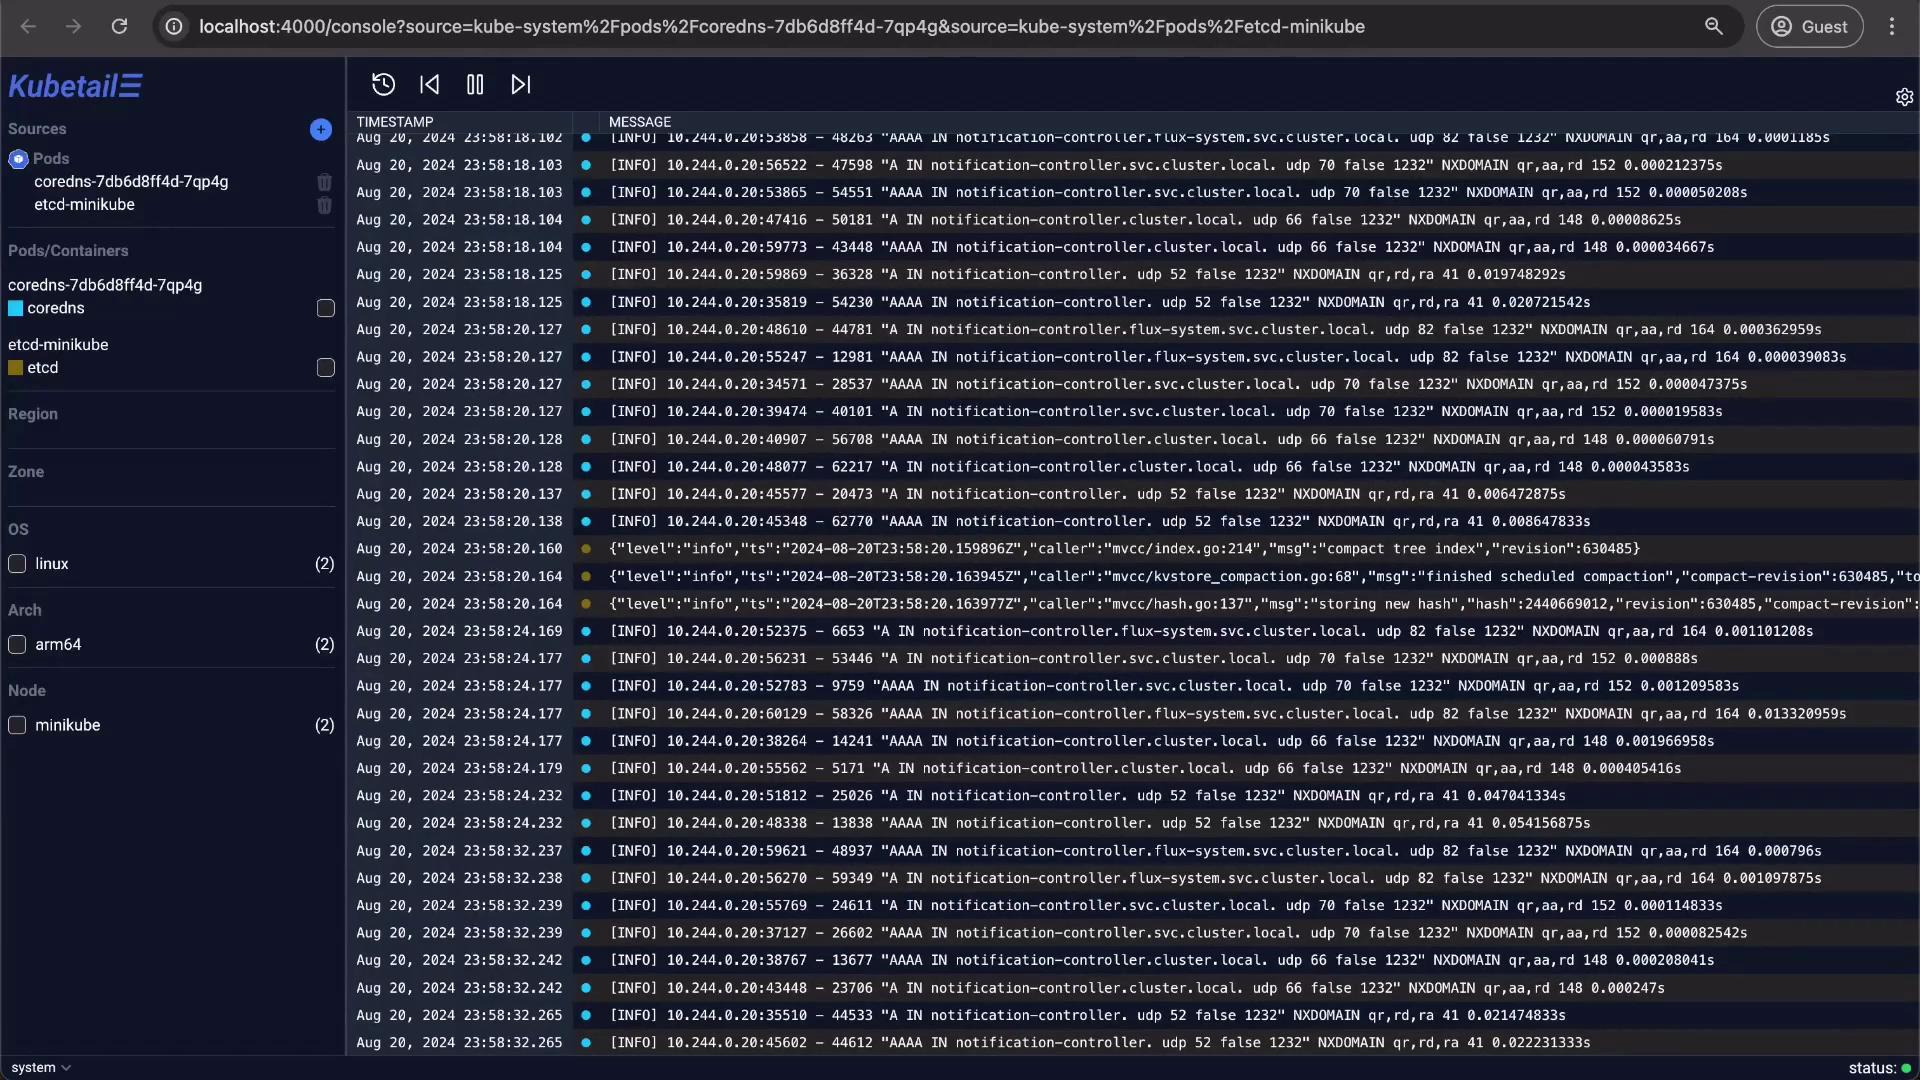
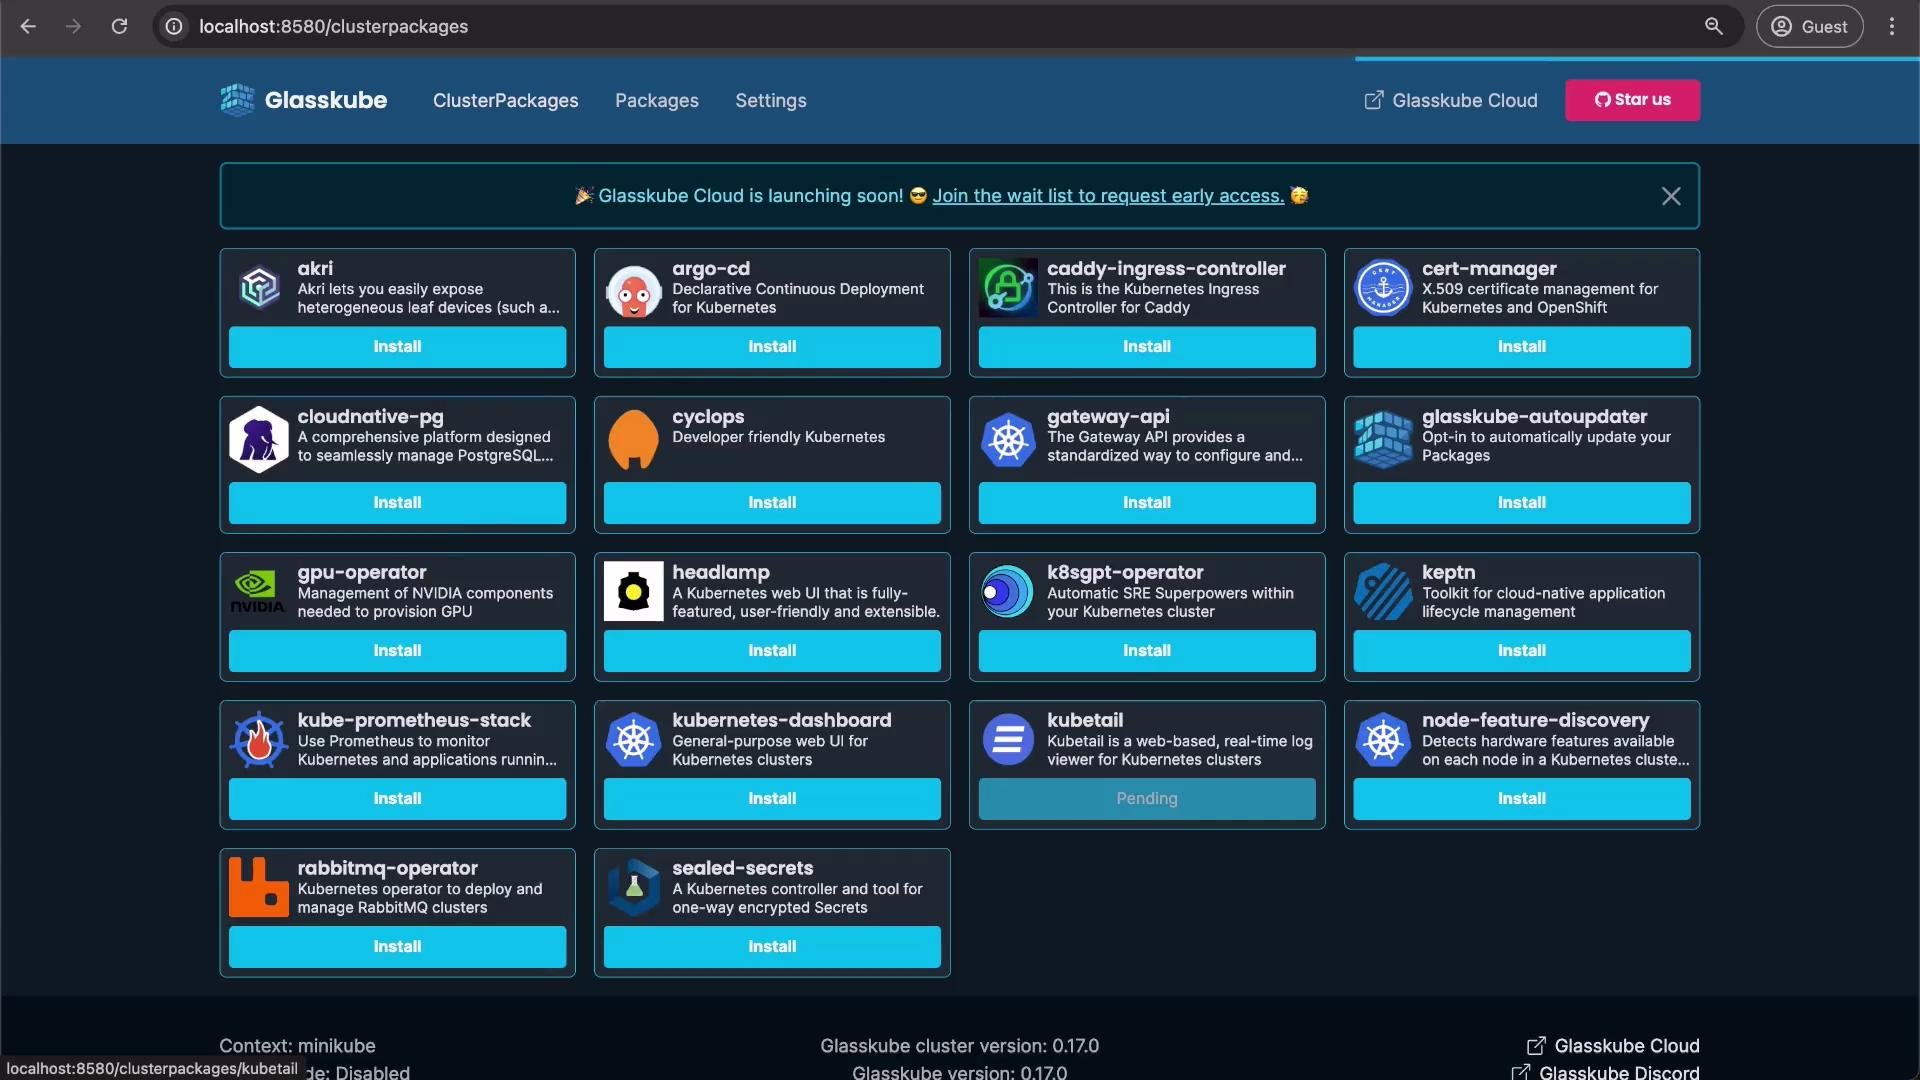
Kubetail in the Glasskube UI:
kube-prometheus-stack: metrics, dashboards, and alerting
The kube-prometheus-stack bundles Prometheus, Alertmanager, Grafana, and several exporters into a pre-configured monitoring solution. It provides:- Prometheus for metric collection and alerting rules
- Alertmanager for routing/notification
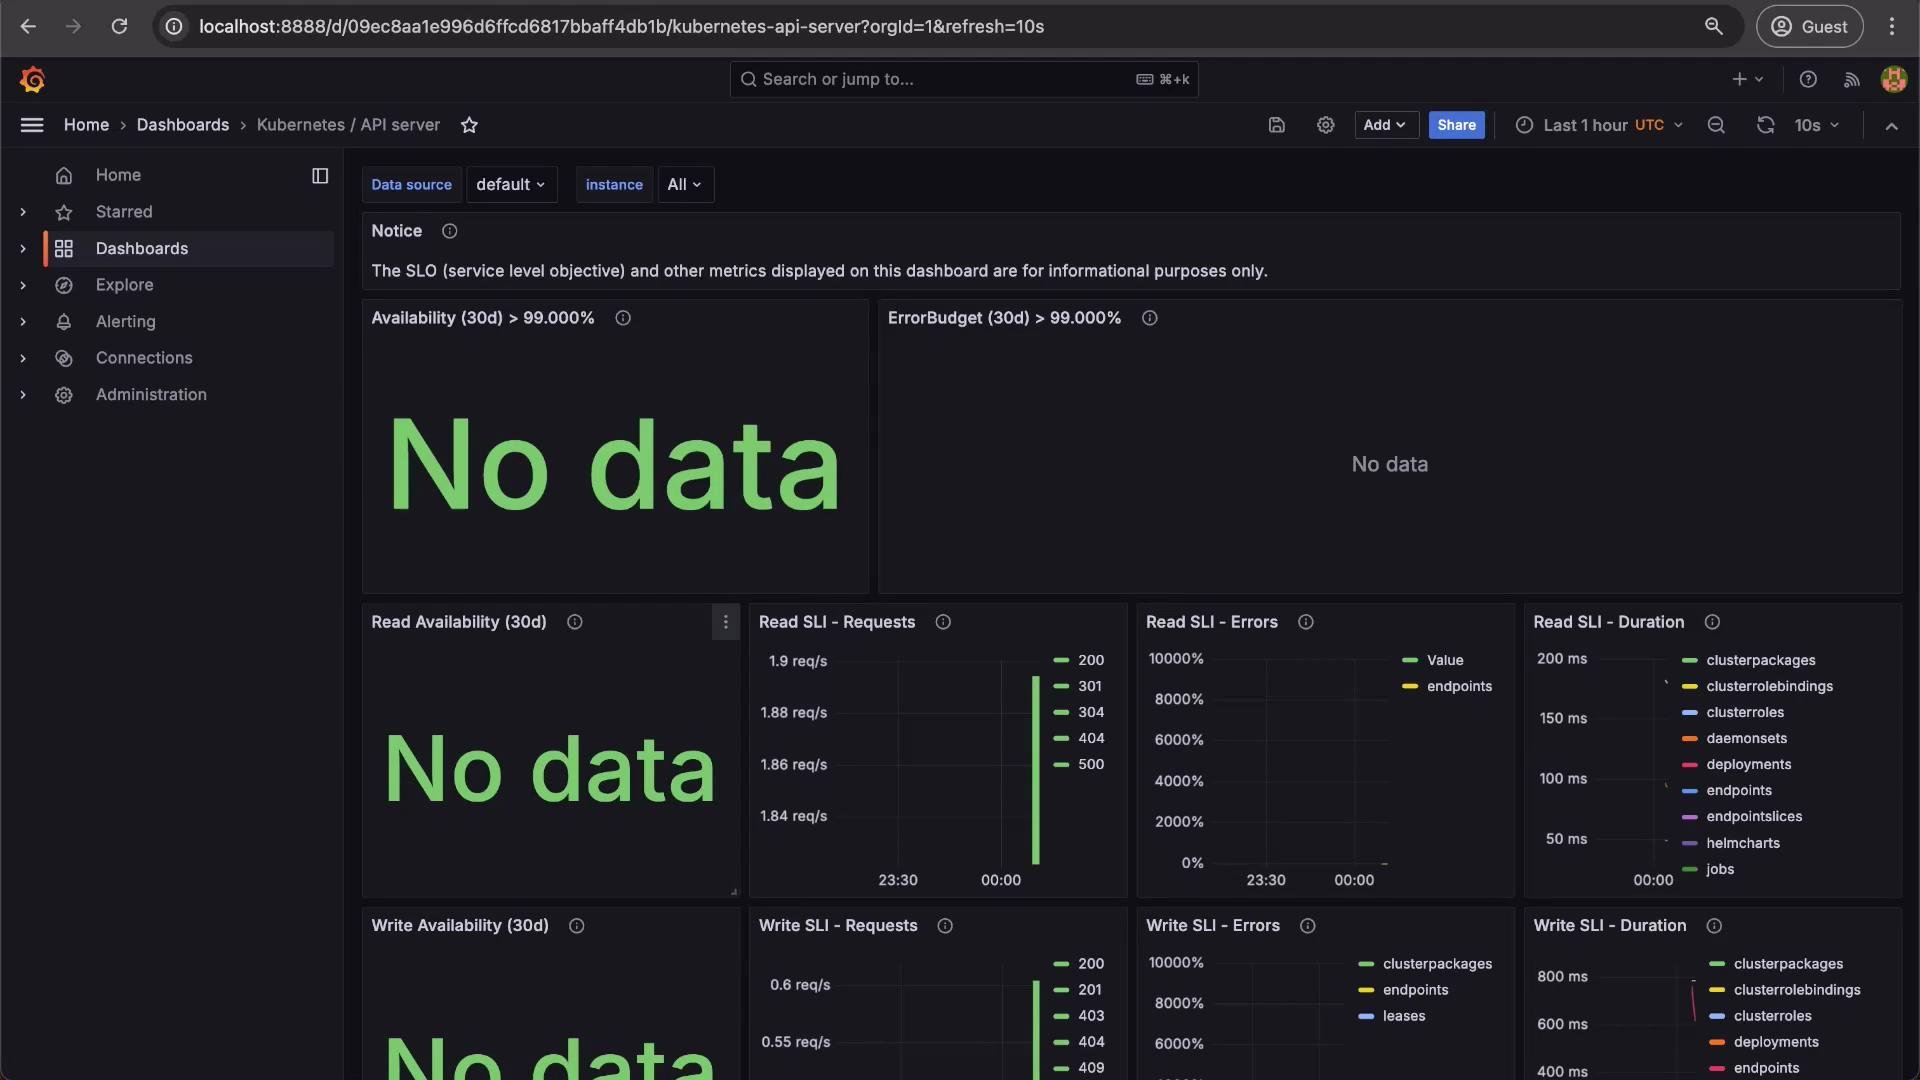
- Grafana with pre-built dashboards
- Exporters such as node-exporter to collect node metrics
You’ll get many dashboards out of the box:
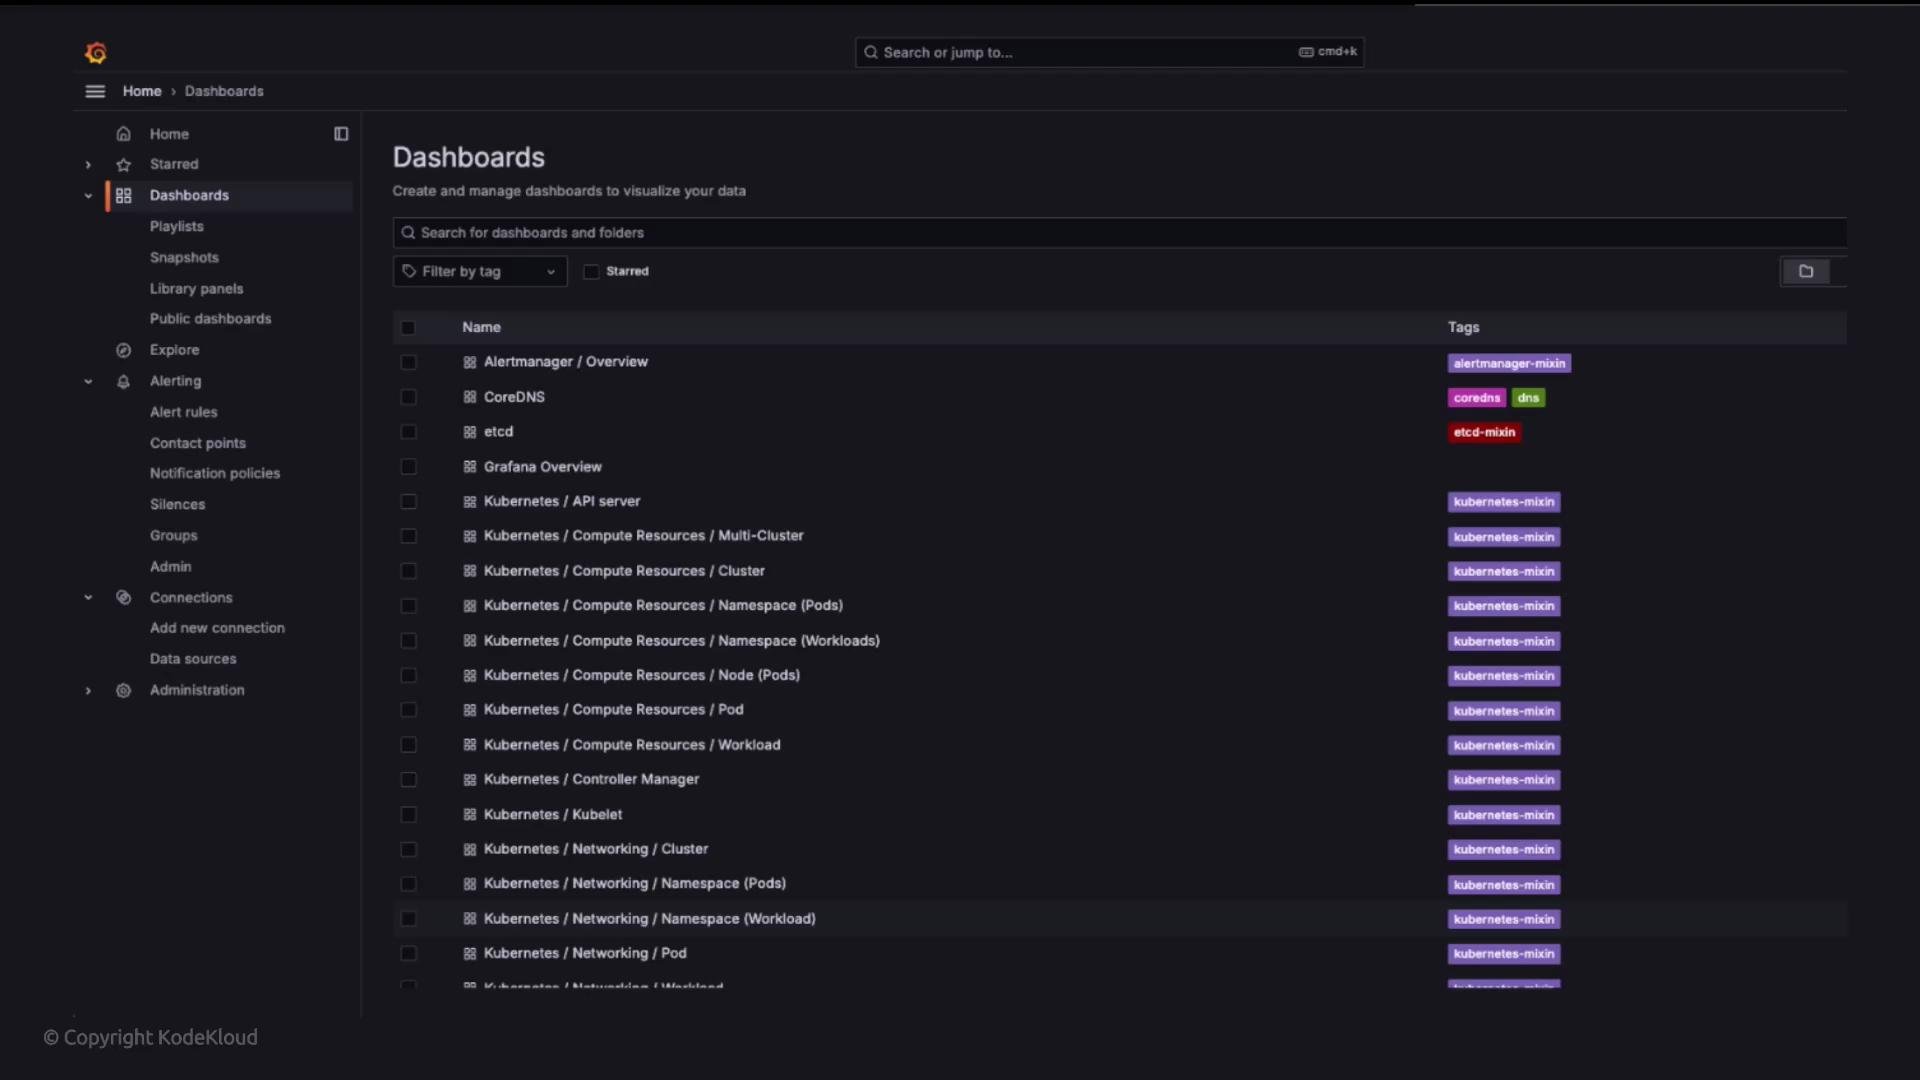
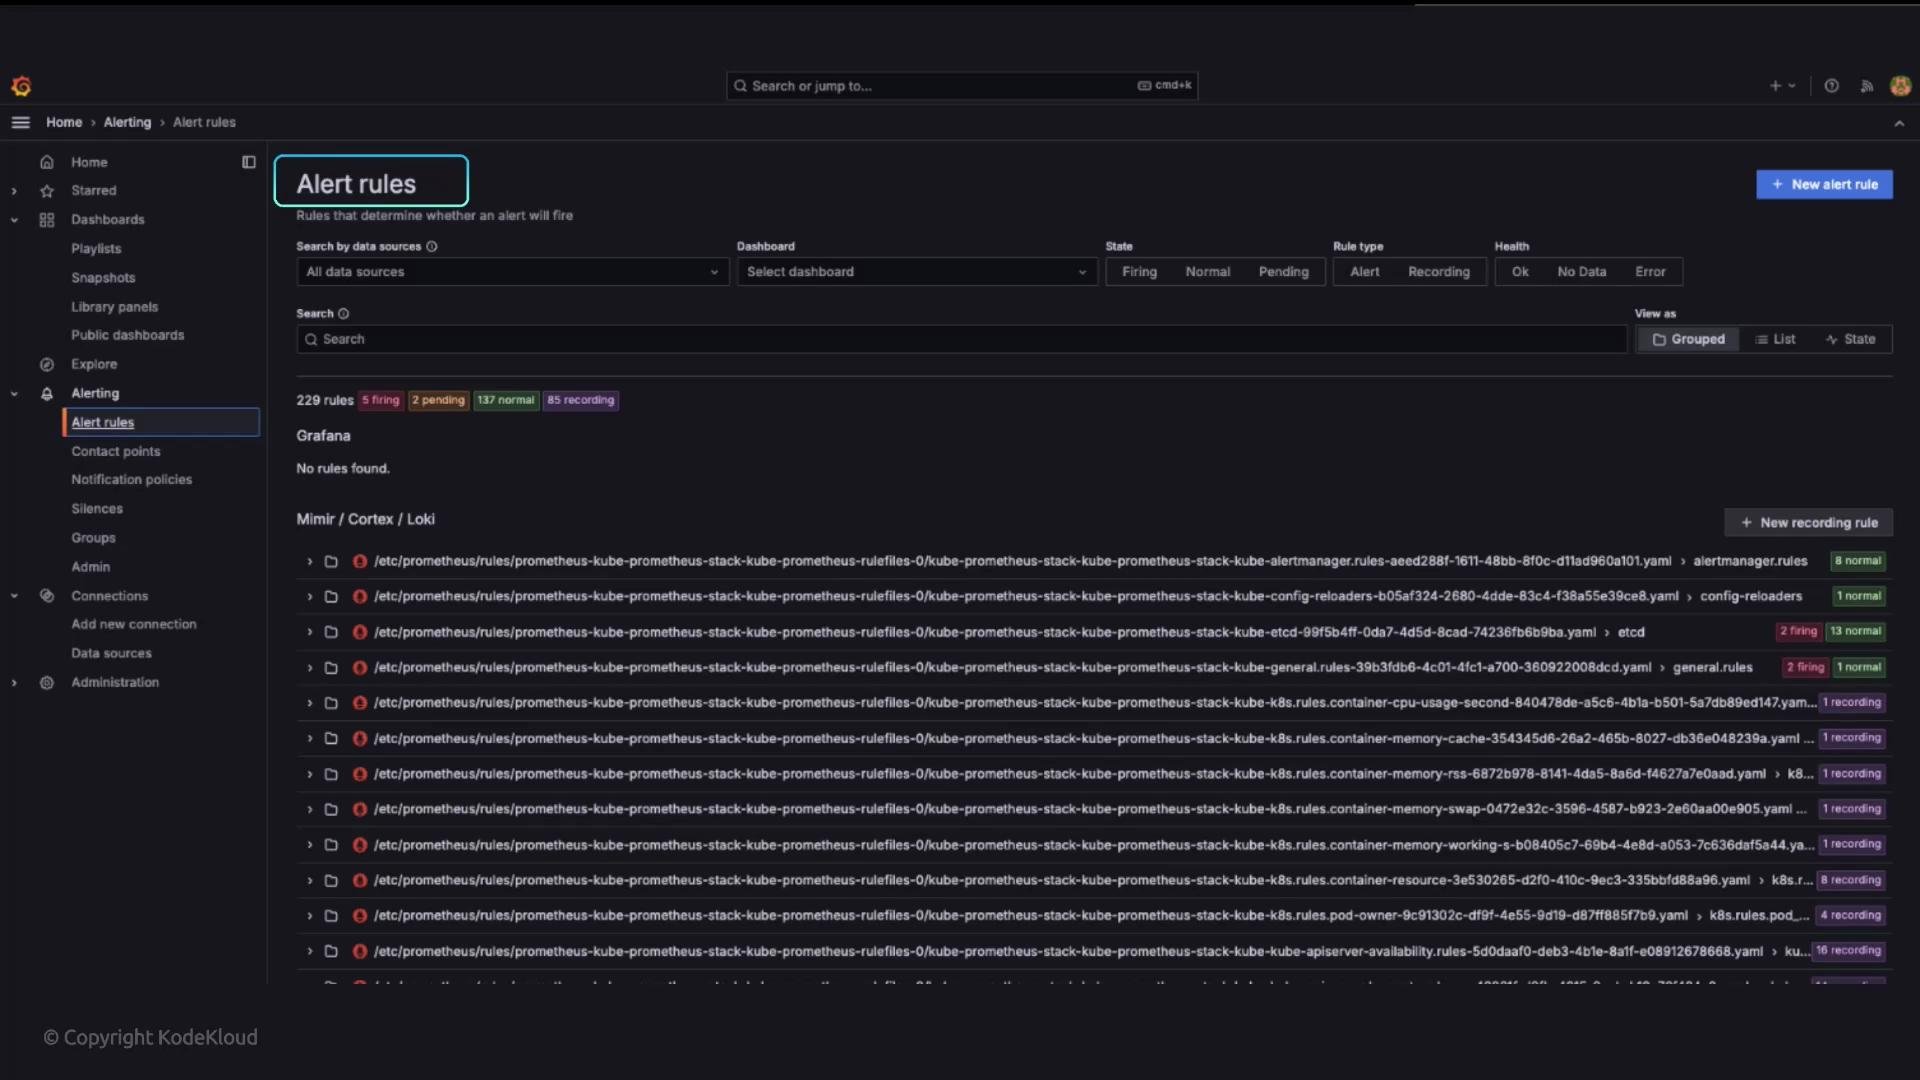
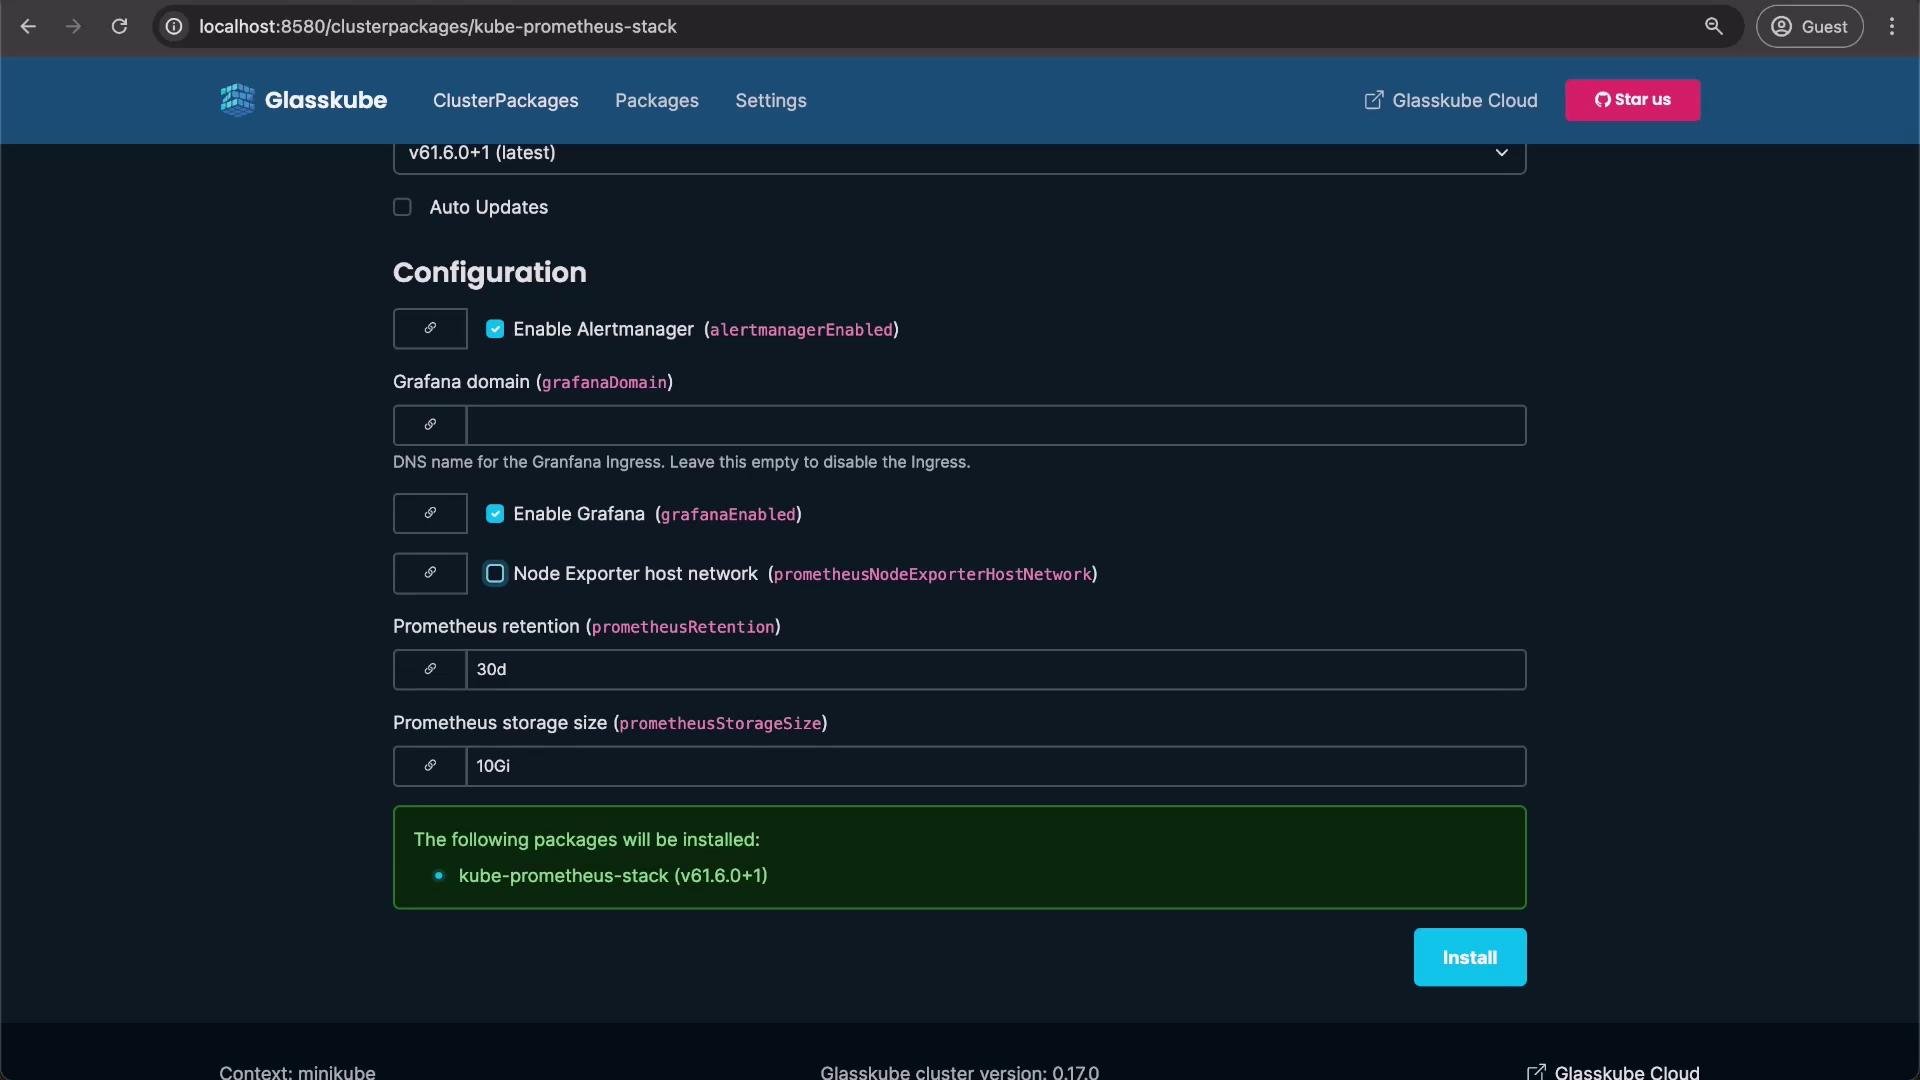
- Enable/disable Alertmanager
- Enable/disable Grafana
- Enable node-exporter host network for richer node metrics
- Configure Prometheus retention and storage size
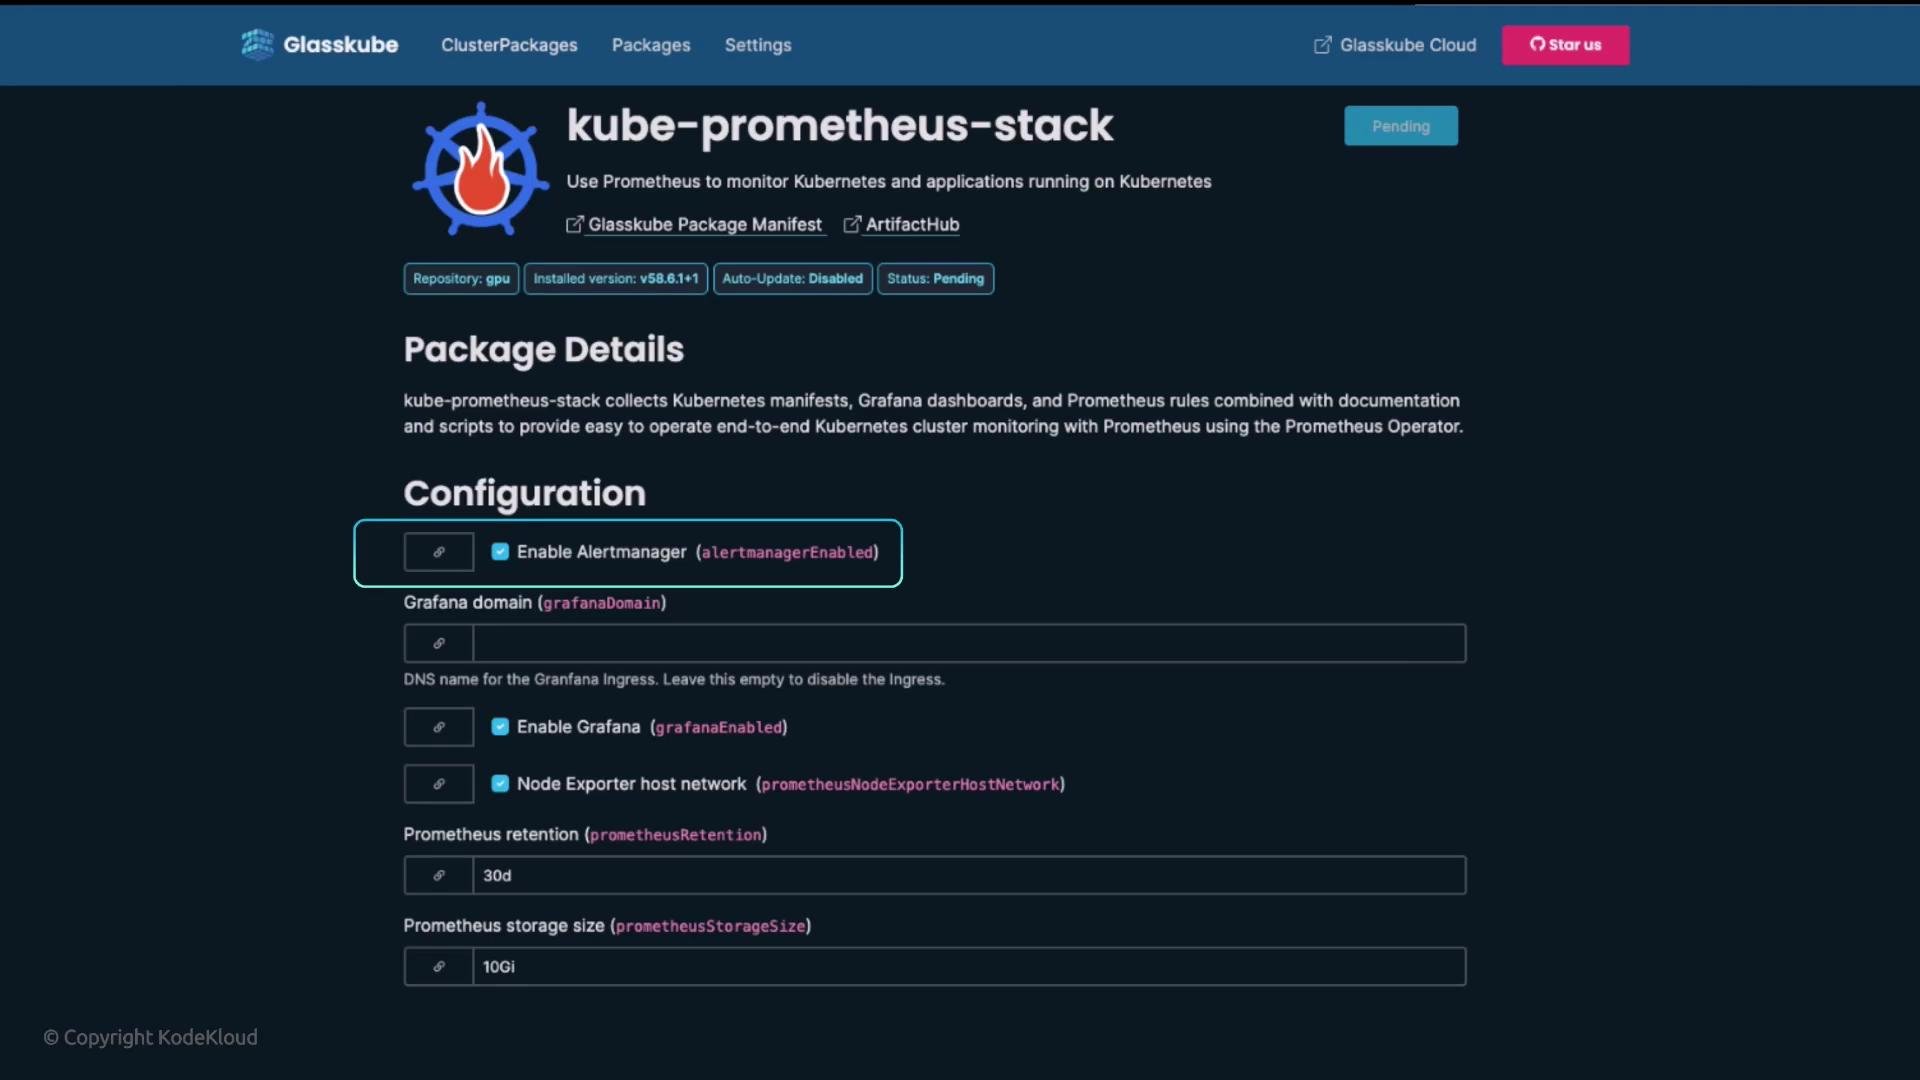
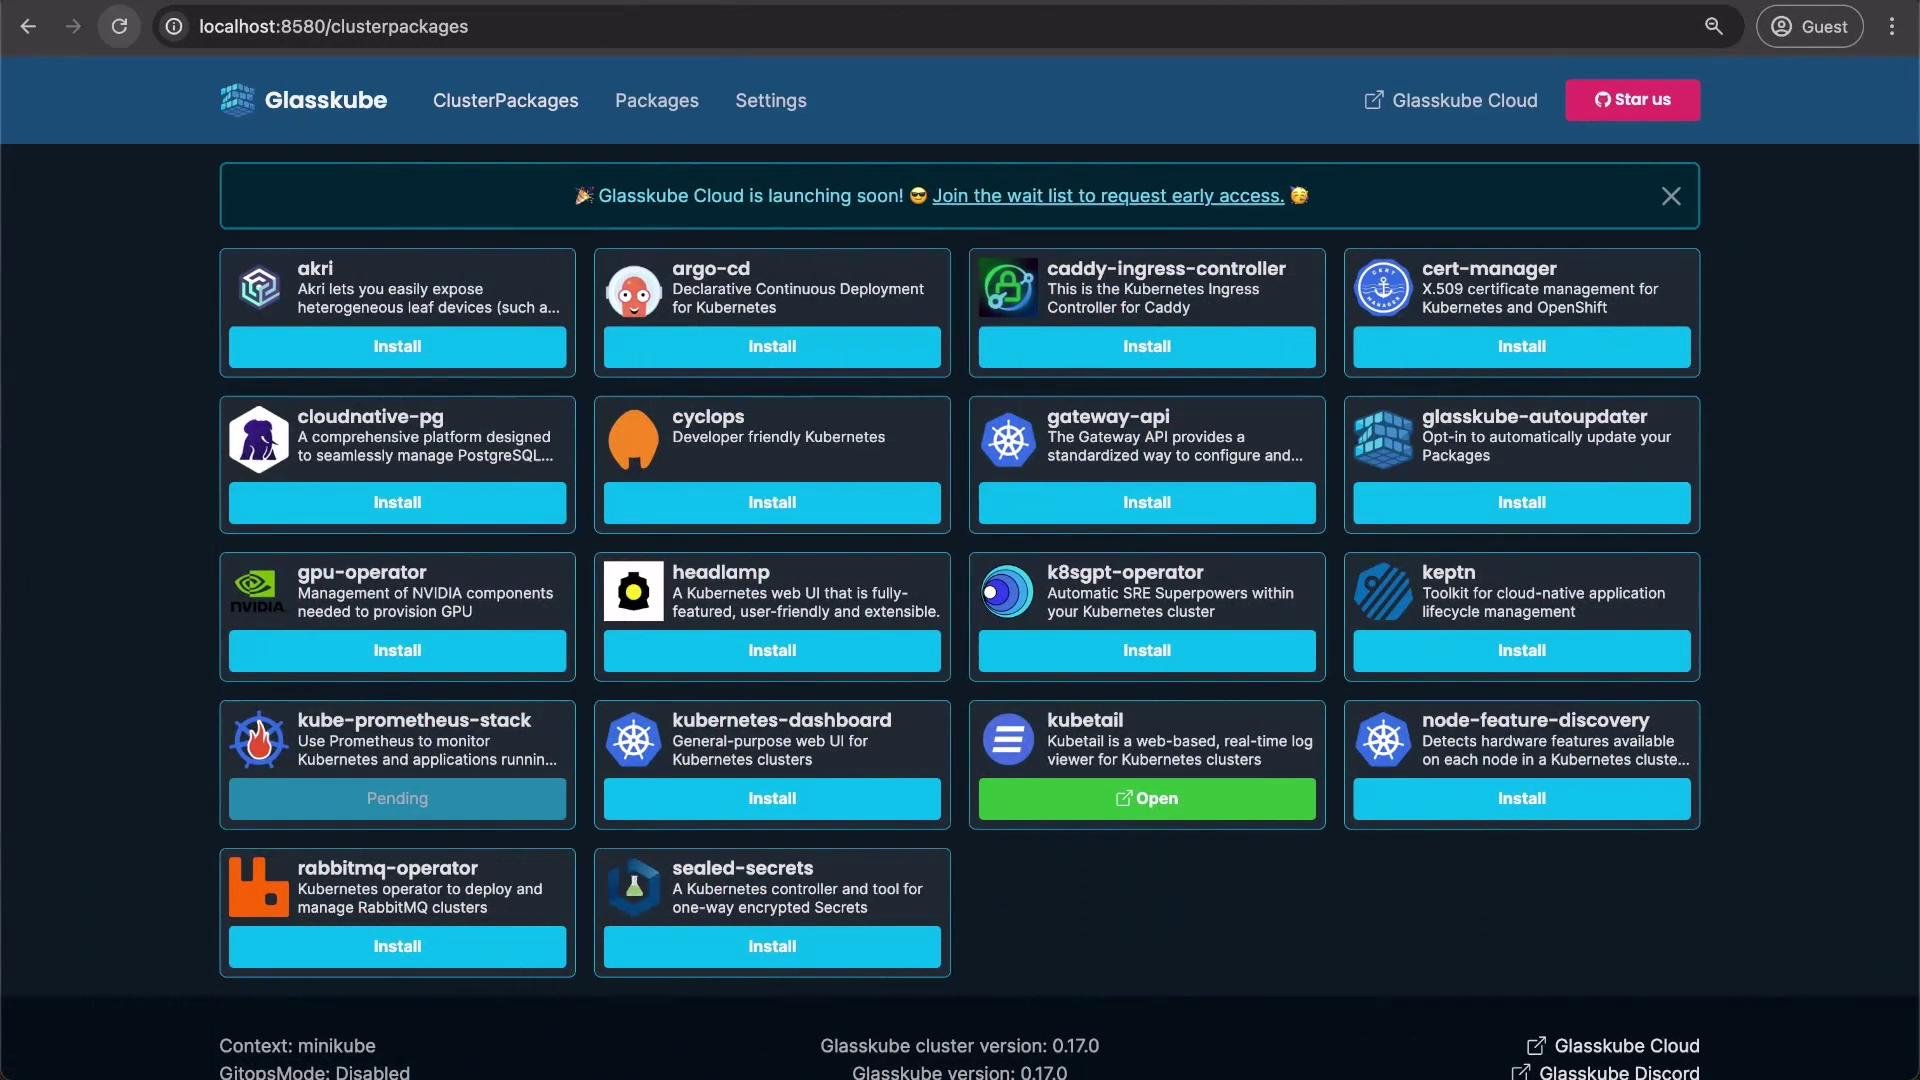
kube-prometheus-stack namespace and the stack’s pods will begin to initialize. Verify namespace and pod status:
kube-prometheus-stack namespace.
To find and decode the Grafana admin credentials:
Default Grafana credentials for many kube-prometheus-stack installs are:
- Username:
admin - Password:
prom-operatorAlways confirm by decoding the actual Kubernetes secret in your cluster (see command above) — some releases or charts may override defaults.
Summary
With Kubetail and kube-prometheus-stack deployed via Glasskube you gain both:- Real-time log streaming and filtering across pods and containers (Kubetail)
- A full metrics collection, visualization, and alerting platform (Prometheus + Alertmanager + Grafana)