Table of Contents
- Metrics and Alarms
- CloudWatch Dashboards
- Data Retention & Detailed Monitoring
- CloudWatch Agent
- CloudWatch Logs
- Additional Resources
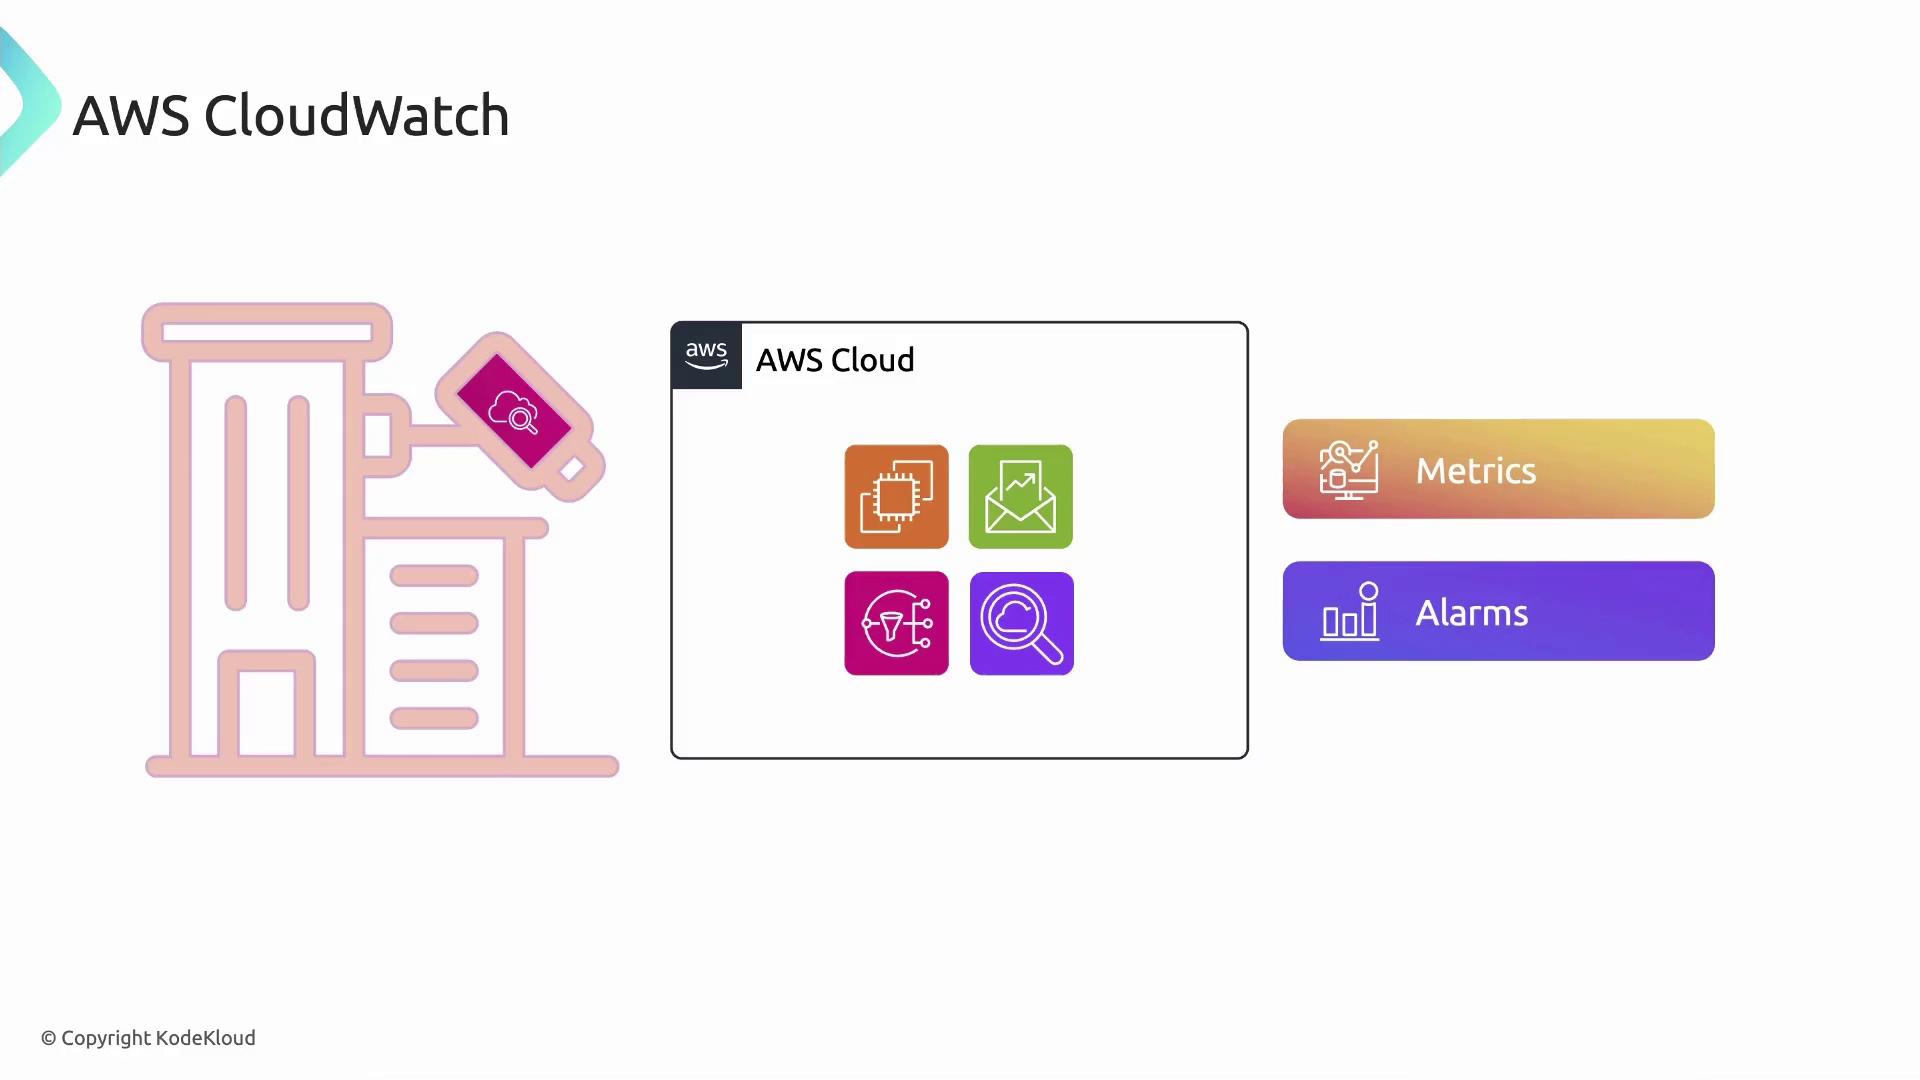
Metrics and Alarms
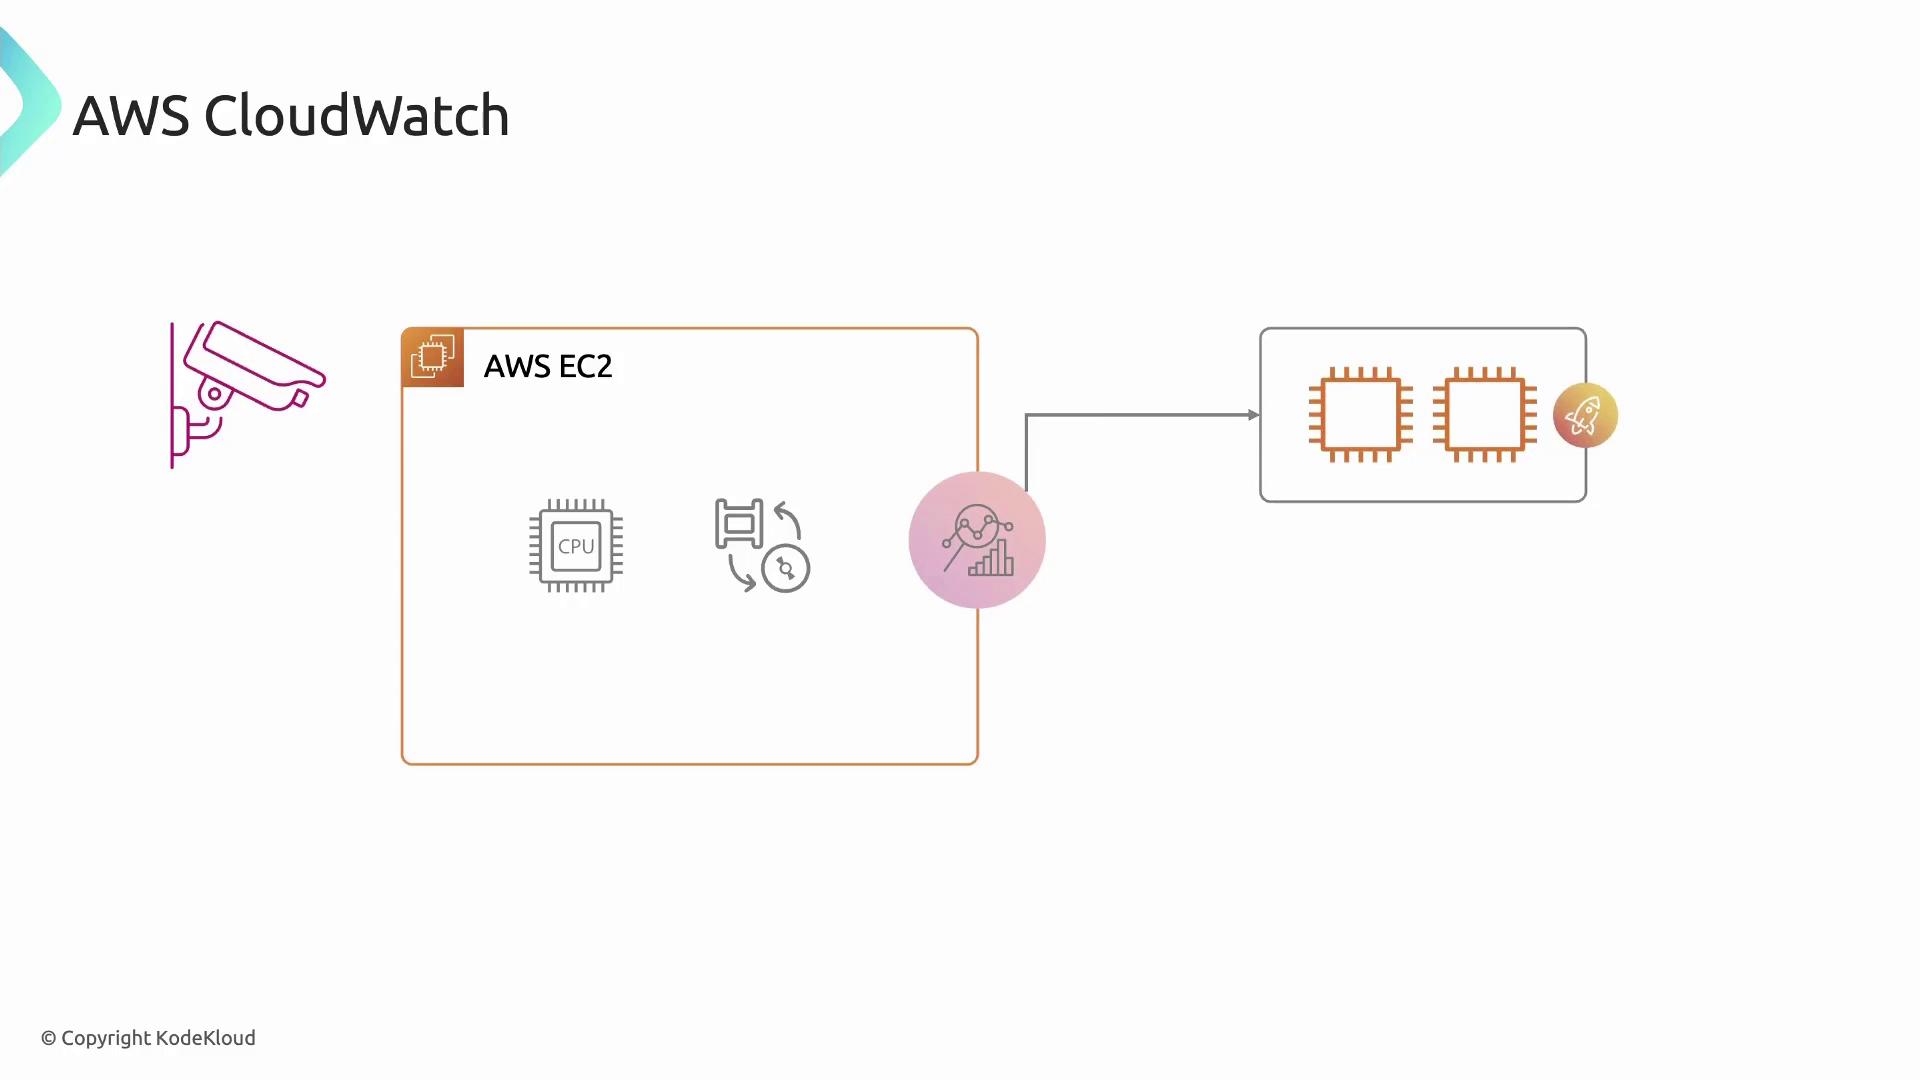
CloudWatch metrics are time-ordered data points representing system and application measurements—such as CPU utilization, disk I/O, or network traffic—collected from your EC2 instances.- Create alarms to watch metrics and trigger automated actions (e.g., Auto Scaling) or notifications (e.g., Amazon SNS) when predefined thresholds are crossed.
- Use built-in metrics for EC2 or publish custom metrics for domain-specific KPIs.
Common EC2 Metrics
| Metric Name | Description | Resolution (Default / Detailed) |
|---|---|---|
| CPUUtilization | Percentage of allocated EC2 CPU used | 5 minutes / 1 minute |
| DiskReadOps | Number of disk read operations | 5 minutes / 1 minute |
| NetworkIn | Incoming network traffic (bytes) | 5 minutes / 1 minute |
| StatusCheckFailed | Instance health check failures | 5 minutes / 1 minute |
Enabling detailed monitoring incurs additional charges. Review the CloudWatch pricing page before turning on one‐minute metrics.
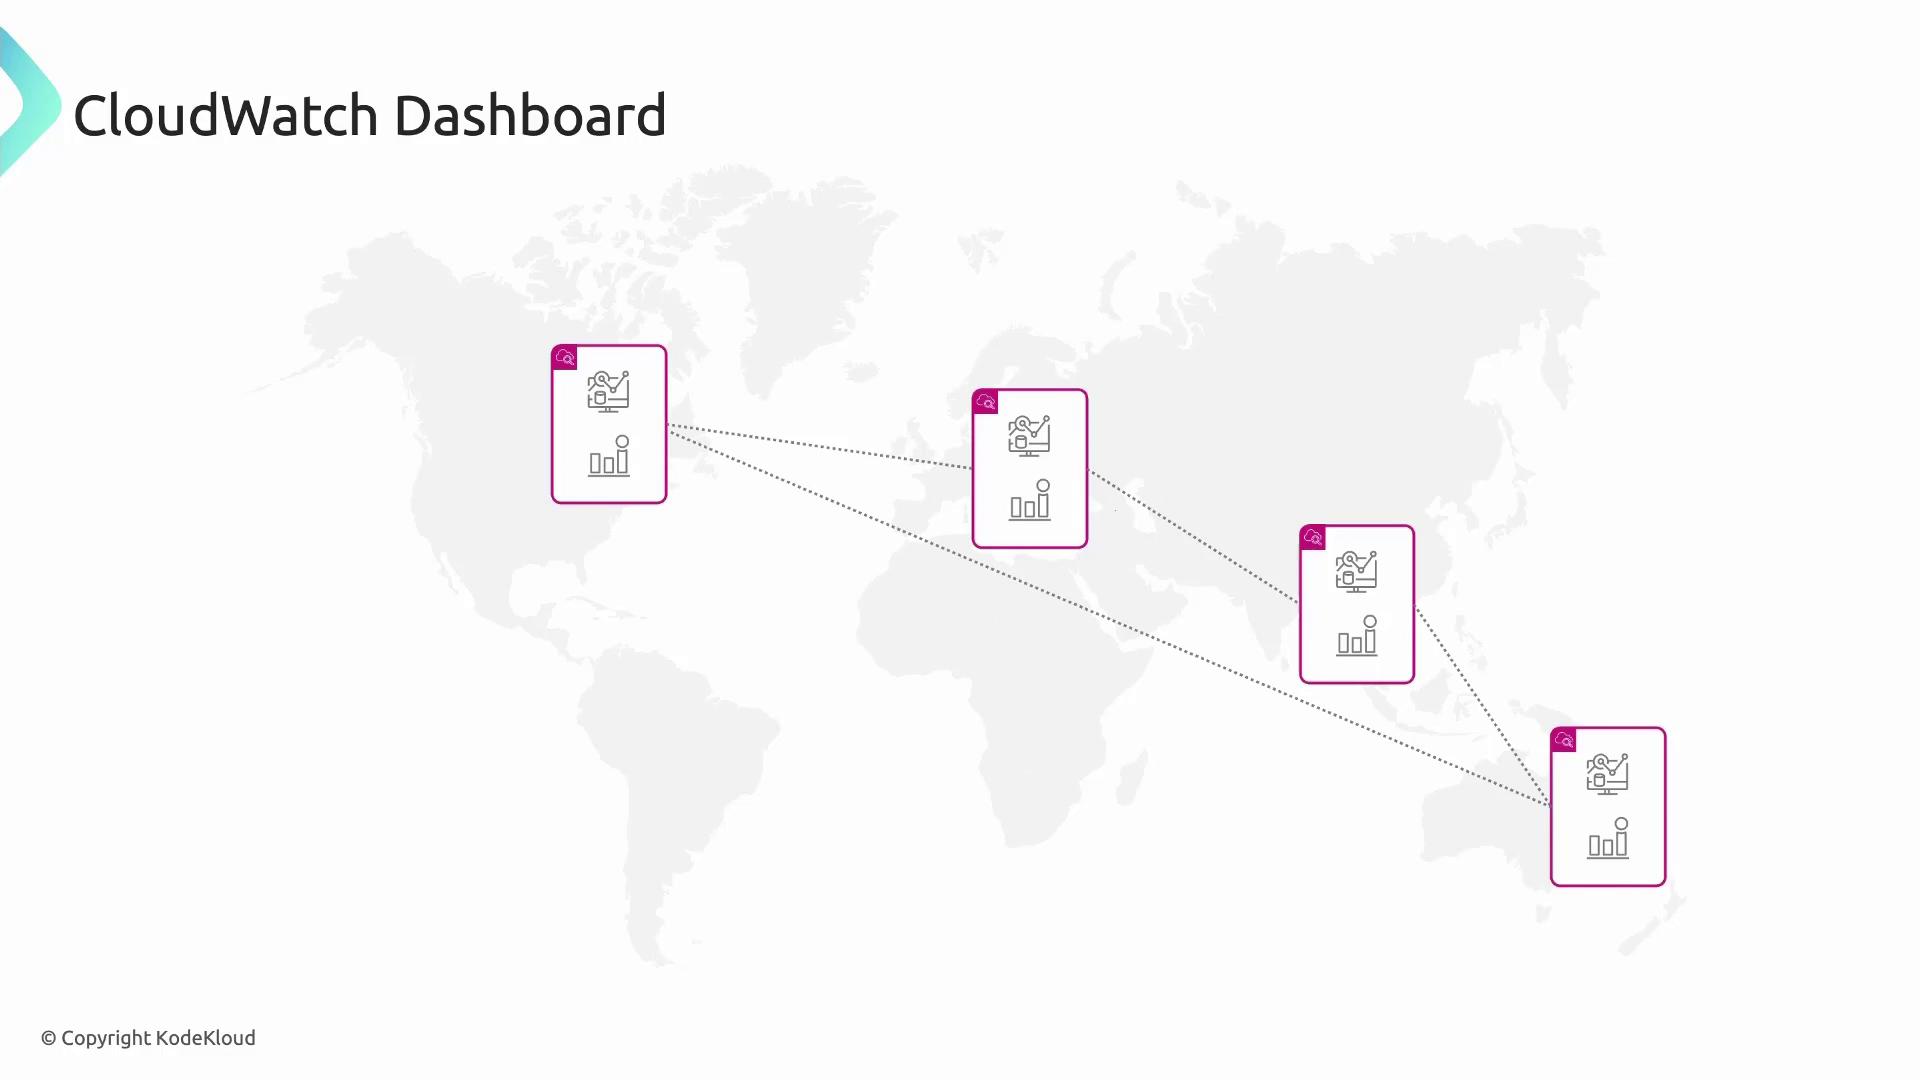
CloudWatch Dashboards
Dashboards let you unify metrics, alarms, and logs into a single customizable view. You can:- Combine widgets (graphs, text, alarms) from multiple AWS accounts and regions.
- Share readonly dashboards with stakeholders for real‐time collaboration.
- Embed dashboards in internal portals or runbooks for incident response.
Use descriptive widget titles and color‐coded alarms to make critical metrics stand out on your dashboard.
Data Retention & Detailed Monitoring
CloudWatch automatically retains metrics at different granularities:| Time Period | Metric Resolution | Use Case |
|---|---|---|
| 0–3 hours | 1 minute | Near real-time troubleshooting |
| 3–15 days | 5 minutes | Short-term trend analysis |
| 15 days–63 days | 1 hour | Mid-term capacity planning |
| 63 days–15 months | 1 day | Long-term historical reporting |
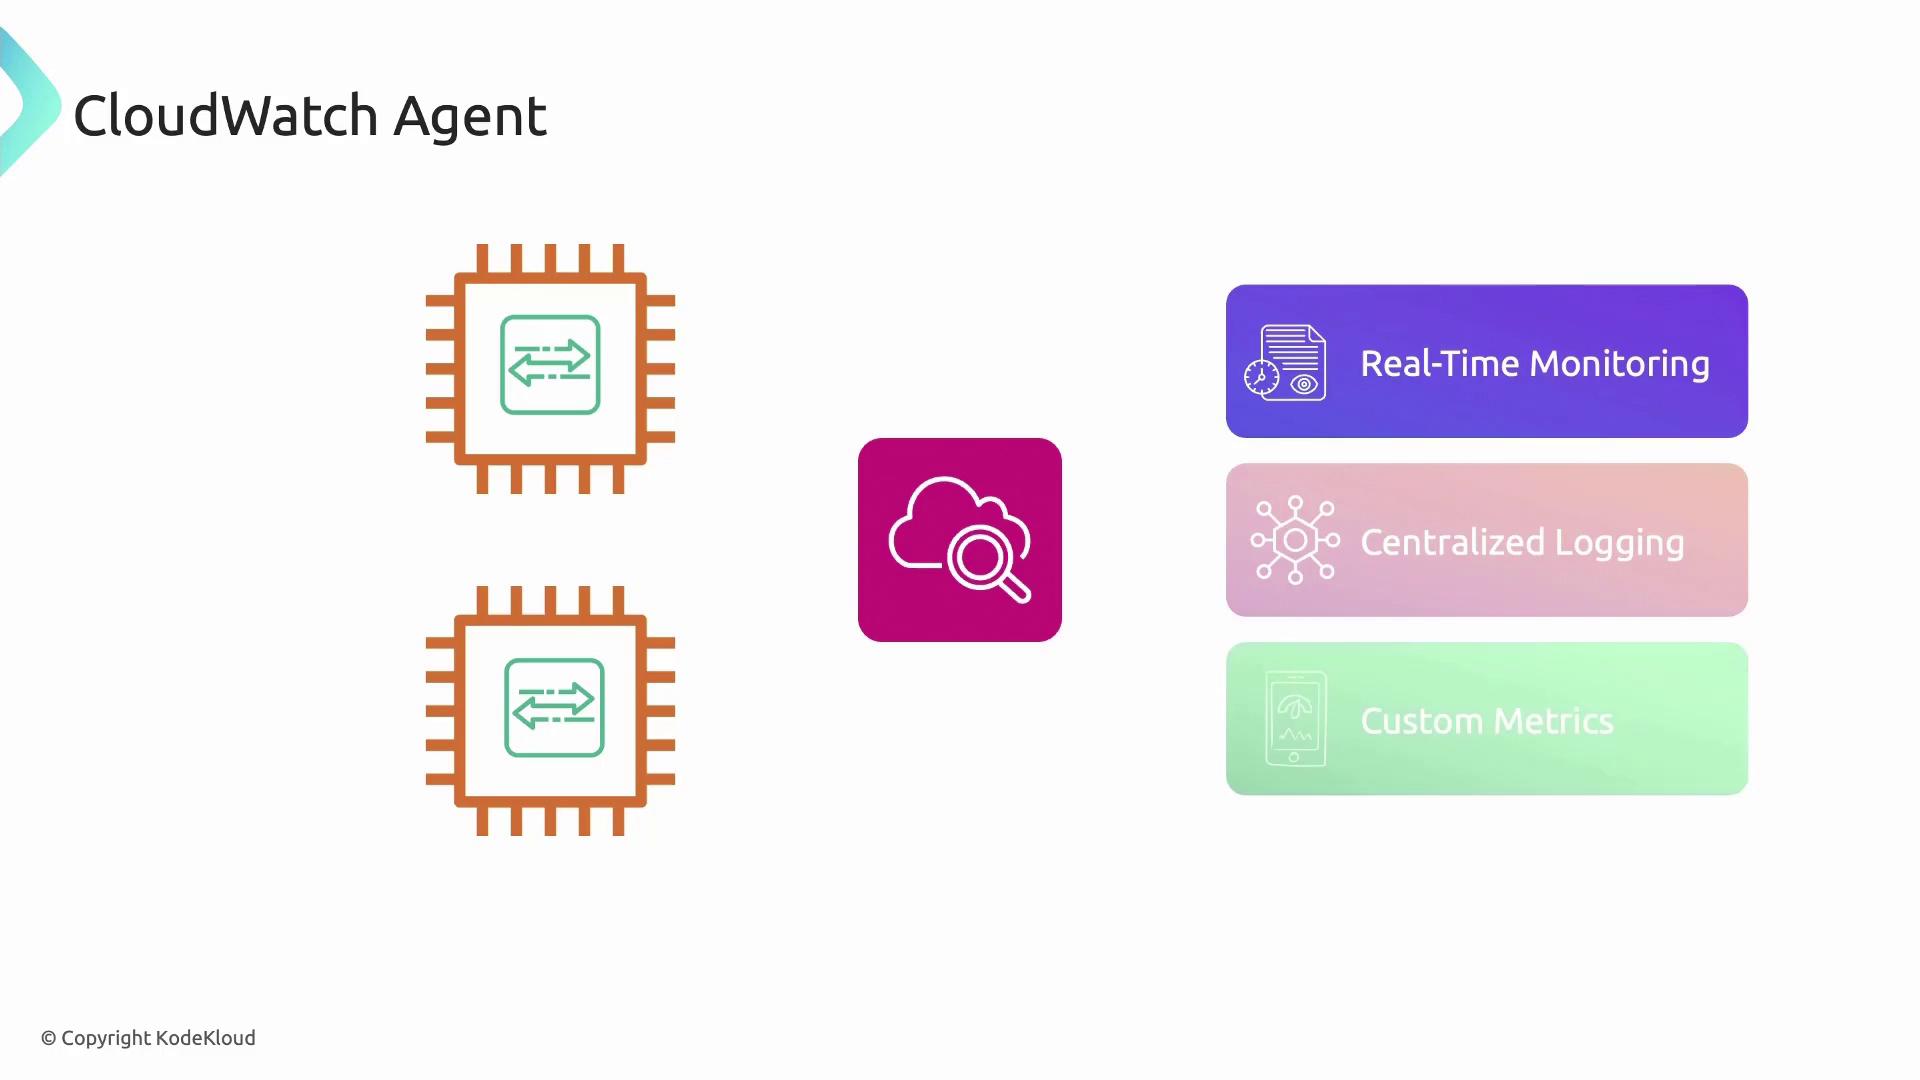
CloudWatch Agent
The CloudWatch Agent is lightweight software you install on EC2 instances (or on-premises servers) to collect system metrics, application logs, and custom data:- Real-time, high-resolution metrics (CPU, memory, disk, network).
- Centralized log collection for Linux and Windows (supports JSON, syslog, IIS, and more).
- Custom metric publishing via configuration files or the GetMetricData API.
Configure the agent with the unified CloudWatch Agent configuration file (
amazon-cloudwatch-agent.json) and deploy it using AWS Systems Manager for scale.CloudWatch Logs
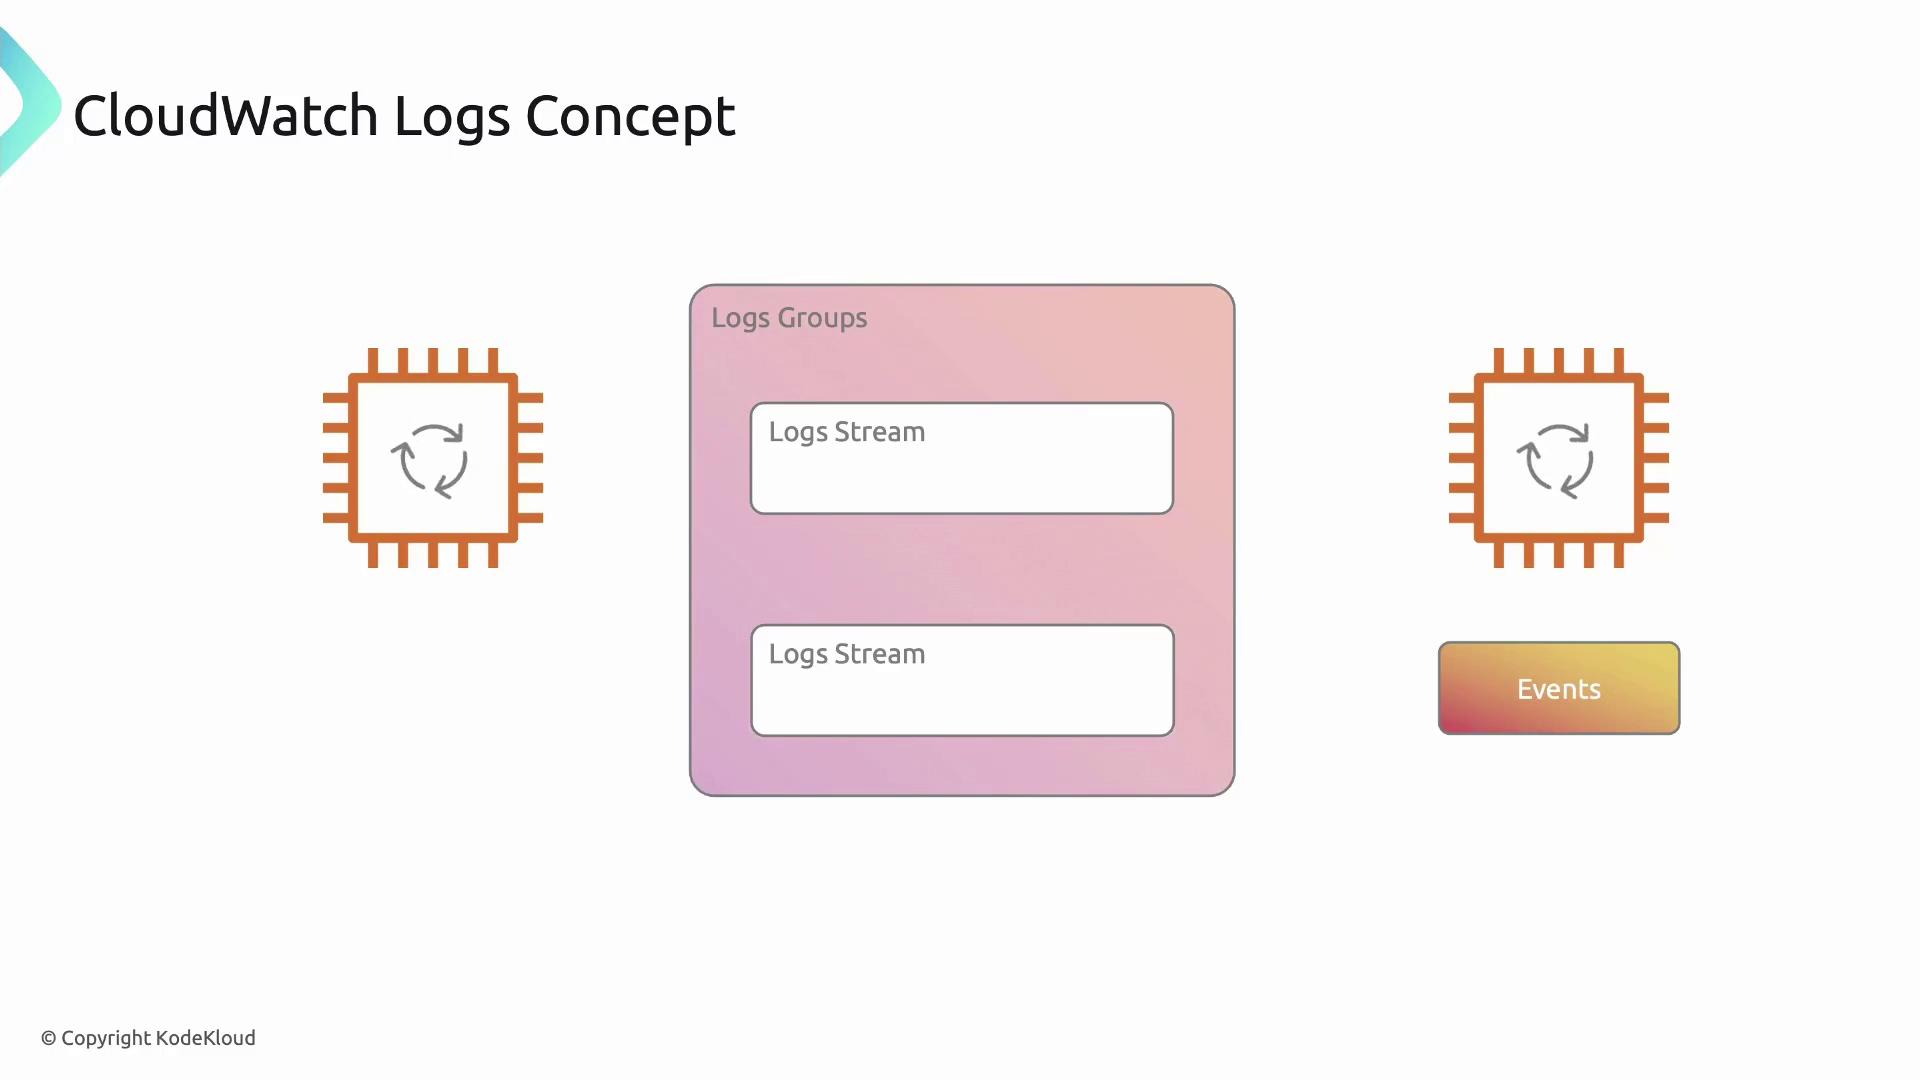
AWS CloudWatch Logs centralizes, monitors, and stores log data from EC2 instances, CloudTrail, VPC Flow Logs, and on-premises servers:- Log events: Individual records with timestamps (e.g., application errors).
- Log streams: Ordered sequences of events from a single source.
- Log groups: Containers for related streams with shared retention, access controls, and metric filters.