docker service ls and docker service ps are effective for checking which services are running on which nodes, they can become cumbersome as your cluster scales.
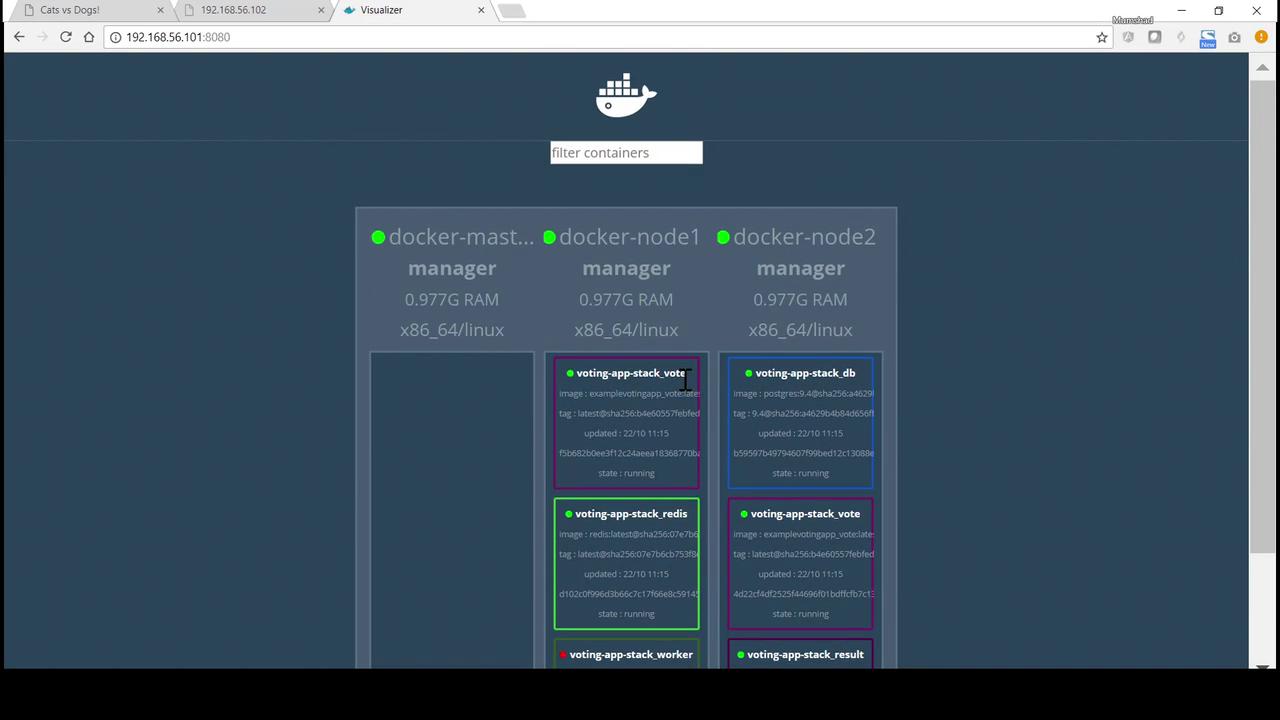
For clusters with multiple nodes and services, consider using Docker Visualizer to simplify monitoring and management.
Introducing Docker Visualizer
Docker Visualizer is a user-friendly tool available on Docker Hub under Docker Samples. Look for the image named “visualizer” when browsing Docker Samples. The help section on its Docker Hub page provides all necessary instructions for running the tool.Deploying Docker Visualizer on Your Docker Swarm Cluster
To deploy Docker Visualizer, execute the following commands on your Docker master node. This first command creates a Docker service for the visualizer:Example: Deploying a Docker Stack
Below is an example of deploying a Docker stack for an application. The output shows the creation of various services and provides a snapshot of the current state of your Docker services:The Docker Visualizer interface presents a clear and dynamic view of your Docker Swarm topology, showcasing nodes, running containers, and resource usage details. This visual approach enhances your ability to manage and troubleshoot cluster deployments.