

- AWS account with permissions to create DAX clusters, IAM roles/policies, and VPC/subnet/security-group resources.
- A VPC with at least one subnet in each Availability Zone you plan to use.
- Applications or compute (EC2, ECS, EKS, Lambda in VPC) able to reach the DAX endpoint on the required port.
Step-by-step cluster creation
-
Open the DynamoDB console, choose Clusters, then Create cluster.
Enter a cluster name — this example usescluster1. -
Choose a DAX node type (instance family and size). DAX supports families tuned for different workloads:
Select the instance size that fits your memory and CPU requirements. For demos or cost-sensitive tests,
dax.t2.small(one vCPU) is a common choice. -
Select the number of nodes. Recommendations:
- Development/testing: single-node clusters are possible for quick trials (console will warn).
- Production: use a multi-node cluster (AWS recommends a minimum of three nodes) to ensure availability and replication.
-
Create or pick a subnet group for DAX. Provide a name (for example,
DAX subnet group), choose the VPC to deploy into (the default VPC can be used for demos), and add the subnets that will host cluster nodes.
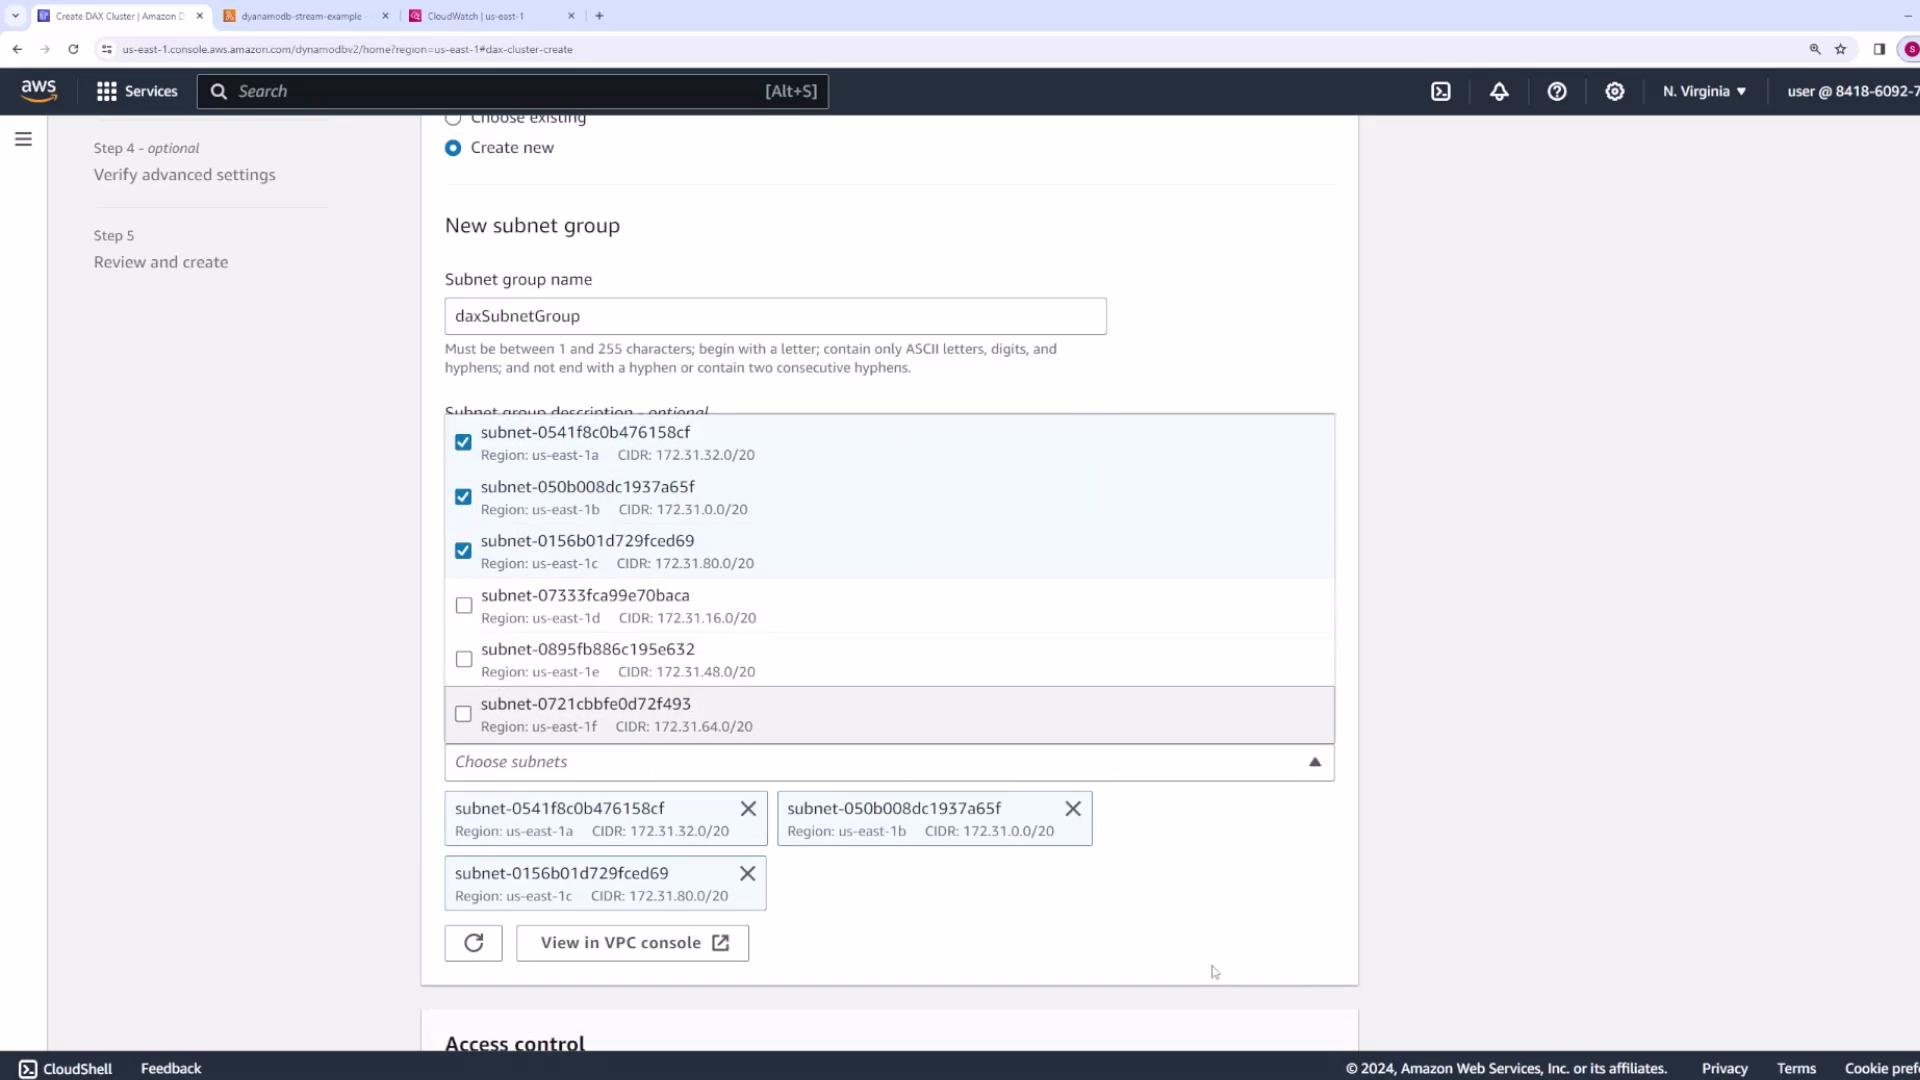
- Configure security groups and network access. Make sure inbound rules allow clients to reach the DAX cluster on the DAX port:
- Port
8111for DAX client traffic (TLS-enabled clients still use port8111). - If you perform any management or custom networking that references different ports, document and open them only as required.
- Port

Make sure your application instances (EC2, ECS tasks, Lambda functions in a VPC, etc.) are allowed to reach the DAX cluster on the required port. If using encryption in transit, ensure clients are configured to use TLS when connecting.
- Availability Zones (AZs): choose whether AWS should select AZs automatically (recommended for even distribution) or choose specific AZs manually to meet locality or compliance requirements.
-
IAM role and policies:
- Create a service-linked role for DAX and attach an IAM policy that grants DAX access to DynamoDB tables.
- Decide scope:
- Read-write access when DAX should handle both reads and writes.
- Read-only access when DAX is used strictly for caching reads.
- For security, scope policies to only the required table ARNs rather than granting access to all tables.
- Encryption at rest (protects data stored on DAX nodes).
- Encryption in transit (TLS between client and DAX). Note: clients still connect on port
8111when TLS is enabled.

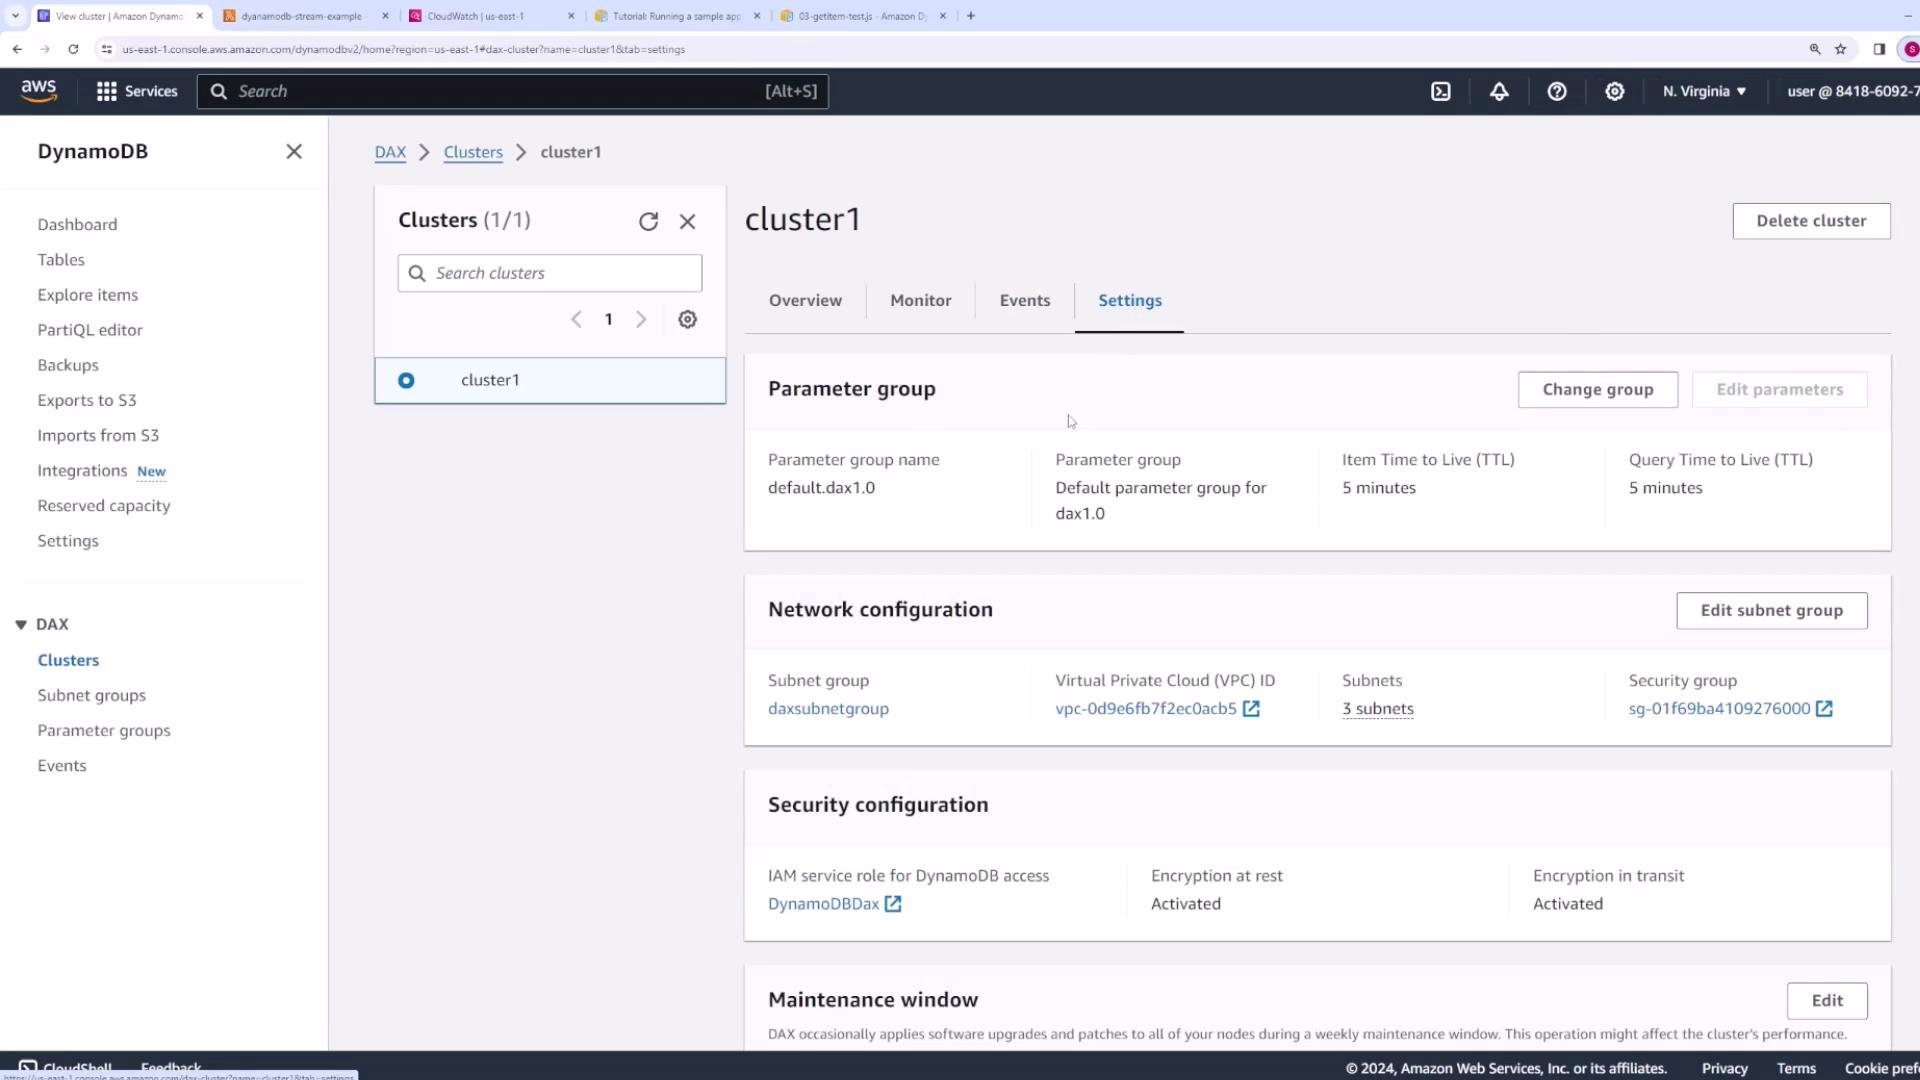
- Parameter group: choose the default parameter group or create a custom one. Parameter groups control runtime settings such as:
- Item TTL (how long an item remains in the DAX cache).
- Query TTL (how long query results are cached).

- Maintenance window: choose “No preference” or specify a preferred maintenance window for DAX patches and upgrades to minimize disruption.
- Review all settings and click Create cluster.
- Cluster endpoint (use this in your DAX-enabled SDK client configuration so requests route through DAX).
- Cluster ARN and node list.

Monitoring, events, and settings
Monitoring: the Monitoring tab provides metrics per node and for the cluster, such as CPU utilization, cache memory usage, network throughput, estimated DB size, request counts, errors, throttles, and item cache hits/misses. Use these metrics to:- Tune node sizes.
- Adjust TTLs and parameter-group settings.
- Detect cache effectiveness (hit/miss ratio).


Quick reference: recommended settings
Cleanup and cost control
When finished experimenting, delete any test clusters to avoid ongoing charges.For production deployments, use a multi-node cluster (minimum three nodes) for availability and replication, restrict IAM policies to only necessary tables, and secure network access with tightly scoped security group rules.