This article explains how to use Container Insights for Azure Kubernetes Service to monitor and optimize containerized workloads.
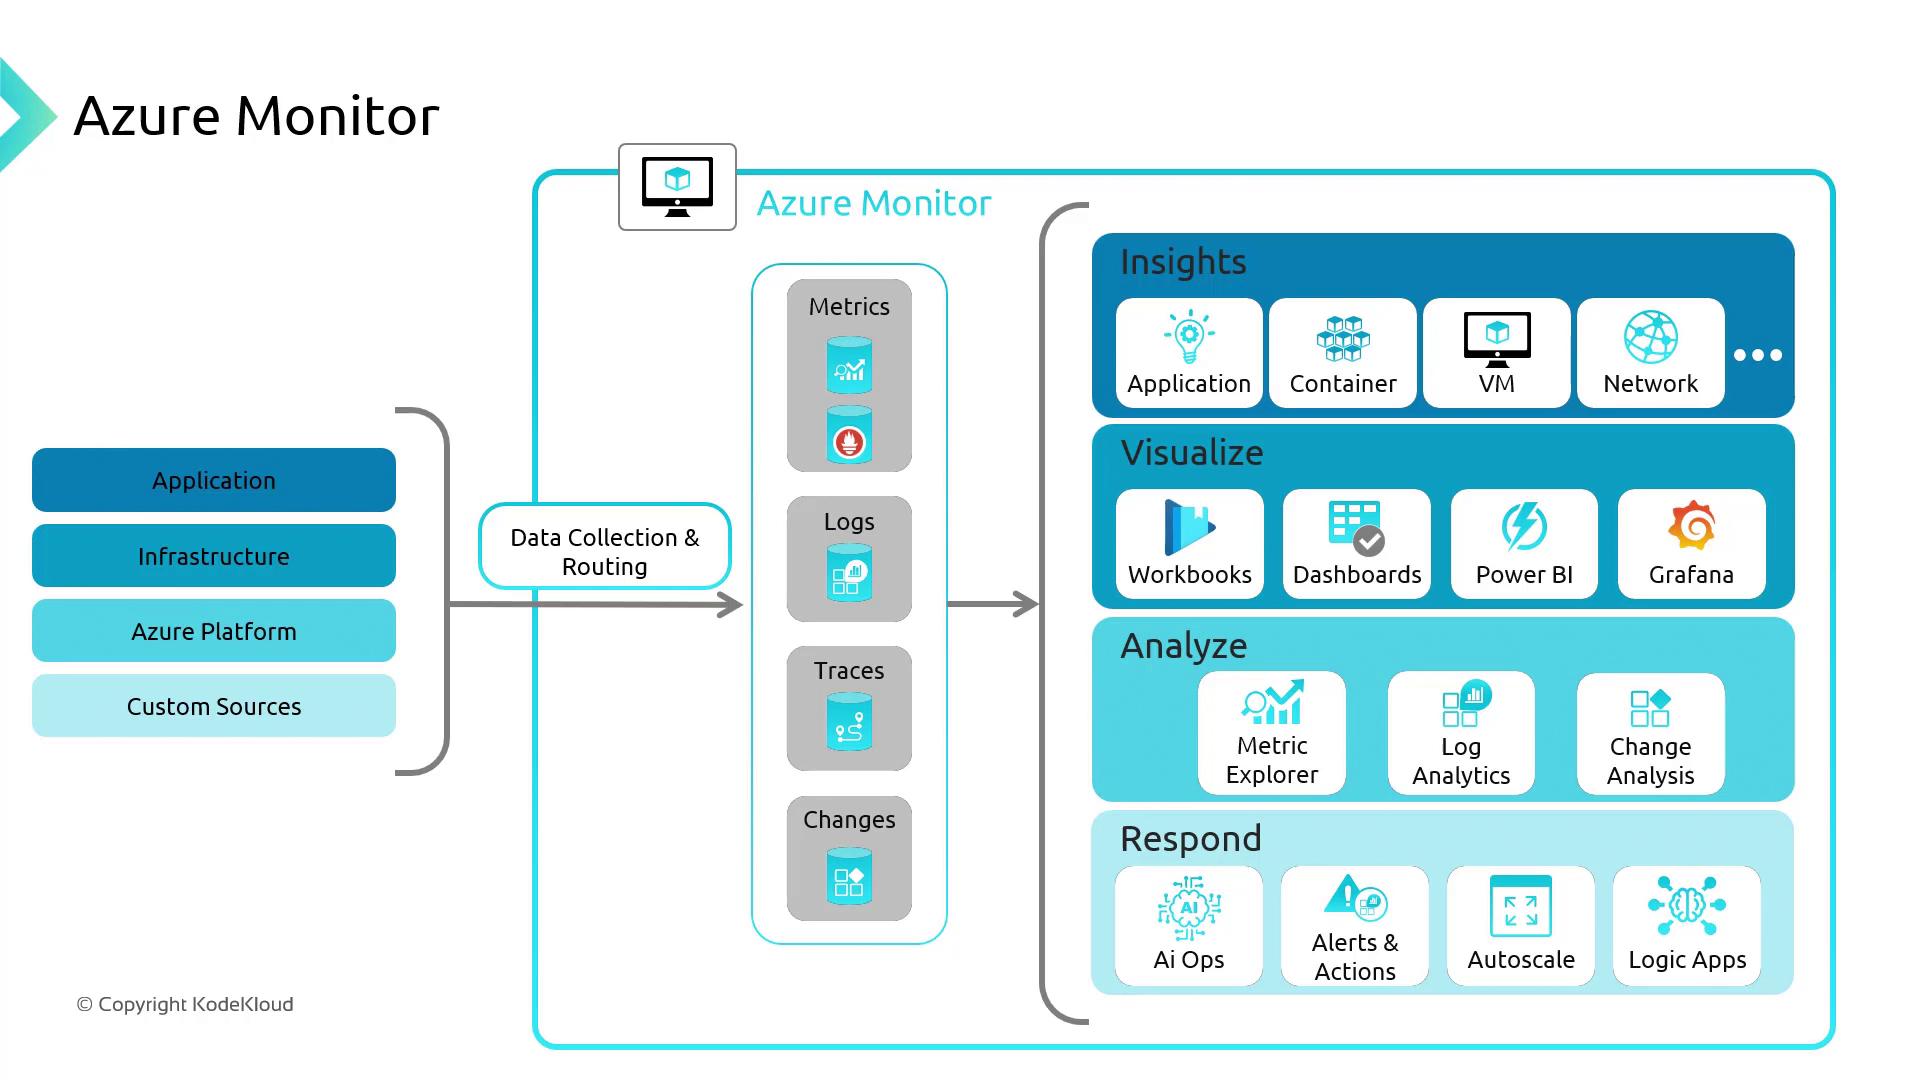
Azure Monitor is Microsoft’s native solution for collecting and analyzing metrics and logs from applications, infrastructure, and Azure services. With Container Insights for Azure Kubernetes Service (AKS), you gain end-to-end visibility into your containerized workloads—helping you troubleshoot performance issues, improve availability, and optimize resource utilization.
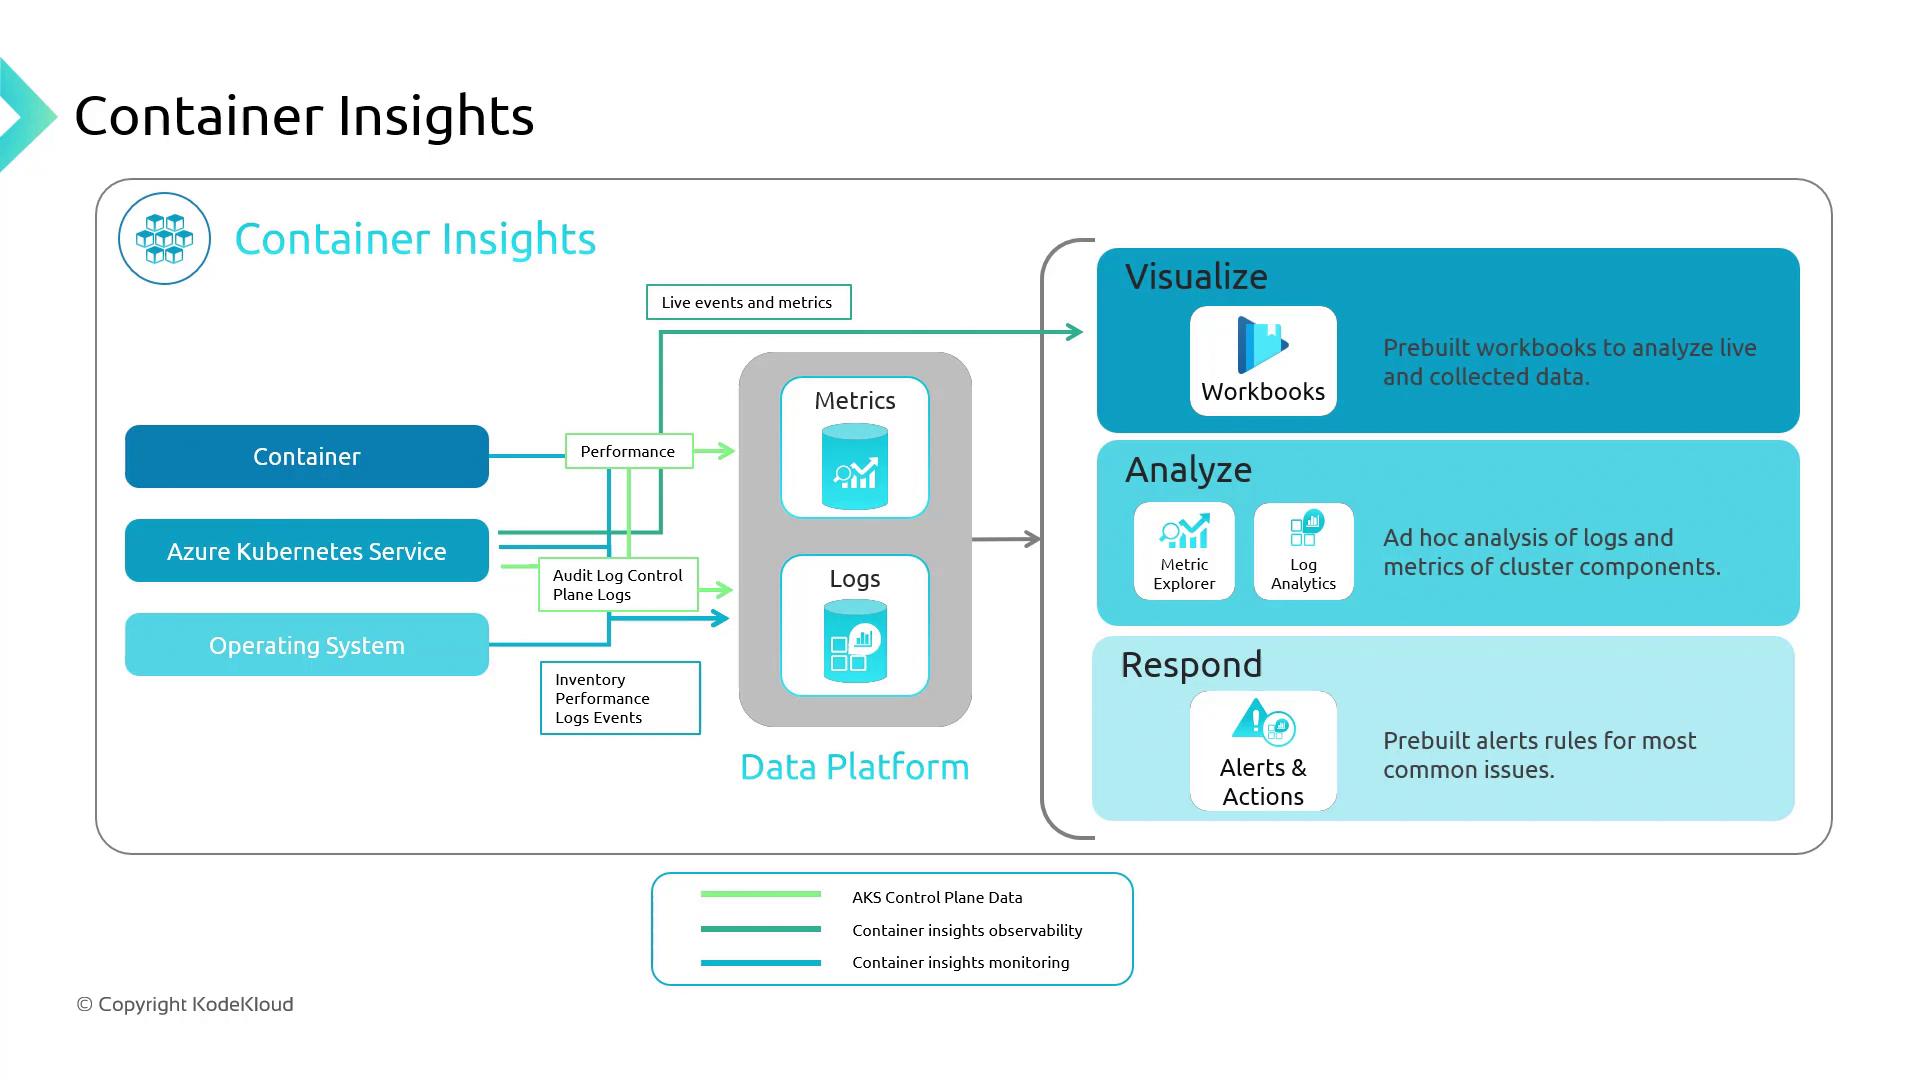
Container Insights is an Azure Monitor feature built specifically for AKS clusters. It collects performance and health data across your nodes and containers, allowing you to:
Detect resource hotspots
Trace application failures
Set up proactive alerts
Container Insights aggregates two primary data types:
Data Type
Description
Examples
Metrics
Numerical values over time
CPU usage, memory consumption, network I/O
Logs
Structured or unstructured event records
Container logs, system events, application traces
Metrics power visualizations and alerts, while logs are stored in a Log Analytics workspace for ad-hoc querying and root-cause analysis.
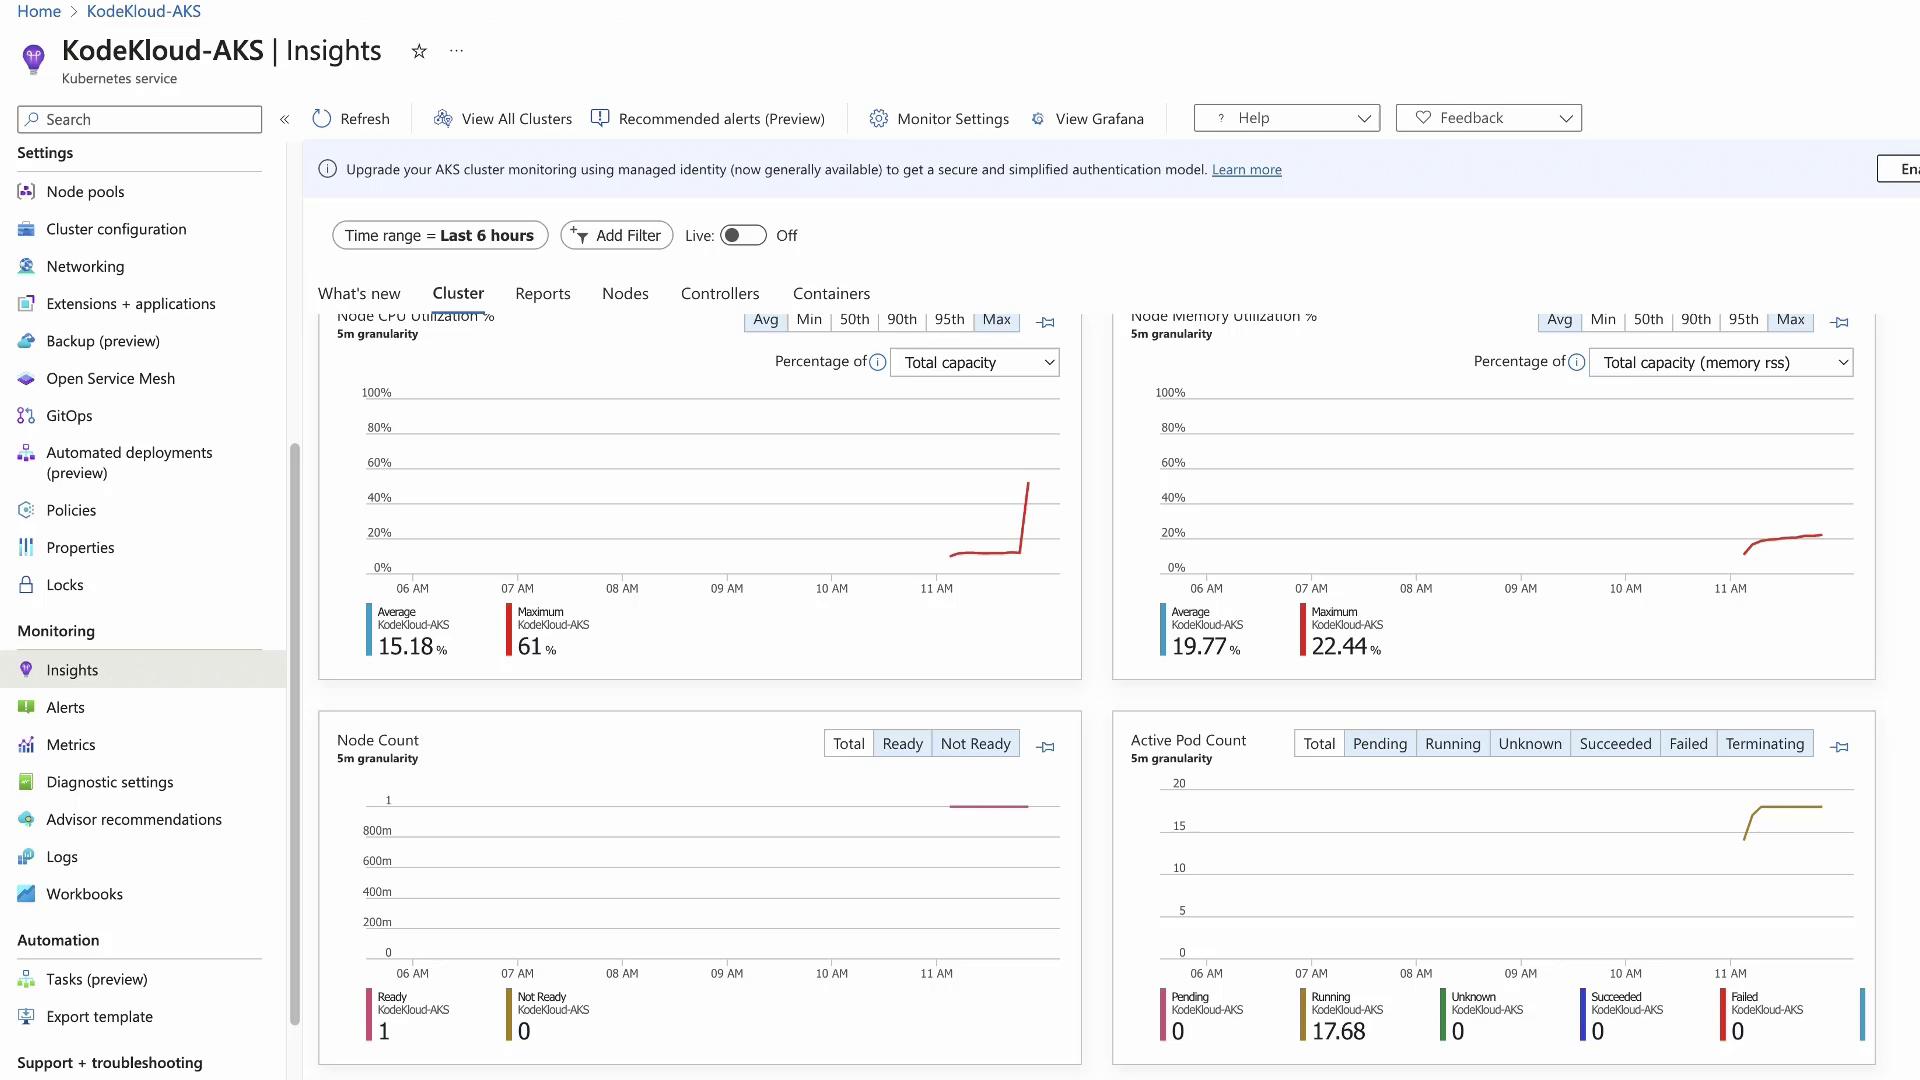
This generates 10 CPU workers, driving node CPU usage upward. In the portal, return to Container Insights > Cluster, enable live updates, and watch the CPU graph spike.
Nodes tab: Displays per-node CPU/memory metrics. The stressed node will be easily identifiable.
Containers tab: Lists every container and its performance metrics.
Click on test-shell to view its live status, console output, and event timeline:
4 mins ago [Pod] [test-shell] Pulling image "ubuntu"4 mins ago [Pod] [test-shell] Pulled: Successfully pulled image "ubuntu" in 1.80s4 mins ago [Pod] [test-shell] Created: Created container test-shell4 mins ago [Pod] [test-shell] Started: Started container test-shell243 secs ago [Pod] [test-shell] Scheduled: Assigned to aks-agentpool-77882287-vmss000000
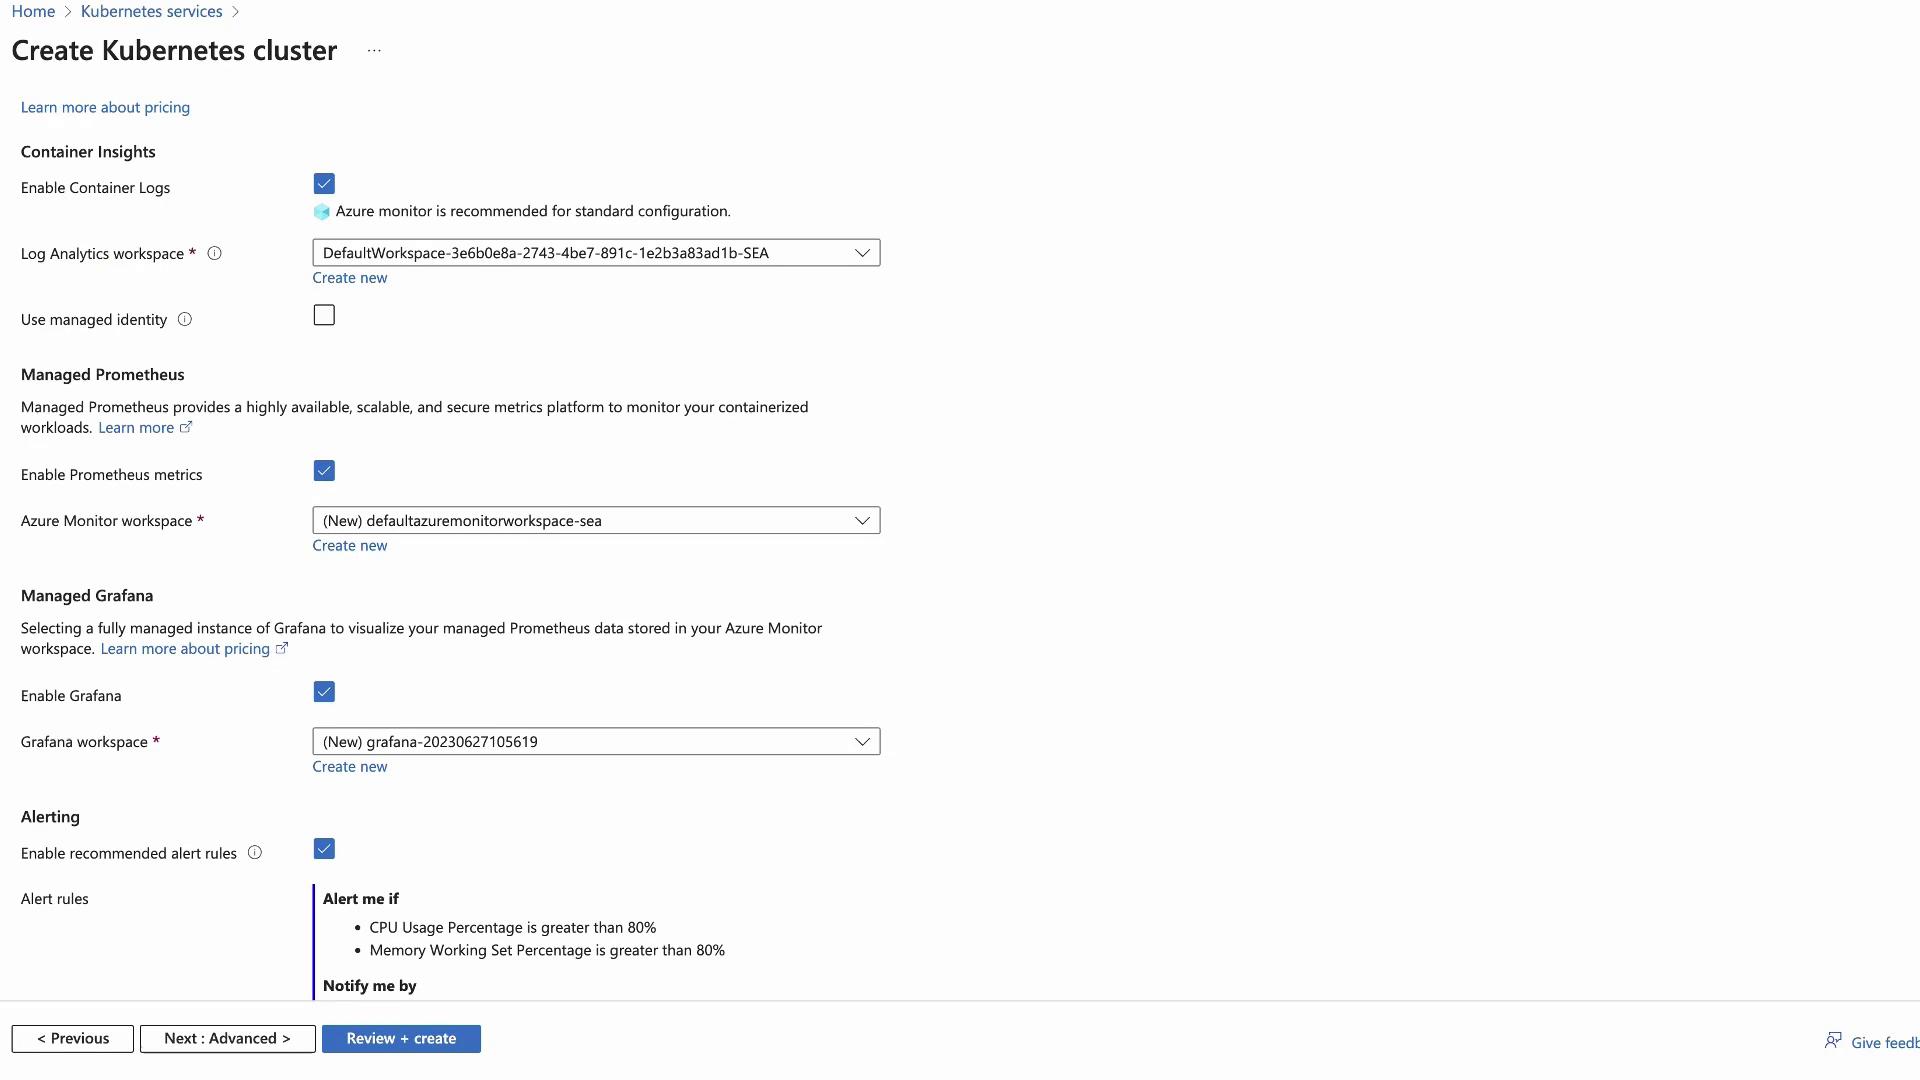
Azure Monitor charges based on the volume of data ingested into Log Analytics. Enabling Managed Prometheus increases ingestion volume, and Azure Managed Grafana incurs additional per-user costs.
Review your ingestion rates and retention settings in your Log Analytics workspace to optimize costs.
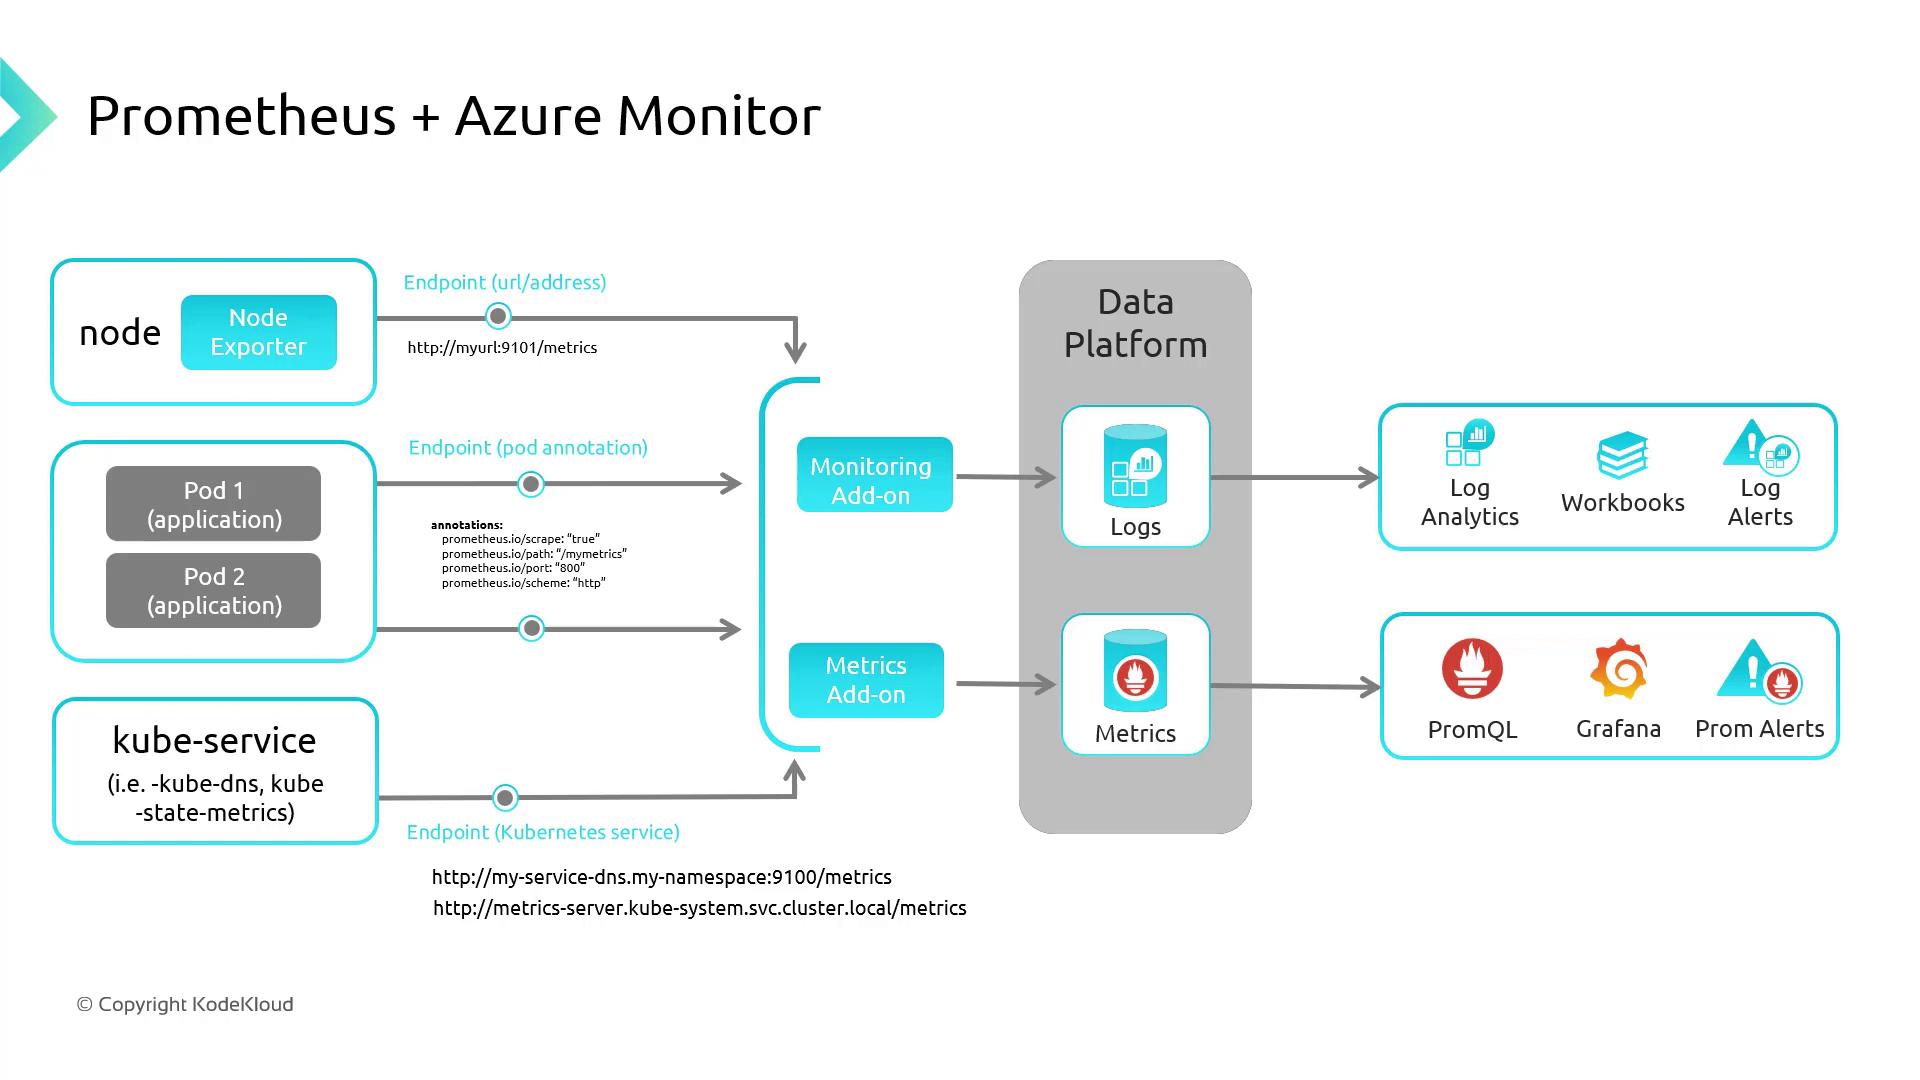
Azure Monitor for Containers can natively scrape Prometheus endpoints—no self-hosted server needed. Expose your metrics endpoint to AMA, and configure PromQL alerts.
Component
Purpose
Prometheus
Pull-based metric collection and querying (PromQL)
Grafana
Dashboarding and multi-source alerting
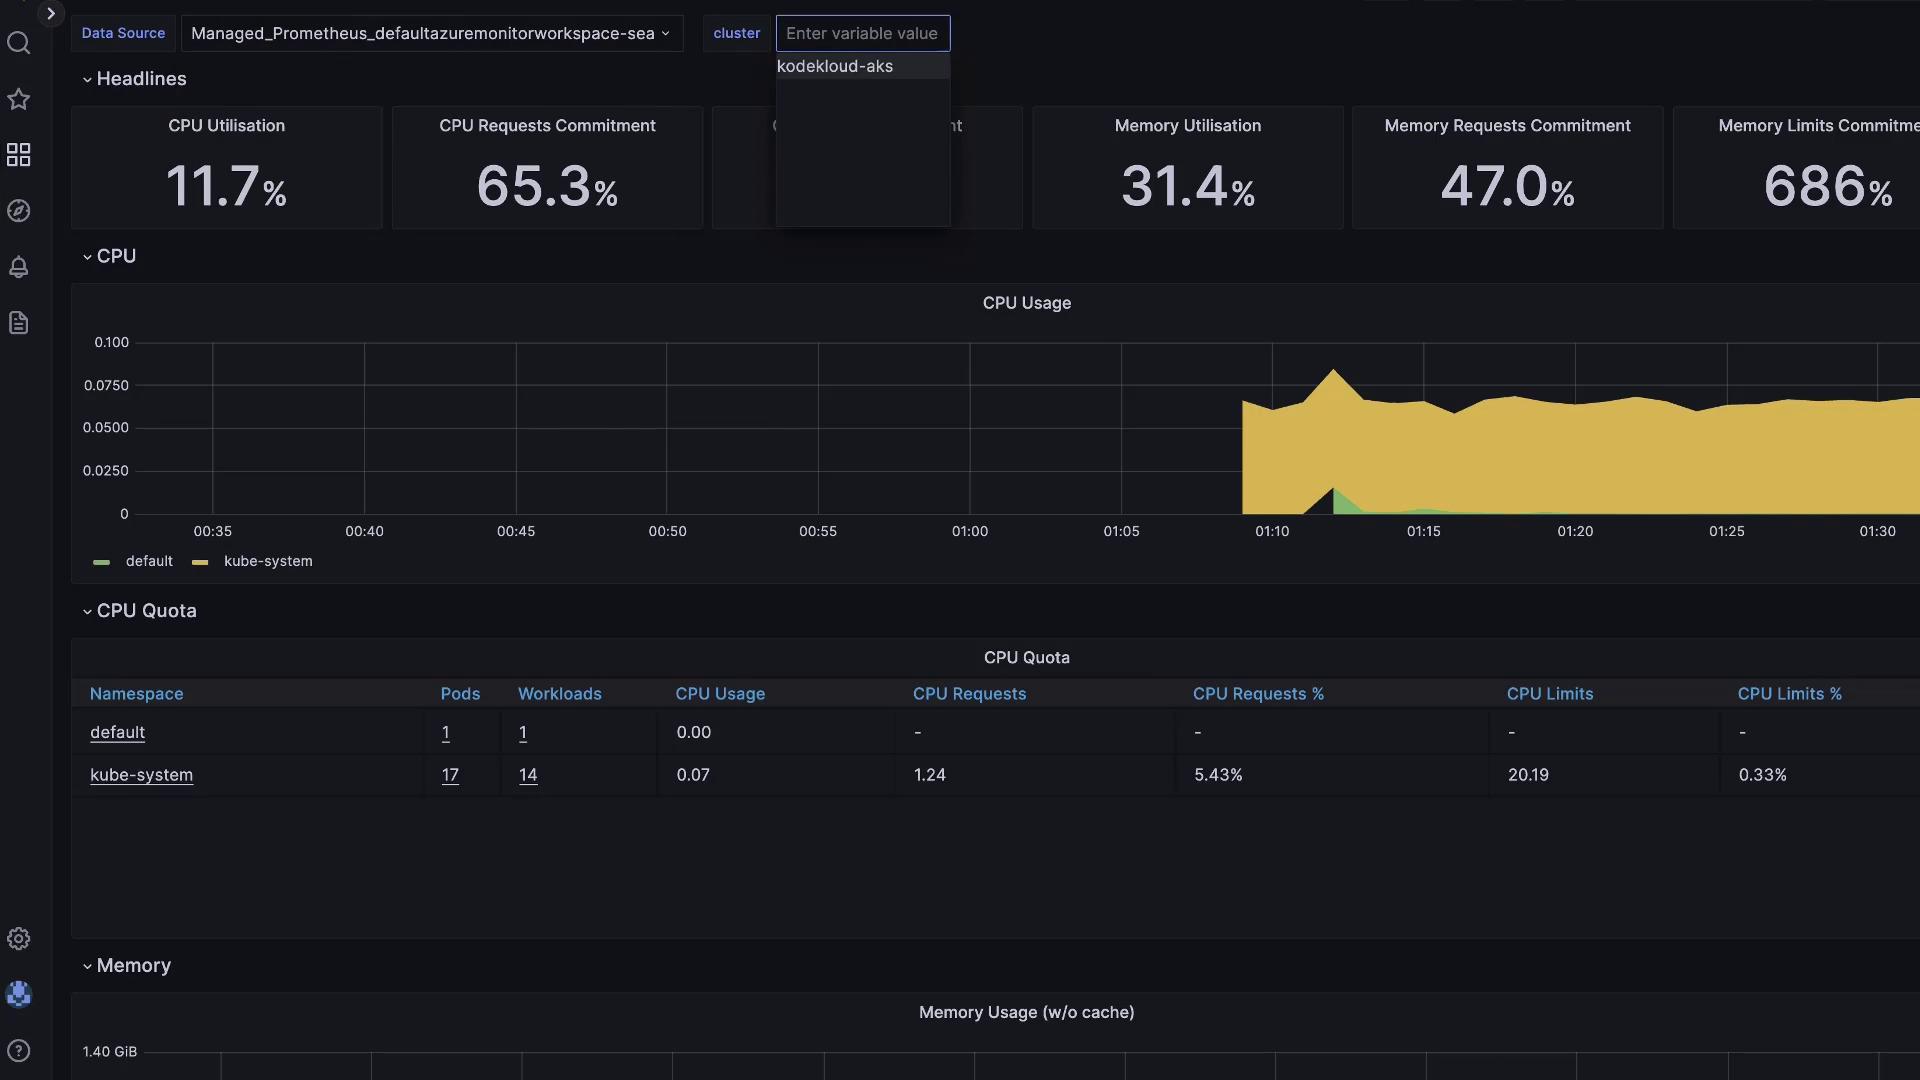
If you enabled Grafana during cluster creation:
Open the Grafana resource in the Azure portal.
Copy the Instance URL and sign in with Azure AD.
Browse pre-built Azure dashboards under Dashboards.